
STR Lodging Tax Diversion: $256M Redirected While Colorado Ski Occupancy Craters
Where $256 Million in Colorado Lodging Taxes Actually Goes
The scale of the diversion dwarfs what Colorado spends to attract visitors. The Colorado Tourism Office's annual budget sits at approximately $20 million and has remained flat since 2016. Over the same period, advertising costs climbed 40%, meaning the office's real purchasing power for tourism promotion has eroded by roughly one-third. In 2024, Colorado collected $290 million in state lodging taxes — more than 14 times the tourism marketing budget.
"Visitors are paying a lot more in taxes for lodging, but communities are not getting more money to work with to market their destinations." — Dave Santucci, tourism marketing expert, via The Colorado Sun
The funded programs are individually defensible: workforce housing in mountain towns where median home prices exceed $1 million, childcare subsidies that help hospitality workers afford to live where they work, and road maintenance strained by seasonal visitor traffic. But the cumulative effect is an industry funding its own displacement. Lodging tax revenue that once circulated within the tourism ecosystem — attracting visitors who generated more lodging tax revenue — now exits that cycle entirely.
AirROI Data: Colorado Ski Town Occupancy Is Cratering
AirROI's trailing-twelve-month data across five Colorado mountain markets paints a stark picture. Every market shows occupancy below 42%, and winter months — the revenue engine for these destinations — have deteriorated sharply.
| Market | TTM Occupancy | TTM ADR | TTM RevPAR | TTM Revenue | Active Listings |
|---|---|---|---|---|---|
| Breckenridge | 42% | $573.90 | $247.10 | $46,676 | 3,224 |
| Aspen | 40% | $1,025.20 | $417.30 | $64,310 | 620 |
| Telluride | 39% | $653.50 | $241.80 | $50,715 | 635 |
| Steamboat Springs | 35% | $597.40 | $207.10 | $35,409 | 2,243 |
| Vail | 33% | $803.40 | $258.60 | $40,014 | 1,607 |
The year-over-year winter declines are more alarming than the TTM averages suggest. In Breckenridge, February occupancy fell from 65% in 2025 to 48% in 2026 — a 17-point drop that translated to a 14.9% decline in average monthly revenue, from $12,495 to $10,635. Telluride's February occupancy collapsed from 57% to 38%, a 19-point decline. January showed a similar pattern: Breckenridge down 9 points (56% to 47%), Telluride down 12 points (42% to 30%).
Vail's 2026 budget assumes a 6.8% decline in total revenues from 2024, and AirDNA reports Colorado resort STR bookings down anywhere from 5% (Vail) to 35% (Telluride). Weather is a factor — Colorado's snow drought through February 2026 has deterred visitors. But weather events are temporary; tax policy is structural. When the snow returns, the taxes remain.
How Colorado Compares: STR Tax Rates Across the U.S.
Colorado mountain towns now rank among the highest effective STR tax jurisdictions in the nation. But the rate itself is only half the story — what matters more is where the money goes.
| Jurisdiction | Total Effective Tax Rate | Primary Funding Allocation |
|---|---|---|
| Seattle, WA | ~23.6% | Mixed (tourism + general fund) |
| Maui, HI | 18.5% | Environmental conservation |
| Austin, TX | 17% | Tourism + convention center |
| Nashville, TN | 15.25% | Tourism + convention center |
| Rhode Island | 14% | General fund + tourism |
| Breckenridge, CO | 12.3-16.2% | Housing, childcare, roads, police |
Each of these jurisdictions has made a policy choice about who bears the cost of public services that tourism generates. The difference is that most retain at least partial tourism reinvestment. Colorado's approach — redirecting 100% of new lodging tax revenue away from the industry that generates it — is a policy experiment with no comparable precedent at this scale.
The Tax-and-Redirect Feedback Loop
The mechanism is straightforward: higher lodging taxes increase the total cost to guests, which suppresses demand — particularly in price-sensitive shoulder seasons. Lower demand reduces host revenue and tax collections, which may pressure communities to raise rates further to maintain funding for the programs they now depend on.
Colorado's statewide tourism data suggests the loop has already begun. Travel spending in 2024 grew just 0.5% to $28.4 billion — well below the inflation rate, meaning real tourism spending actually declined. Winter lodging occupancy across Colorado and Utah dropped 6.7% year-over-year. And while tourism worker wages grew 7.1% (partly because the tax-funded programs are improving worker retention), the visitors generating those wages are disappearing.
"Communities risk losing their appeal by approaching a tipping point." — Cynthia Eichler, hospitality industry leader, via The Colorado Sun
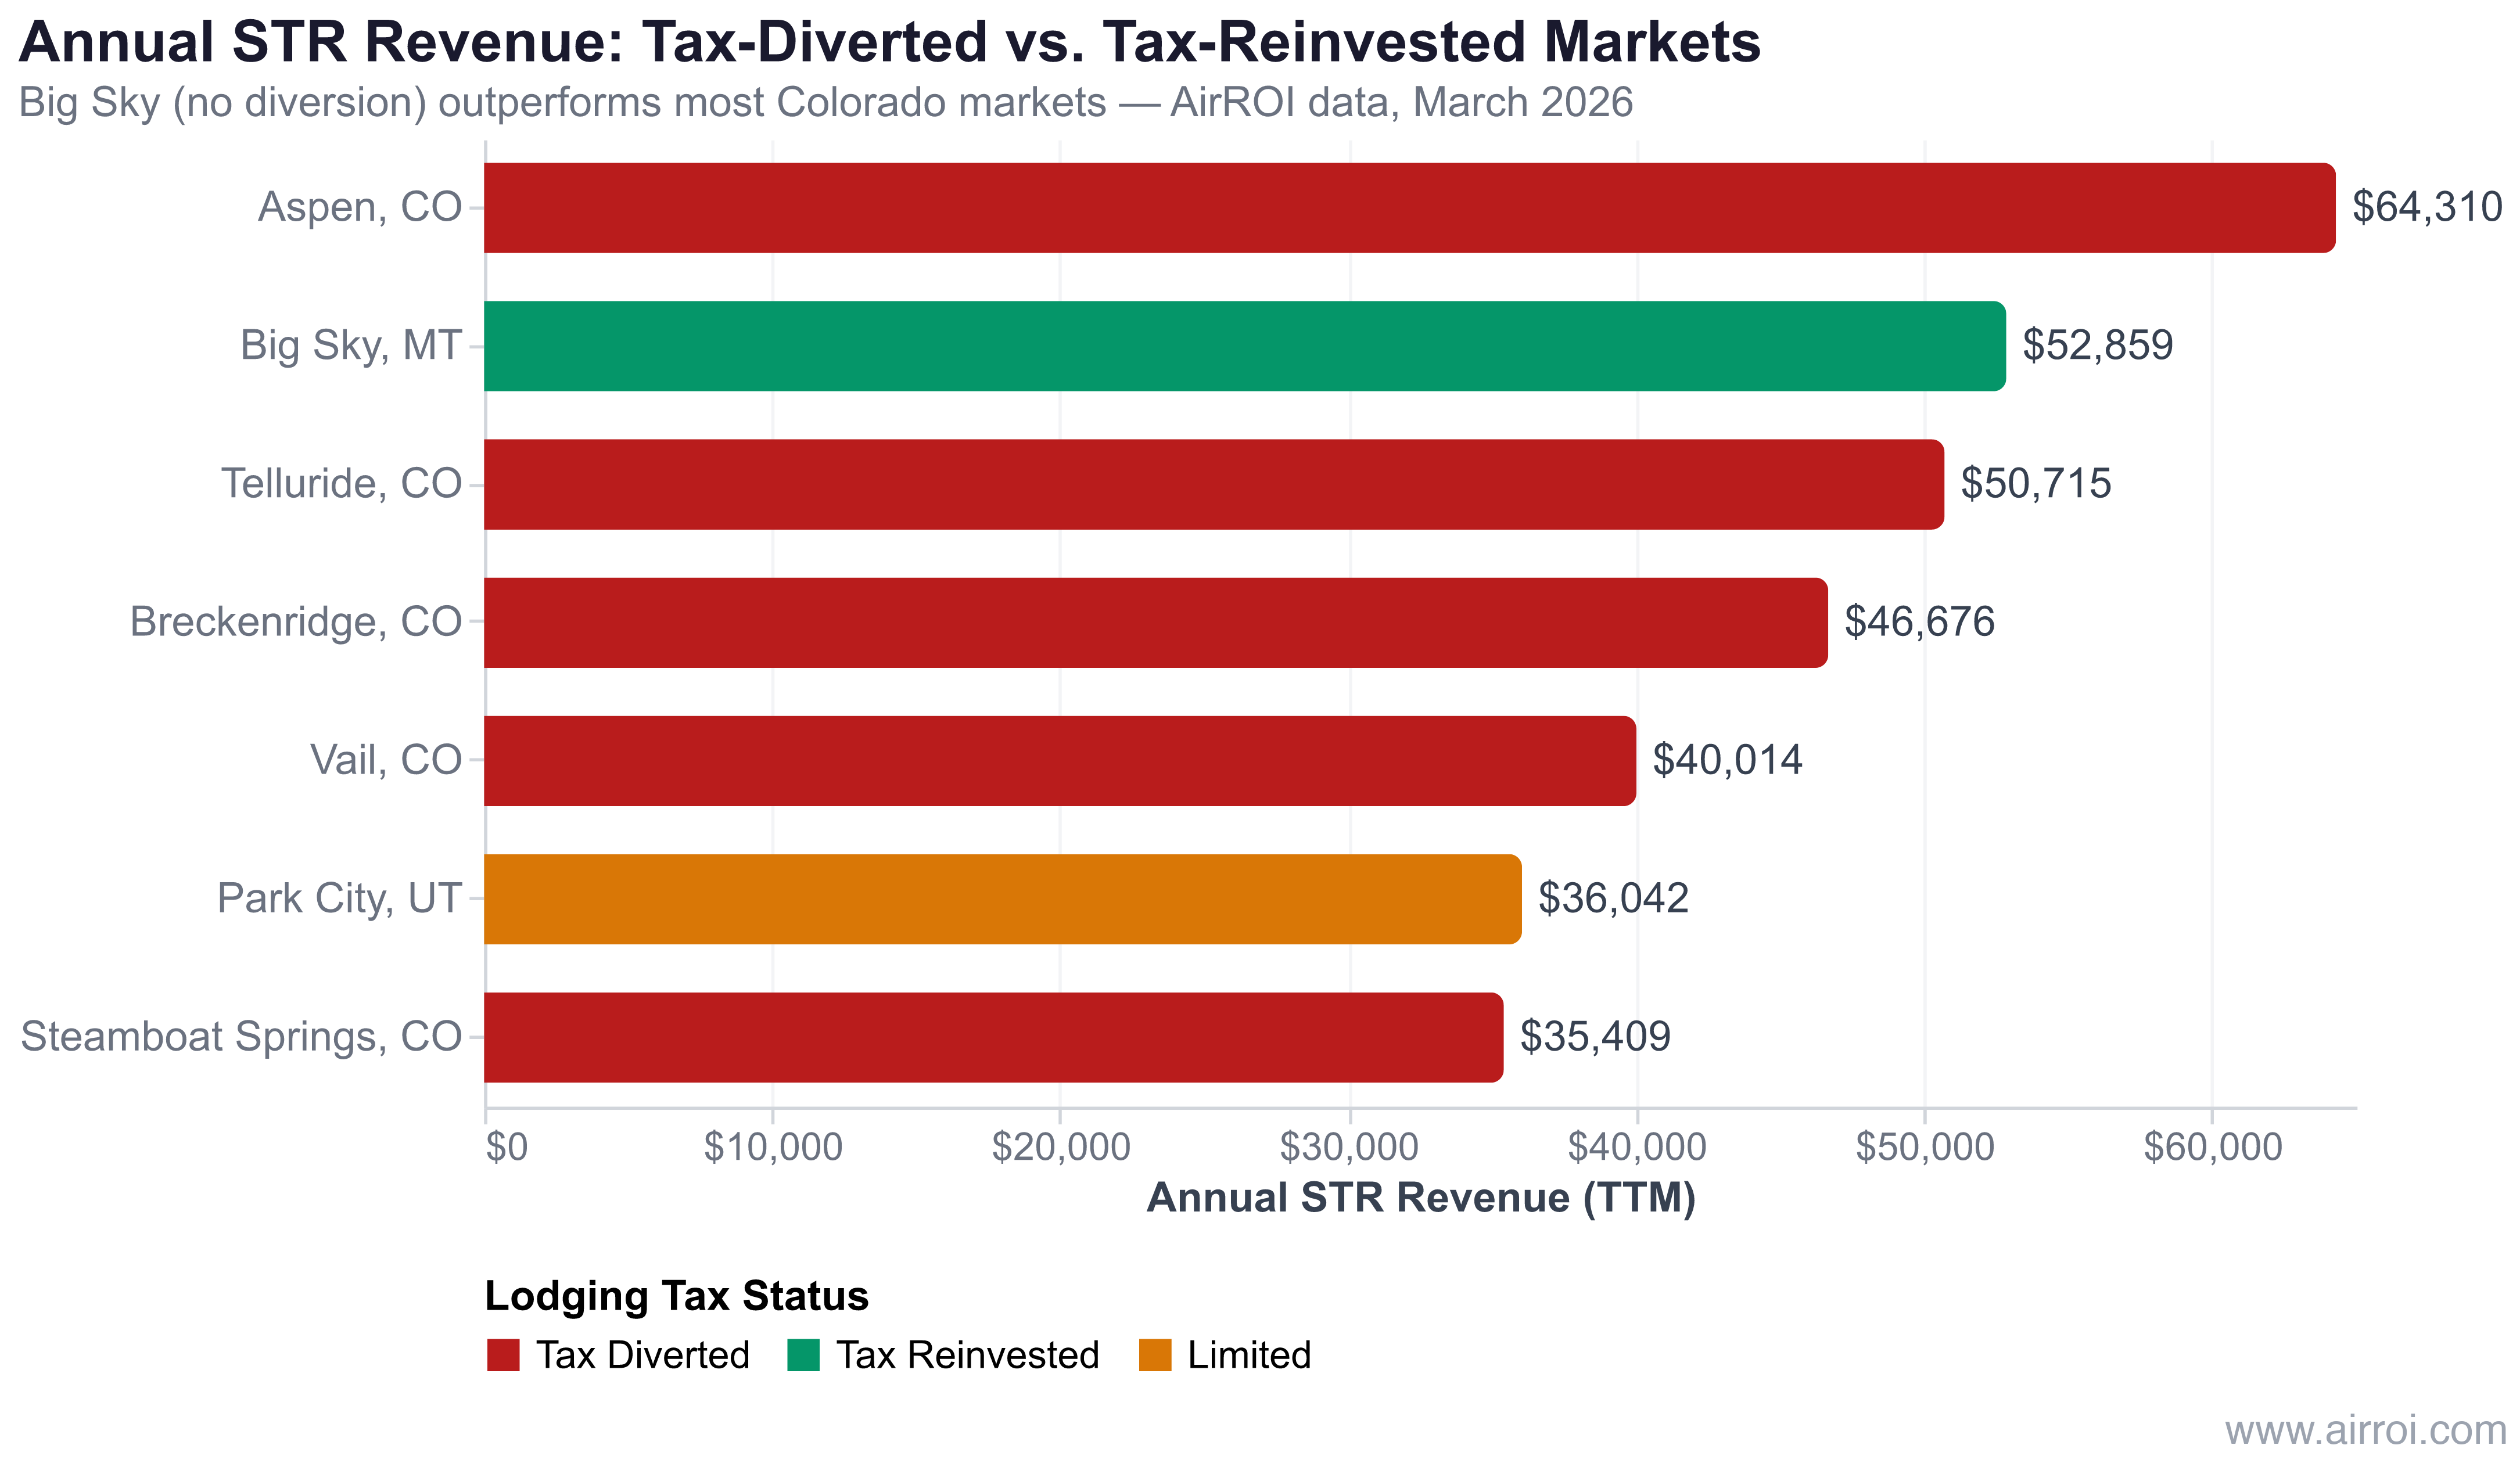
Comparison data sharpens the concern. Big Sky, Montana — a comparable mountain resort market without Colorado's tax diversion framework — generates $52,859 in median annual revenue per listing, compared to $46,676 in Breckenridge and $35,409 in Steamboat Springs. Big Sky's 36% TTM occupancy exceeds Vail (33%) and Steamboat (35%), and its $274.50 RevPAR tops every Colorado market except Aspen.
| Market | TTM Revenue | TTM RevPAR | Tax Diversion? |
|---|---|---|---|
| Aspen, CO | $64,310 | $417.30 | Yes |
| Big Sky, MT | $52,859 | $274.50 | No |
| Telluride, CO | $50,715 | $241.80 | Yes |
| Breckenridge, CO | $46,676 | $247.10 | Yes |
| Vail, CO | $40,014 | $258.60 | Yes |
| Park City, UT | $36,042 | $238.90 | Limited |
| Steamboat Springs, CO | $35,409 | $207.10 | Yes |
Montana's resort tax system funds both local services and tourism promotion, maintaining the reinvestment loop that Colorado's model disrupts. The performance gap suggests that market-level returns are sensitive not just to tax rates but to tax allocation — a variable most STR investors overlook entirely.
The programs funded by diverted lodging taxes — housing, childcare, infrastructure — address real needs in mountain communities where the cost of living has been inflated partly by tourism itself. But funding them exclusively through an industry-specific tax on the very sector they burden creates a structural tension. When the $76.9 million in 2026 diverted taxes generates diminishing returns because fewer guests arrive to pay them, communities face an uncomfortable reckoning.
What Hosts and Investors Should Do Now
Tax burden and allocation policy have become first-order underwriting variables for STR acquisitions. Here is a practical framework for navigating the new landscape.
Audit your total tax burden. Calculate the effective tax rate on every dollar of gross booking revenue, including accommodation taxes, sales taxes, county surcharges, and any special district levies. In Breckenridge, this totals 12.3-16.2% depending on location. Know your number.
Engage in advocacy. Local tourism boards and industry associations are the primary channel for influencing tax allocation decisions. The communities making these choices respond to organized constituencies. Silence cedes the debate to housing advocates and infrastructure proponents whose funding models depend on continued lodging tax diversion.
Frequently Asked Questions
Since 2022, 39 Colorado communities have redirected $256.6 million in lodging taxes to housing, childcare, roads, and public safety. For 2026 alone, these jurisdictions project $76.9 million in diverted tax revenue. None of this funding supports tourism marketing or destination infrastructure.
Breckenridge STR operators face approximately 12.3-16.2% in combined accommodation and sales taxes. This includes a 3.4% town accommodation tax, 2% Summit County lodging tax, 1.9% state tax, and approximately 8.875% sales tax. Additional local surcharges may apply depending on the property location.
Yes. AirROI data shows Breckenridge occupancy dropped 17 percentage points year-over-year in February 2026, falling from 65% to 48%. Telluride dropped 19 points from 57% to 38%. Steamboat Springs March bookings are down 10% and Vail is down 5%. Colorado resort markets are underperforming the national STR average.
Yes. Hawaii raised its Transient Accommodations Tax to 11% in 2026 for environmental projects, Rhode Island introduced a new 14% combined STR tax, and Illinois added STRs to its Hotel Operators' Occupation Tax in 2025. Colorado's model is distinctive because 100% of new lodging tax revenue exits the tourism ecosystem entirely.
Tax rate alone is insufficient. Investors should evaluate where tax revenue is allocated. Markets that reinvest lodging taxes in tourism marketing sustain visitor demand long-term. Markets that redirect taxes to non-tourism purposes create structural drag on occupancy and revenue. Use AirROI Atlas to compare after-tax RevPAR across markets before making acquisition decisions.