
FIFA World Cup 2026 Airbnb Data: How the Group Draw Reshaped STR Demand Overnight
Maria Gonzalez was watching the FIFA World Cup 2026 group draw live from her living room in Kansas City on December 5, 2025, when her phone started buzzing. One notification, then another, then a cascade. By the time Argentina's name landed in Group F -- with a June 16 match at Arrowhead Stadium -- she had three new booking requests for her two-bedroom Airbnb. By midnight, her calendar for the entire tournament window was half full, and her World Cup 2026 Airbnb listing was commanding rates she had never imagined possible. Maria's experience was not unique. Across all 11 US host cities, the group draw triggered what might be the most concentrated FIFA World Cup 2026 short-term rental demand surge in the history of event-driven hospitality.
The December 5 Draw Changed Everything
The group draw changed that overnight. Suddenly, Argentine fans could circle June 16 in Kansas City. English supporters could plan routes between New York and Philadelphia. Mexican fans -- hosting the opener on June 12 -- could see their entire group-stage path laid out across familiar territory.
For short-term rental hosts, the draw functioned like a starting gun. Vague "maybe I should list my place" conversations became urgent booking activity. And the data proves it.
Our thesis is simple: by comparing AirROI's November 2025 snapshot (pre-draw) against our December 2025 snapshot (post-draw), we can isolate and quantify the draw's impact on World Cup 2026 booking trends across every major US host city.
Methodology -- How We Measured the Draw Effect
Our Two-Snapshot Approach
AirROI's data platform continuously tracks forward-looking booking data for active Airbnb listings. For this analysis, we pulled two complete snapshots:
- November 2025 snapshot: Captured before the December 5 group draw. Represents the baseline demand signal -- bookings driven by general tournament awareness, not specific matchups.
- December 2025 snapshot: Captured after the draw. Represents demand that includes the matchup-specific surge.
Across both snapshots, we analyzed approximately 115,000 active listings spanning 14 metro areas that encompass the 11 US host cities (some venues like the New York metro are served by multiple markets: New York City, Jersey City, and Newark).
The key metric is booking pacing -- the percentage of available listing-days during the World Cup period (June 11 through July 19, 2026) that had already been booked at the time of each snapshot. A city with 10% pacing in November and 16% pacing in December gained 6 percentage points of new bookings in a single month, a signal that is almost entirely attributable to the draw.
For pricing, we tracked the average listed nightly rate -- the price hosts set for their World Cup-period availability -- to see how hosts adjusted their pricing strategies in response to the surge.
For context on why accurate, timely data matters for this kind of analysis, see our deep dive on Why Accurate Airbnb Data is Crucial.
The Pacing Surge: Which Cities Moved First
The draw did not move every market equally. Some cities saw bookings explode; others registered a steady but modest uptick. The pattern reveals which fan bases mobilized fastest and which markets were already primed for event-driven rental demand.
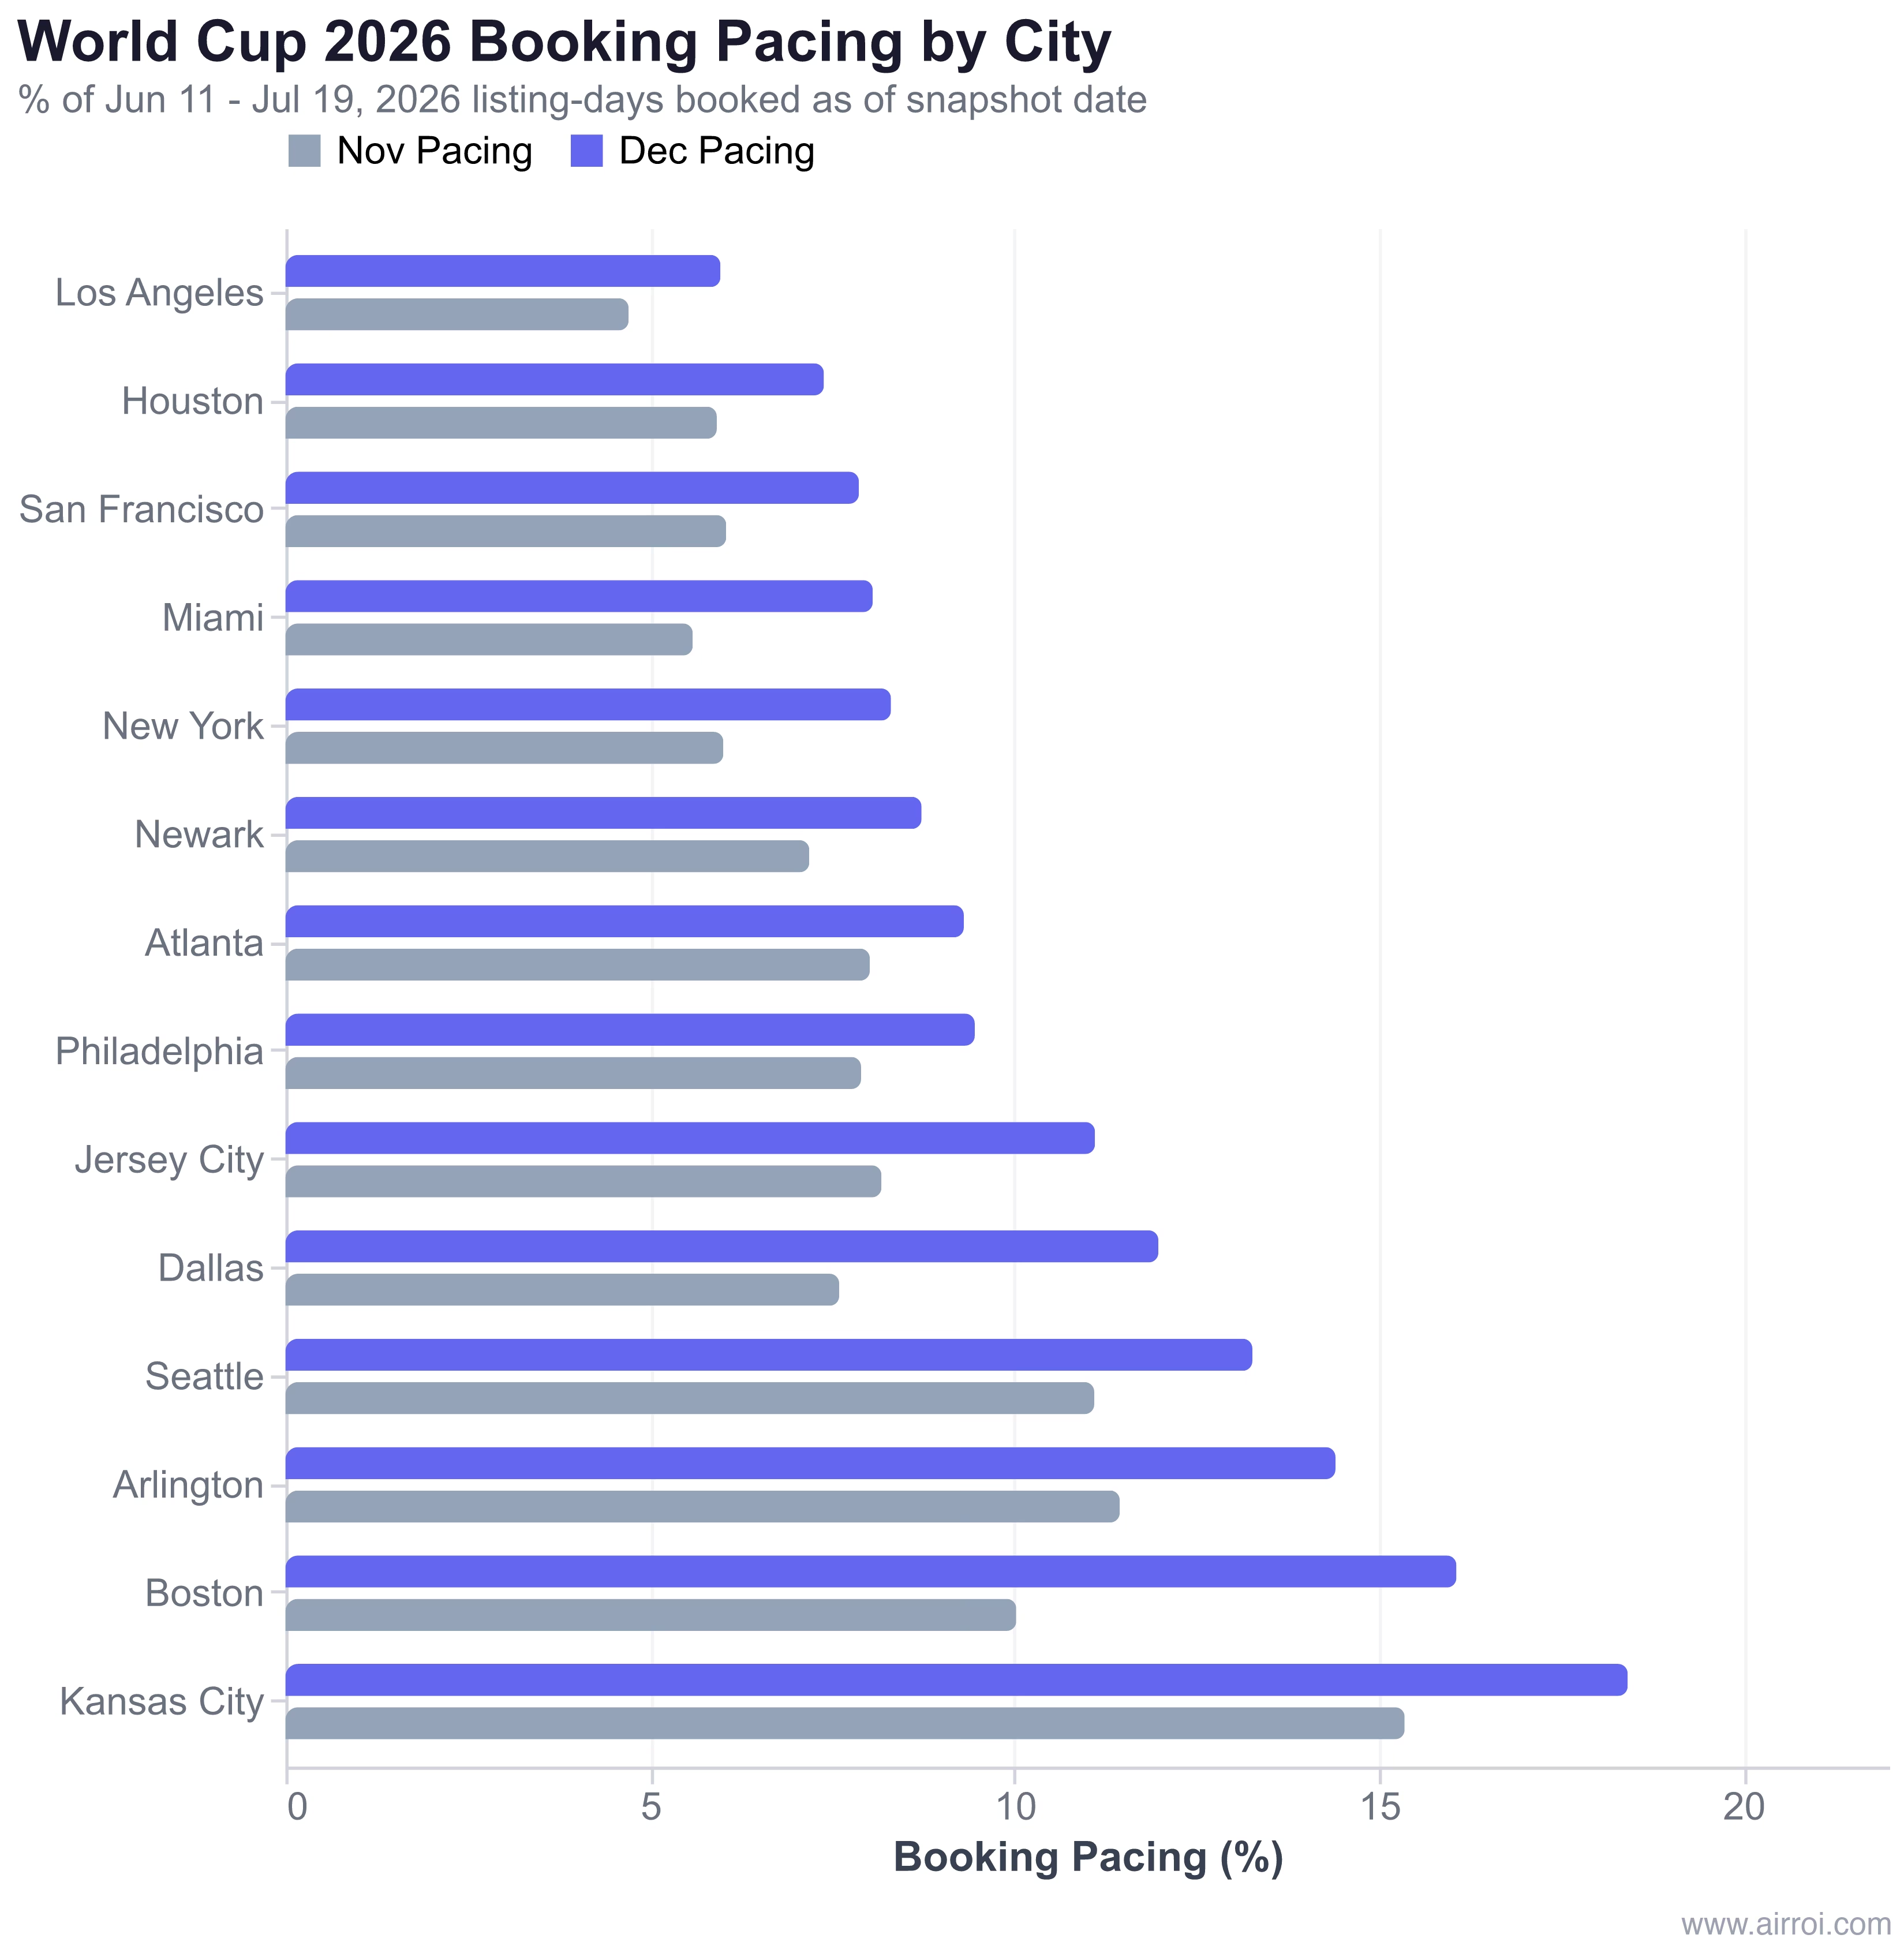
The standout stories:
Boston surged 60.2%. Pacing jumped from 10.03% to 16.07%, the largest percentage increase of any city. Boston's Gillette Stadium will host marquee Group B matches, and the city's combination of limited STR supply (just 3,492 active listings) and strong international visitor appeal created a perfect storm. When you have fewer listings absorbing the same demand shock, pacing moves faster.
Dallas jumped 57.6%. From 7.60% to 11.98% -- a 4.38 percentage-point swing that reflects both the AT&T Stadium matchup draw and the broader DFW metro's appeal as a Central time zone hub. With only 5,470 listings, the supply constraint amplified the pacing effect.
Kansas City held the highest absolute pacing at 18.42%. While its percentage increase was a more modest 19.9%, Kansas City entered December already leading the pack at 15.36%. The reason? Argentina. Industry data shows that the June 16 Argentina match alone pushed KC occupancy for that date from approximately 3% to 33%, with ADR leaping from $190 to $435. Maria Gonzalez's experience was playing out across the entire market.
Miami surged 44.2% despite having the second-largest inventory in this group (10,207 listings). The combination of Latin American fan bases, established international tourism infrastructure, and Hard Rock Stadium's marquee matchups made Miami one of the most responsive markets.
Full City-Level Pacing Data
| City | Nov 2025 Pacing | Dec 2025 Pacing | Change (pp) | % Increase |
|---|---|---|---|---|
| Kansas City | 15.36% | 18.42% | +3.06 | +19.9% |
| Boston | 10.03% | 16.07% | +6.04 | +60.2% |
| Arlington | 11.45% | 14.41% | +2.96 | +25.9% |
| Seattle | 11.10% | 13.27% | +2.17 | +19.5% |
| Dallas | 7.60% | 11.98% | +4.38 | +57.6% |
| Jersey City | 8.18% | 11.11% | +2.93 | +35.8% |
| Philadelphia | 7.90% | 9.46% | +1.56 | +19.7% |
| Atlanta | 8.02% | 9.31% | +1.29 | +16.1% |
| Newark | 7.19% | 8.73% | +1.54 | +21.4% |
| New York | 6.01% | 8.31% | +2.30 | +38.3% |
| Miami | 5.59% | 8.06% | +2.47 | +44.2% |
| San Francisco | 6.05% | 7.87% | +1.82 | +30.1% |
| Houston | 5.92% | 7.39% | +1.47 | +24.8% |
| Los Angeles | 4.71% | 5.97% | +1.26 | +26.8% |
Key takeaway: Every single US host city saw pacing increase after the draw. Not one market was left behind. But the magnitude varied by a factor of nearly 5x between Boston (+60.2%) and Atlanta (+16.1%).
The Price Reaction: ADR and Listed Rate Changes
Bookings tell only half the story. The other half is what hosts did with their prices. When demand surges, sophisticated hosts reprice upward -- but the speed and magnitude of that repricing varied wildly across markets.
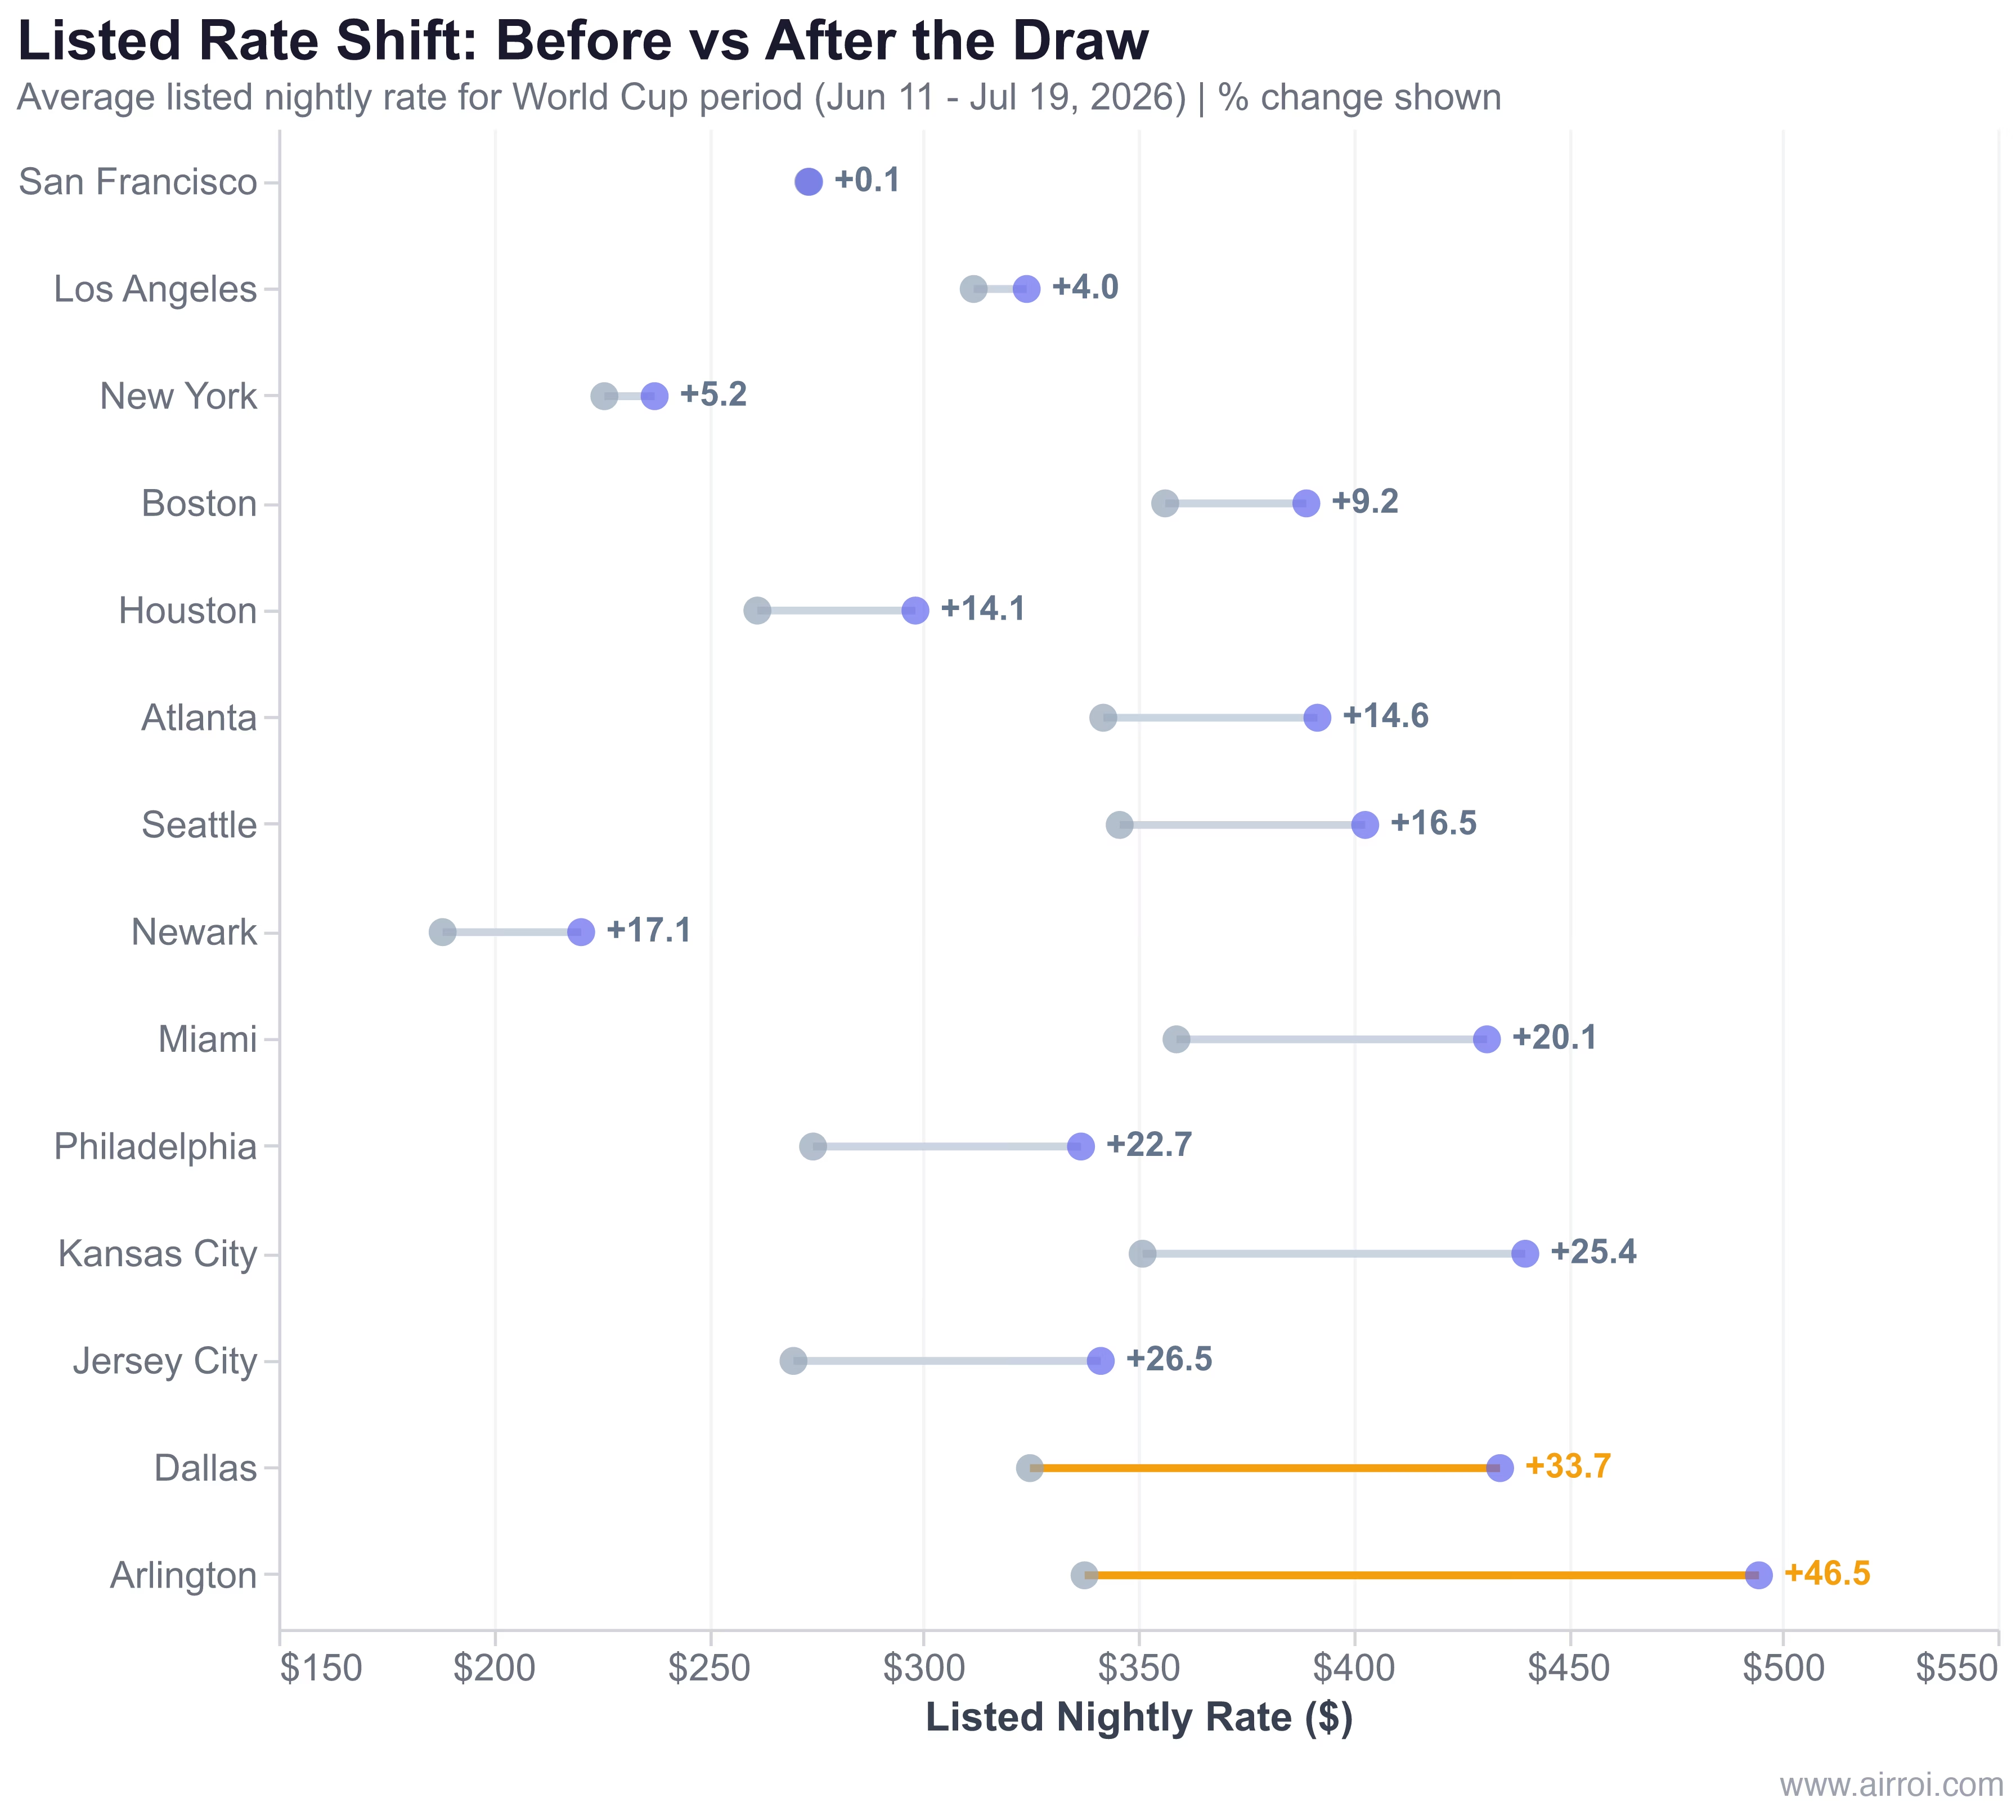
The Aggressive Repricers
Arlington led the Airbnb World Cup pricing surge at +46.5%. Average listed rates for the World Cup window leapt from $337.62 to $494.52 -- nearly $500 per night. This is a market of only 953 active listings clustered around AT&T Stadium, where hosts are acutely aware of event-driven pricing dynamics. When you have watched your neighborhood fill up for Cowboys games and college football playoffs, you know exactly how to price a World Cup.
Dallas followed at +33.7%, with listed rates climbing from $324.91 to $434.29. Combined with its 57.6% pacing surge, Dallas-Fort Worth represents perhaps the most dynamic market reaction in the country.
Kansas City repriced aggressively at +25.4%, pushing average listed rates to $440.16 -- the second-highest listed rate of any city after Arlington. For a market where the trailing twelve-month average ADR is just $176.29, hosts are betting that World Cup guests will pay a significant premium.
The Surprising Holdouts
San Francisco barely moved at +0.1%. Listed rates went from $273.32 to $273.53 -- essentially flat. This is remarkable for a city that will host matches at Levi's Stadium. The explanation likely lies in San Francisco's deep, sophisticated supply base (5,977 listings) and a host population that has weathered enough tech conferences and Dreamforce events to avoid panic pricing.
New York moved only +5.2%, from $225.89 to $237.59. With nearly 20,000 listings -- the largest supply pool of any host city -- New York's market has enough depth to absorb demand surges without dramatic price spikes. The city's strict STR regulations also mean that a significant portion of supply is operated by experienced professionals who price methodically.
Los Angeles registered just +4.0%. At 14,989 listings, LA has the second-largest supply pool. But the more interesting dynamic may be playing out at the hyperlocal level: reports indicate that listings near SoFi Stadium in Inglewood have seen prices spike to $10,000+ per night for the June 12 US opener, even as the broader metro average barely budged. The citywide number masks neighborhood-level extremes.
The Listed Rate vs. Booked Rate Gap
There is an important distinction between what hosts ask and what guests pay. In cities like Arlington and Kansas City, listed rates have run far ahead of where actual booked rates sit. This gap suggests that many hosts may be pricing aspirationally, testing the ceiling. Some will find it. Others will face the reality that a $495 nightly rate in Arlington needs to compete with hotel rooms, alternative STR platforms, and guests' willingness to commute from lower-cost submarkets.
The East Coast Advantage
When you zoom out from individual cities and look at regional patterns, a clear geographic divide emerges in World Cup 2026 host cities rental demand. Call it a tale of two tournaments.
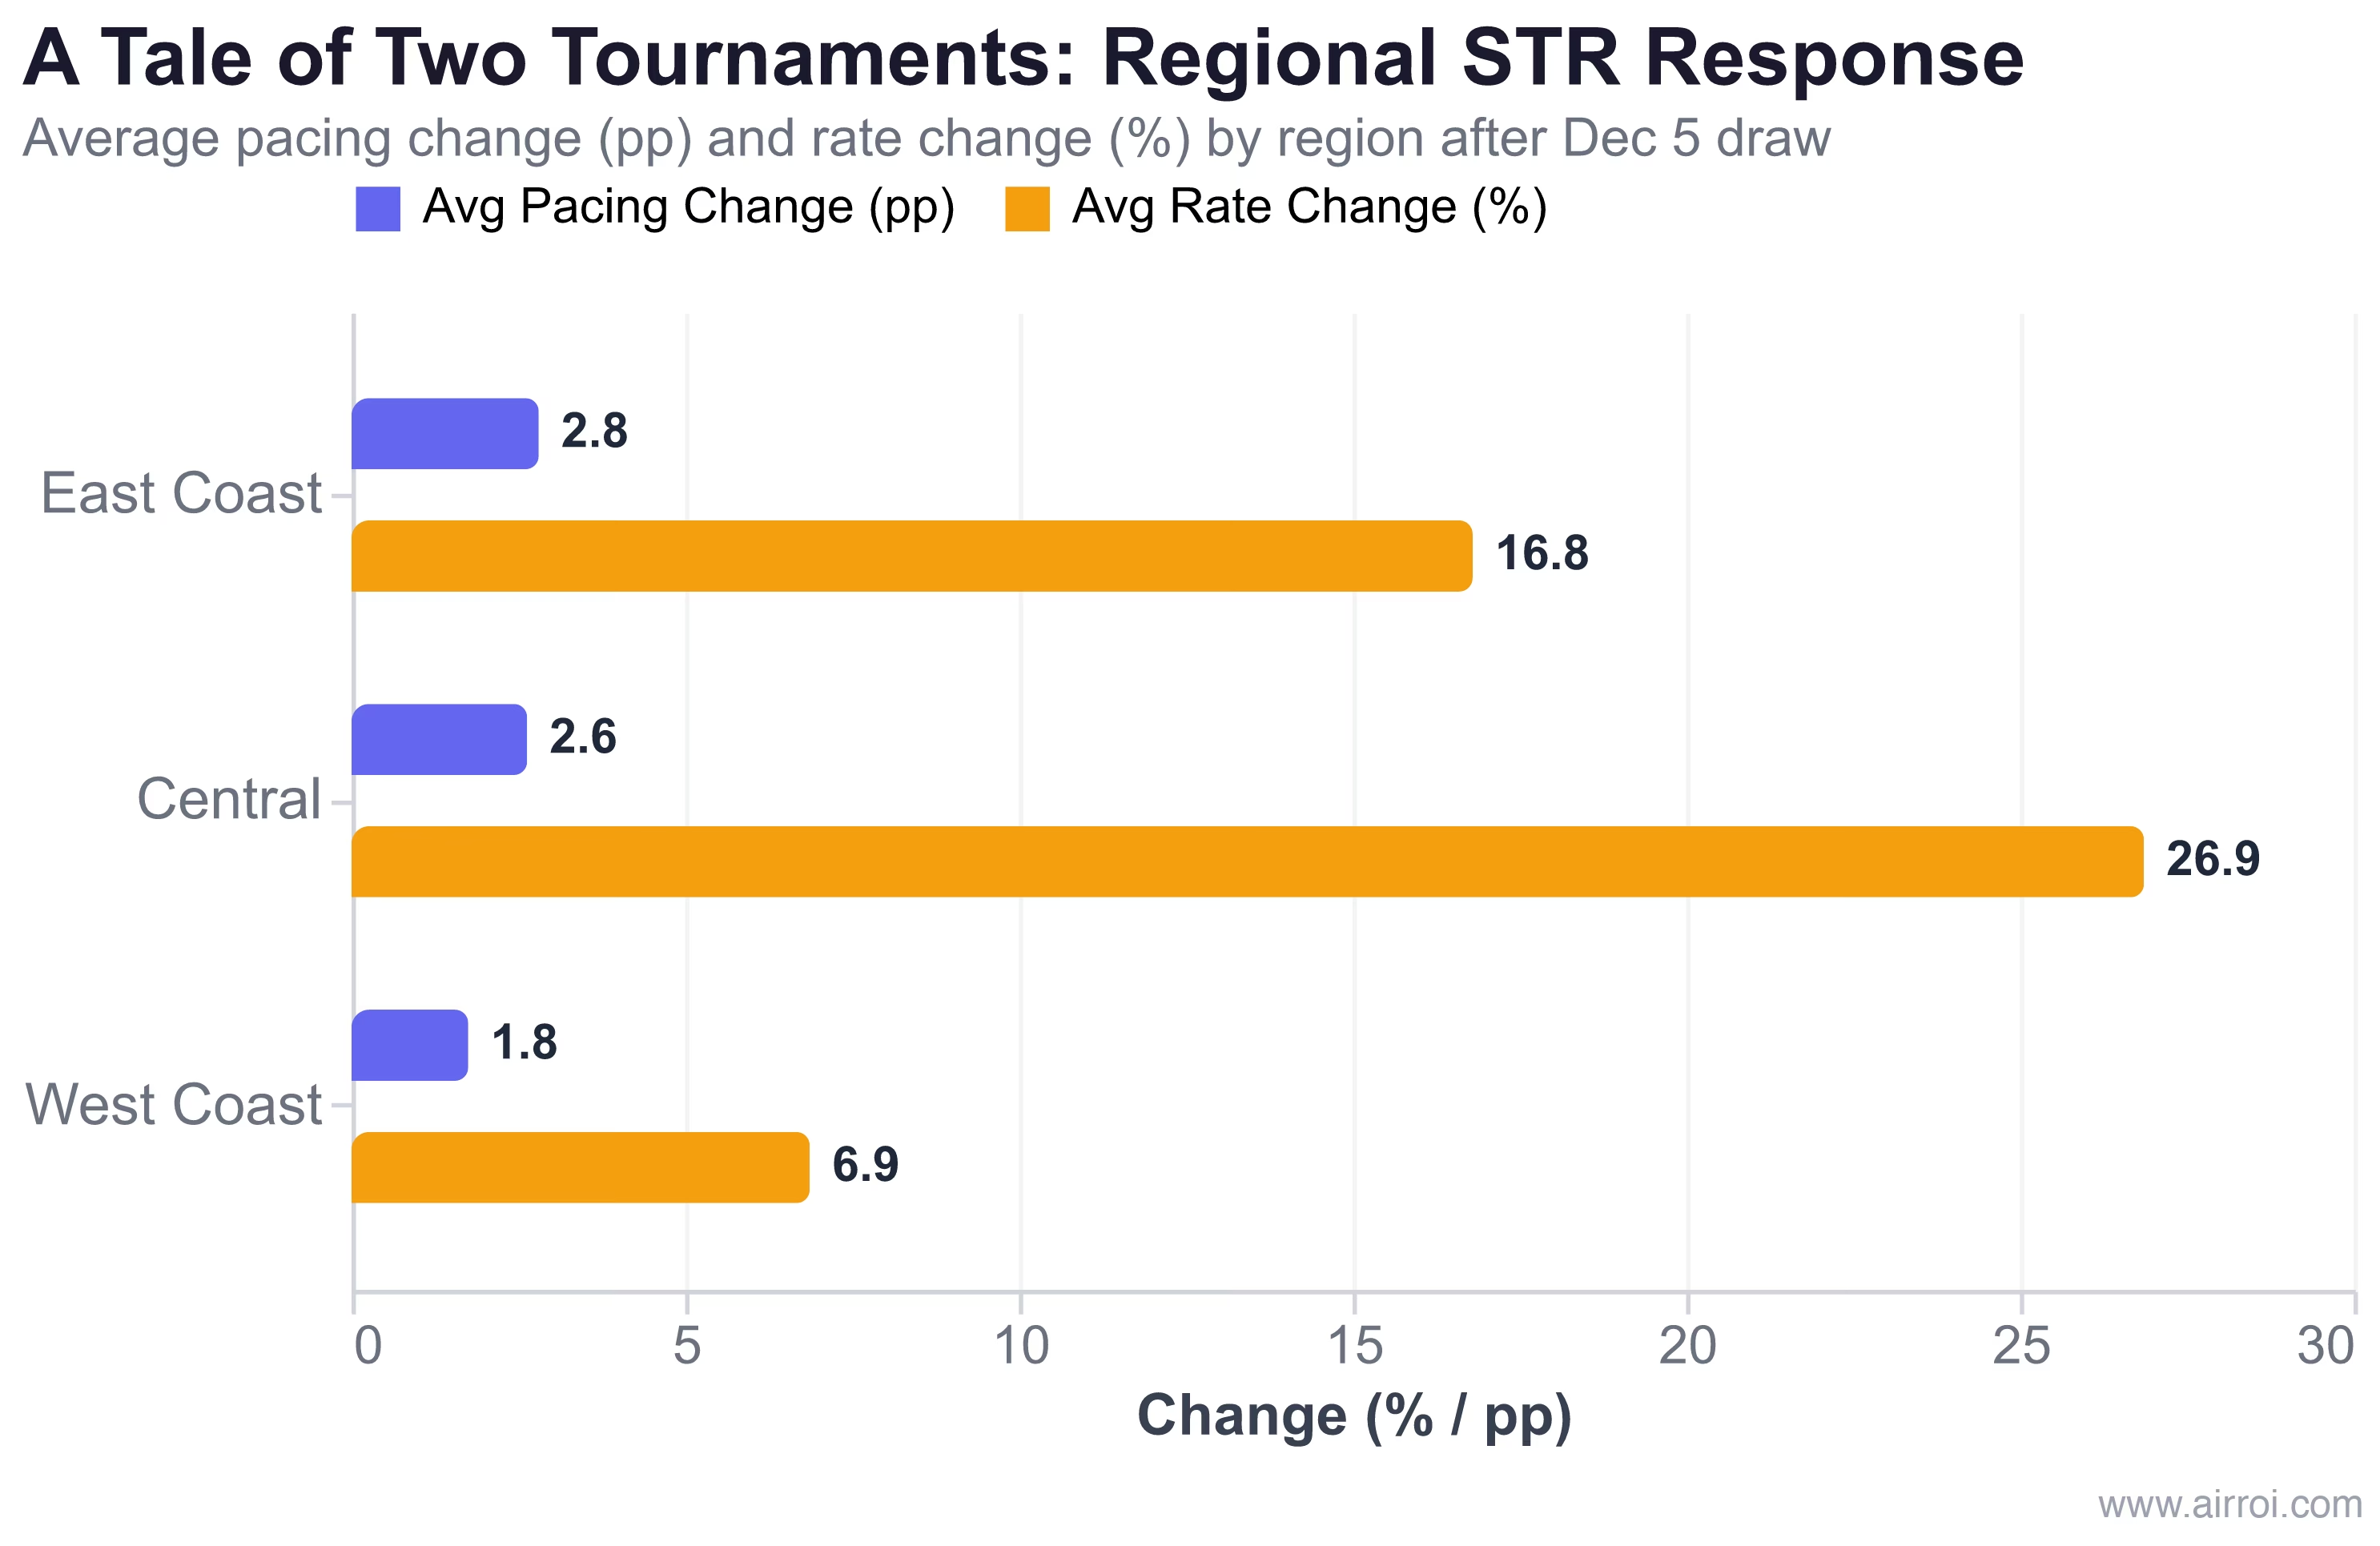
East Coast cities (Boston, New York, Jersey City, Newark, Philadelphia, and Miami) averaged a 2.81 percentage-point pacing increase and a 16.8% rate increase. Central cities (Atlanta, Kansas City, Dallas, Arlington, and Houston) averaged a 2.63 pp pacing increase but a dramatically higher 26.9% rate increase. West Coast cities (Los Angeles, San Francisco, and Seattle) trailed on both metrics, with a 1.75 pp pacing increase and a 6.9% rate increase.
Several factors explain this geographic divide:
Proximity to core fan bases matters. European and Latin American fans -- who will make up a huge share of international visitors -- face shorter flights and more convenient time zones when heading to East Coast and Central venues. A supporter flying from London, Buenos Aires, or Mexico City naturally gravitates toward the eastern half of the country.
Knockout-stage hosting concentrates in the East. The bracket structure means that marquee elimination matches disproportionately land in East Coast and Central stadiums, making those cities attractive for fans buying tickets later in the tournament when stakes -- and willingness to pay -- are highest.
The short-term rental World Cup impact is real everywhere, but it is reshaping Eastern and Central markets more aggressively than their Western counterparts.
Market Fundamentals -- The Starting Line Matters
To understand why some cities react more explosively than others, you need to look at the underlying market fundamentals. A city's baseline supply, pricing power, and occupancy rate set the stage for how much room there is to run.
| City | Active Listings | Avg ADR | Median ADR | Occupancy | Avg Annual Revenue | RevPAR |
|---|---|---|---|---|---|---|
| New York | 19,841 | $177.17 | $135.13 | 18.45% | $14,460 | $39.62 |
| Los Angeles | 14,989 | $272.01 | $166.93 | 21.03% | $22,852 | $62.61 |
| Houston | 11,659 | $174.12 | $136.07 | 22.54% | $15,114 | $41.41 |
| Miami | 10,207 | $263.72 | $206.25 | 30.55% | $30,396 | $83.28 |
| Atlanta | 7,684 | $191.68 | $152.30 | 21.86% | $16,869 | $46.22 |
| Seattle | 6,744 | $206.34 | $172.59 | 34.47% | $27,865 | $76.34 |
| San Francisco | 5,977 | $244.03 | $174.56 | 28.70% | $27,043 | $74.09 |
| Philadelphia | 5,893 | $152.15 | $119.60 | 24.93% | $15,673 | $42.94 |
| Dallas | 5,470 | $204.65 | $160.38 | 26.20% | $20,413 | $55.93 |
| Boston | 3,492 | $257.21 | $219.66 | 30.47% | $30,352 | $83.16 |
| Newark | 1,935 | $143.99 | $98.92 | 22.19% | $12,738 | $34.90 |
| Jersey City | 1,861 | $181.91 | $142.88 | 29.63% | $21,238 | $58.19 |
| Kansas City | 1,676 | $176.29 | $131.95 | 28.10% | $20,119 | $55.12 |
| Arlington | 953 | $194.35 | $172.91 | 24.31% | $19,391 | $53.13 |
A few patterns emerge from this FIFA 2026 STR market analysis:
Supply-constrained cities show the biggest pacing surges. Boston (3,492 listings), Kansas City (1,676), and Arlington (953) have the smallest supply pools and the highest pacing numbers. When demand is absorbed by fewer listings, each booking moves the needle more.
High-RevPAR cities can command steeper premiums. Miami ($83.28 RevPAR), Boston ($83.16), and Seattle ($76.34) already demonstrate that guests in those markets are willing to pay top dollar. World Cup pricing builds on that established willingness.
Large-supply cities absorb shocks more gracefully. New York (19,841 listings) and Los Angeles (14,989) barely blinked on pricing because their deep inventory pools prevent any single demand event from creating a supply crunch.
What This Means for Hosts and Investors
The data paints a clear picture. But what should you actually do with it? The answer depends on who you are.
For Current Hosts
Set minimum-night requirements strategically. During major sporting events, the highest-value bookings tend to be multi-night stays around specific match dates. Consider requiring 3- to 5-night minimums for peak match weekends, even if your normal policy is more flexible. This locks in premium bookings and reduces turnover costs.
For Investors
Supply-constrained markets with rising pacing are the prime targets. Kansas City (1,676 listings, 18.4% pacing), Boston (3,492 listings, 16.1% pacing), and Arlington (953 listings, 14.4% pacing) represent markets where demand is outrunning supply. Investors who can acquire or activate inventory in these markets before the final booking wave stand to capture premium returns.
But consider what happens after July 19. The World Cup is a once-in-a-generation event, not a recurring annual demand driver. Any investment thesis based solely on World Cup earnings needs to account for the property's fundamentals during the other 11 months of the year. Boston's trailing twelve-month average revenue of $30,352 and Miami's $30,396 suggest strong year-round performance. Kansas City ($20,119) and Arlington ($19,391) rely more heavily on event-driven demand.
The Overpricing Risk
Here is the uncomfortable truth that the listed rate data reveals: in several cities, hosts are pricing as if every guest is a deep-pocketed international soccer fan with an unlimited travel budget. Arlington's average listed rate of $494.52 is 2.5x its trailing twelve-month ADR of $194.35. Kansas City's $440.16 listed rate is 2.5x its TTM ADR of $176.29.
Some of these rates will stick. The highest-demand match dates -- think Argentina in Kansas City or the US opener in LA -- will absolutely command extreme premiums. Reports already show Inglewood listings near SoFi Stadium priced at over $10,000 for two nights around June 12, with 70% occupancy.
But not every date in the June 11 through July 19 window will carry the same demand intensity. Midweek matches between lower-profile teams, rest days between group stages, and the natural ebb of tournament momentum will create pockets of softer demand. Hosts who price aggressively across the entire window risk ending up with expensive vacancies during those lulls.
The smart play: price match-day windows at premium rates, but be willing to accept moderate rates for the gaps between. A blended strategy will likely outperform an all-or-nothing approach. Airbnb projects an expected 380,000+ guests across host cities, but they will not arrive all at once.
How AirROI Can Help You Prepare
Whether you are a host calibrating your pricing or an investor evaluating your next acquisition, the data we have shared in this analysis is just the starting point. The tournament is still five months away, and the booking curve is only beginning to accelerate. Airbnb itself projects a total economic impact of $3.6 billion across host cities, with hosts collectively earning an estimated $210 million.
The group draw was the spark. The real fire is still building. The question is whether you will be ready when it peaks.
Frequently Asked Questions
According to Deloitte's analysis commissioned by Airbnb, the average US host in a World Cup city stands to earn approximately $4,000 during the tournament, or about $262 per night. Top-earning cities include New York--New Jersey ($5,700/host), Boston ($5,200), and Los Angeles ($5,100).
Based on AirROI's December 2025 data, Kansas City leads all US host cities with 18.42% of World Cup period listing-days already booked -- the highest pacing of any market. Boston follows at 16.07%, with Arlington (AT&T Stadium area) at 14.41%. You can explore real-time demand data for any host city using AirROI Atlas.
AirROI's before/after analysis shows booking pacing for World Cup dates surged across all 11 US host cities between November and December 2025. Boston saw the largest jump (+60.2%), followed by Dallas (+57.6%) and Miami (+44.2%). Listed nightly rates also spiked, with Arlington up 46.5% and Dallas up 33.7%. The draw converted abstract tournament awareness into concrete, matchup-driven booking behavior.
Several cities face accommodation constraints. Vancouver's Deloitte analysis projects a 70,000-night shortfall during matches, with hotel prices potentially surging over 200%. In the US, cities with strict STR regulations -- like Los Angeles (120-day cap) and San Francisco -- may see inventory bottlenecks that push prices higher. This is partly why Airbnb projects the tournament will drive $3.6 billion in economic impact -- the accommodation shortage creates pricing power for hosts who can legally operate.
No. Even in the highest-pacing city (Kansas City at 18.4%), over 80% of World Cup period inventory remains unbooked as of December 2025. Most cities are below 12% pacing, meaning the vast majority of bookings are still to come. Historical patterns from previous World Cups and major sporting events suggest that the heaviest booking volume occurs in the final 60-90 days before the event. Use AirROI Atlas to analyze demand in your specific market and price accordingly.