Australia's STR Reckoning: What AHURI Data and AirROI Analysis Reveal About 174K Listings

In Hobart, short-term rental whole-property listings outnumber long-term rental vacancies 36 to 1. That single ratio, published in AHURI's May 2026 national analysis of Australia's airbnb regulations landscape, explains more about the country's emerging STR crackdown than any political speech or platform press release. The AHURI short term rental report Australia findings confirm what AirROI data has tracked across five major markets: Australia's 174,558 STR listings grew 10%+ in two years, 43% are operated by professional multi-property entities, and every state is now responding with a distinct regulatory model that reshapes revenue outcomes in measurable ways.
Days after AHURI published its findings, the City of Sydney voted to investigate banning short-term rentals in parts of the city. The timing was not coincidental. What follows is the first combined analysis of AHURI's national housing research and AirROI's real-time market data across Sydney, Melbourne, Gold Coast, Byron Bay, and Hobart -- five markets operating under five different regulatory frameworks.
What AHURI's First National STR Analysis Actually Found
AHURI's Final Report 451, authored by researchers from the University of Sydney, UNSW, and University College Dublin, delivers the most comprehensive national picture of Australia's short-term rental sector to date. The headline number -- 174,558 listings as of December 2024 -- represents a 10%+ increase from December 2022.
But the growth story matters less than the structural story. According to AHURI, 43% of Australia's STR listings are controlled by professional multi-property hosts. The remaining 57% belong to individual single-property hosts. Those professional operators -- 18,187 entities -- manage 98,384 listings, averaging 5.4 properties each.
The consolidation trend accelerates the disconnect between STR reality and the "home-sharing" narrative. Between 2019 and 2023, the number of STRA landlords fell 25% while listings declined only 11%. Fewer operators running more properties. The sector is professionalizing faster than regulation can track.
Whole-home, unhosted properties drove the majority of growth, with regional areas showing the strongest expansion. The geographic distribution is highly localized -- AHURI found some suburbs where up to 50% of housing stock serves the STR market, while neighboring suburbs show minimal presence.
AHURI's policy recommendations call for nationally consistent registration standards, resource allocation for local enforcement, regulation of professional property managers, and financial levies to fund infrastructure. The report advocates an "all-of-government response" coordinating federal housing policy with state and local enforcement -- a framework that, so far, does not exist.
Five Markets, Five Regulatory Models: AirROI Data Across Australia
AirROI tracks real-time performance data across Australia's major STR markets. The table below maps each market's revenue metrics against its regulatory environment, revealing how different policy approaches produce different financial outcomes.
| Market | Active Listings | ADR (USD) | Occupancy | RevPAR (USD) | Annual Revenue (USD) | Key Regulation |
|---|---|---|---|---|---|---|
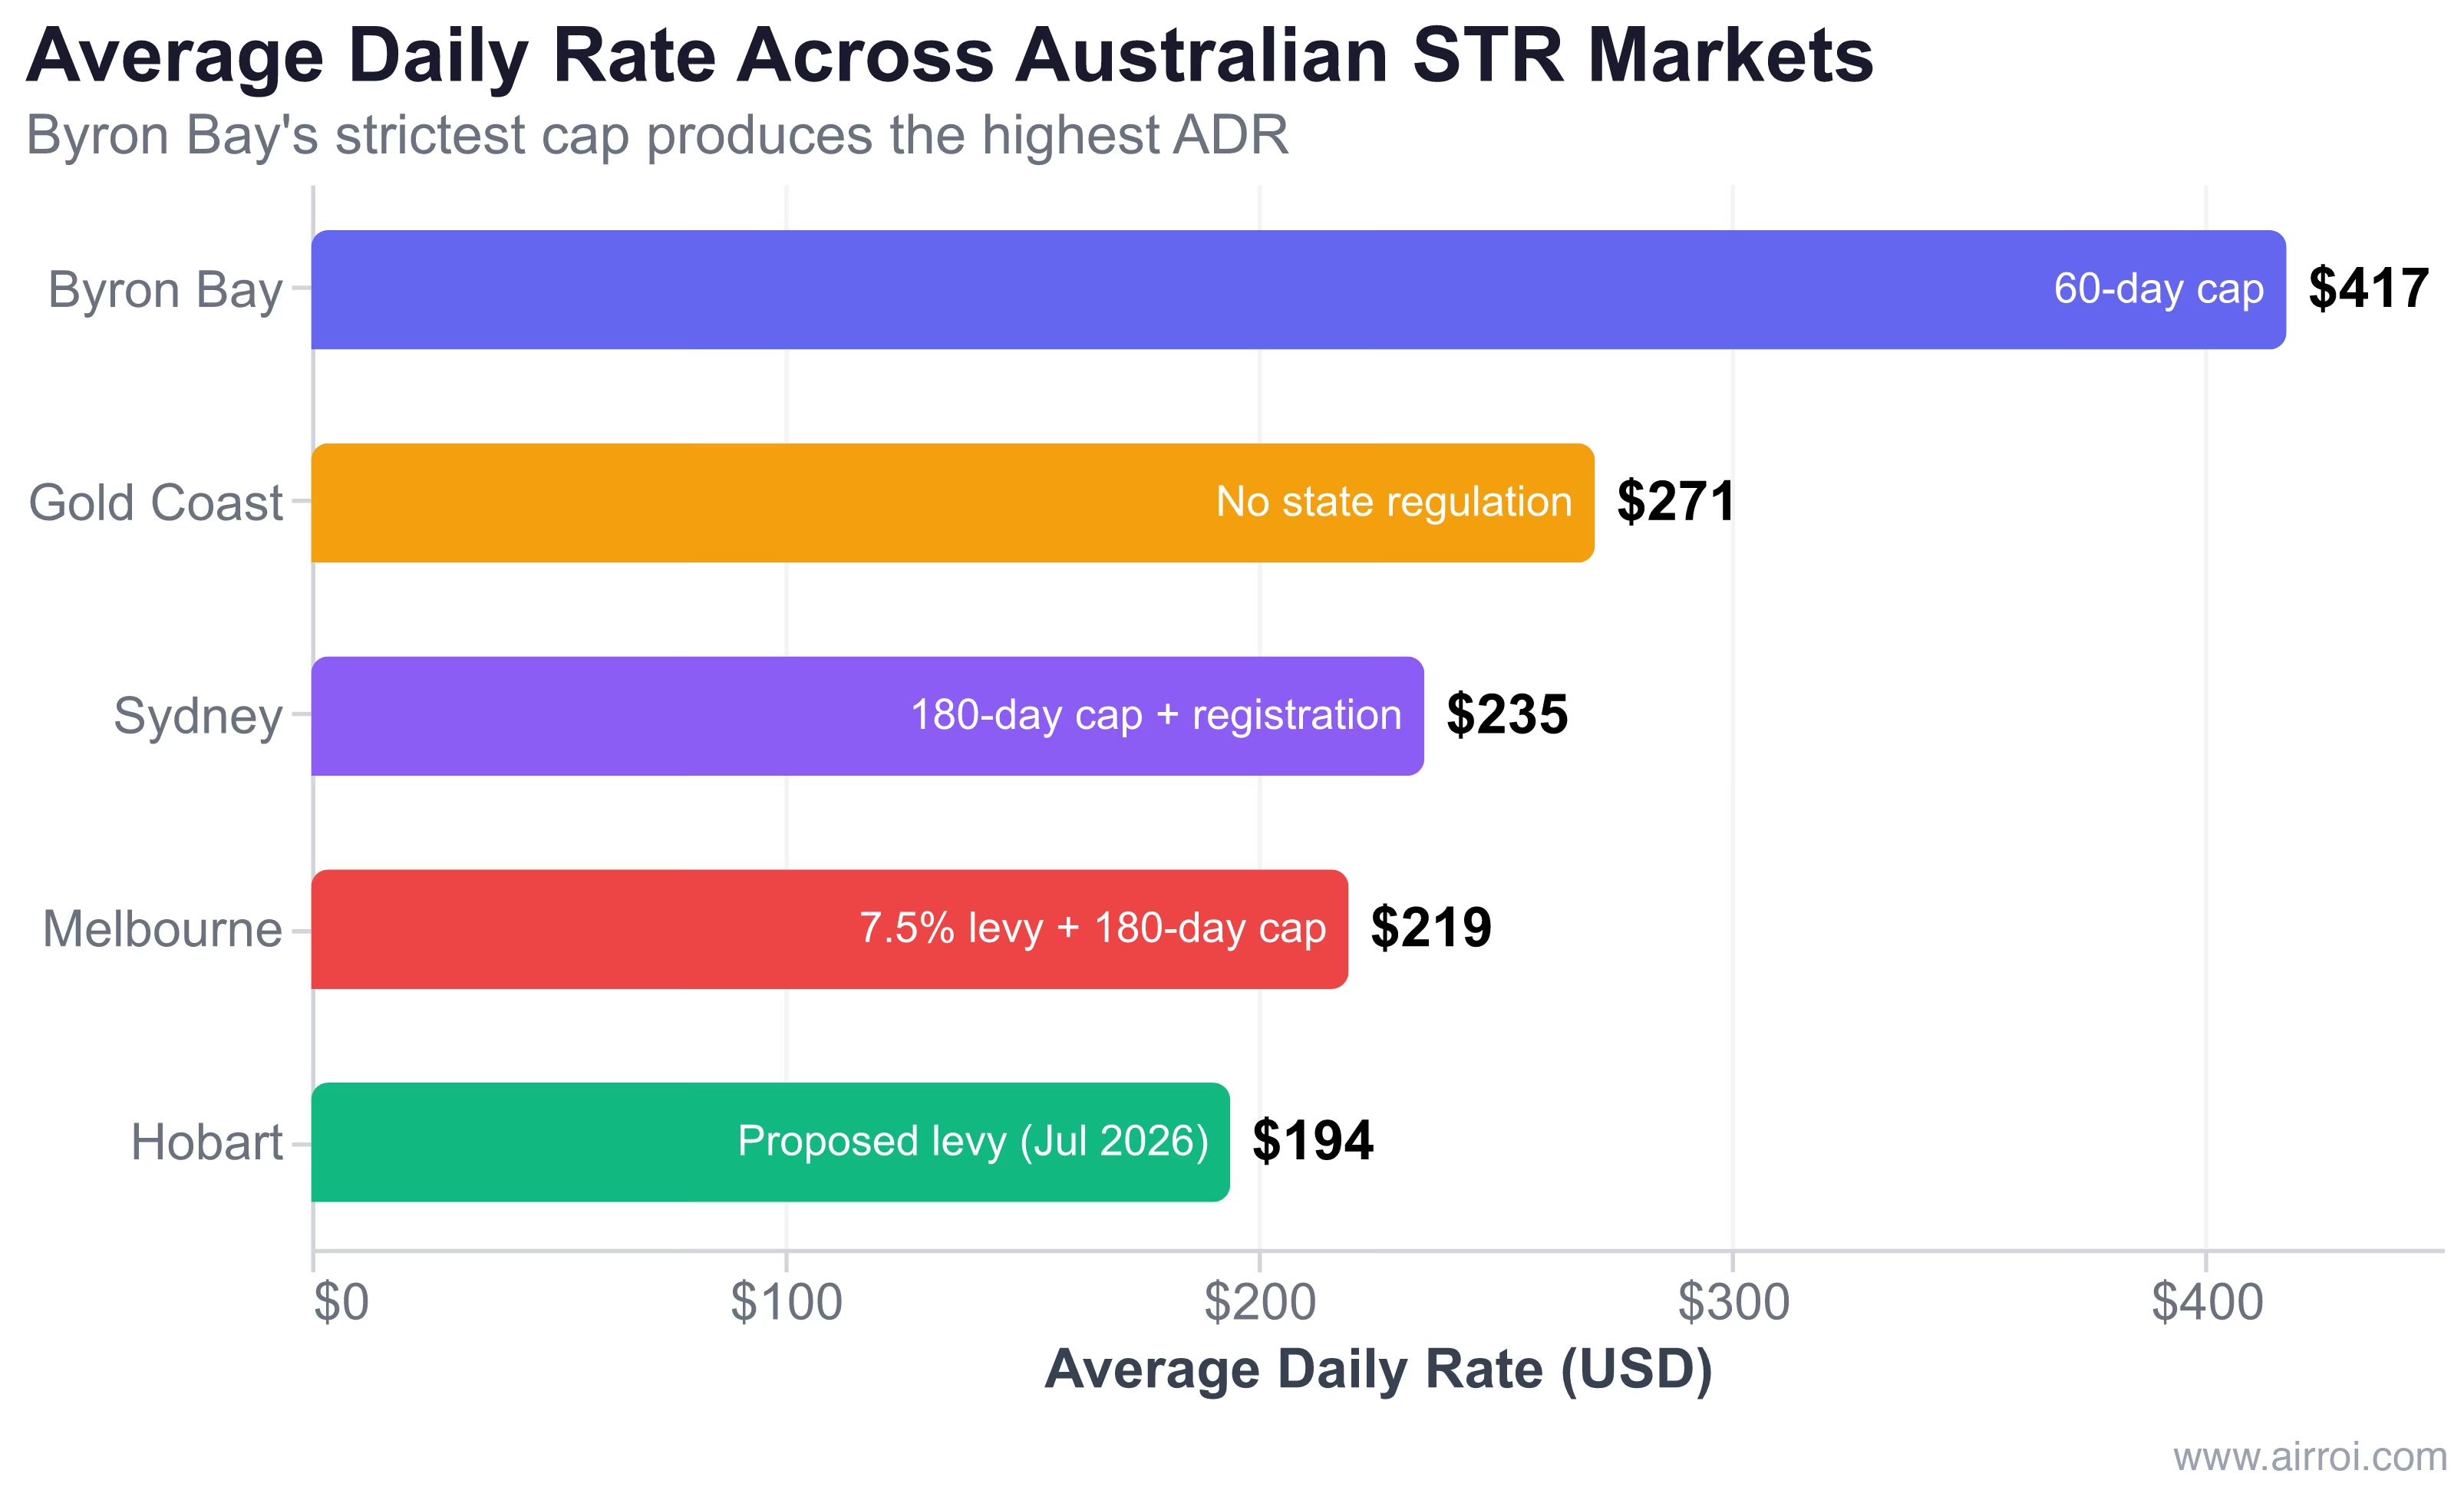
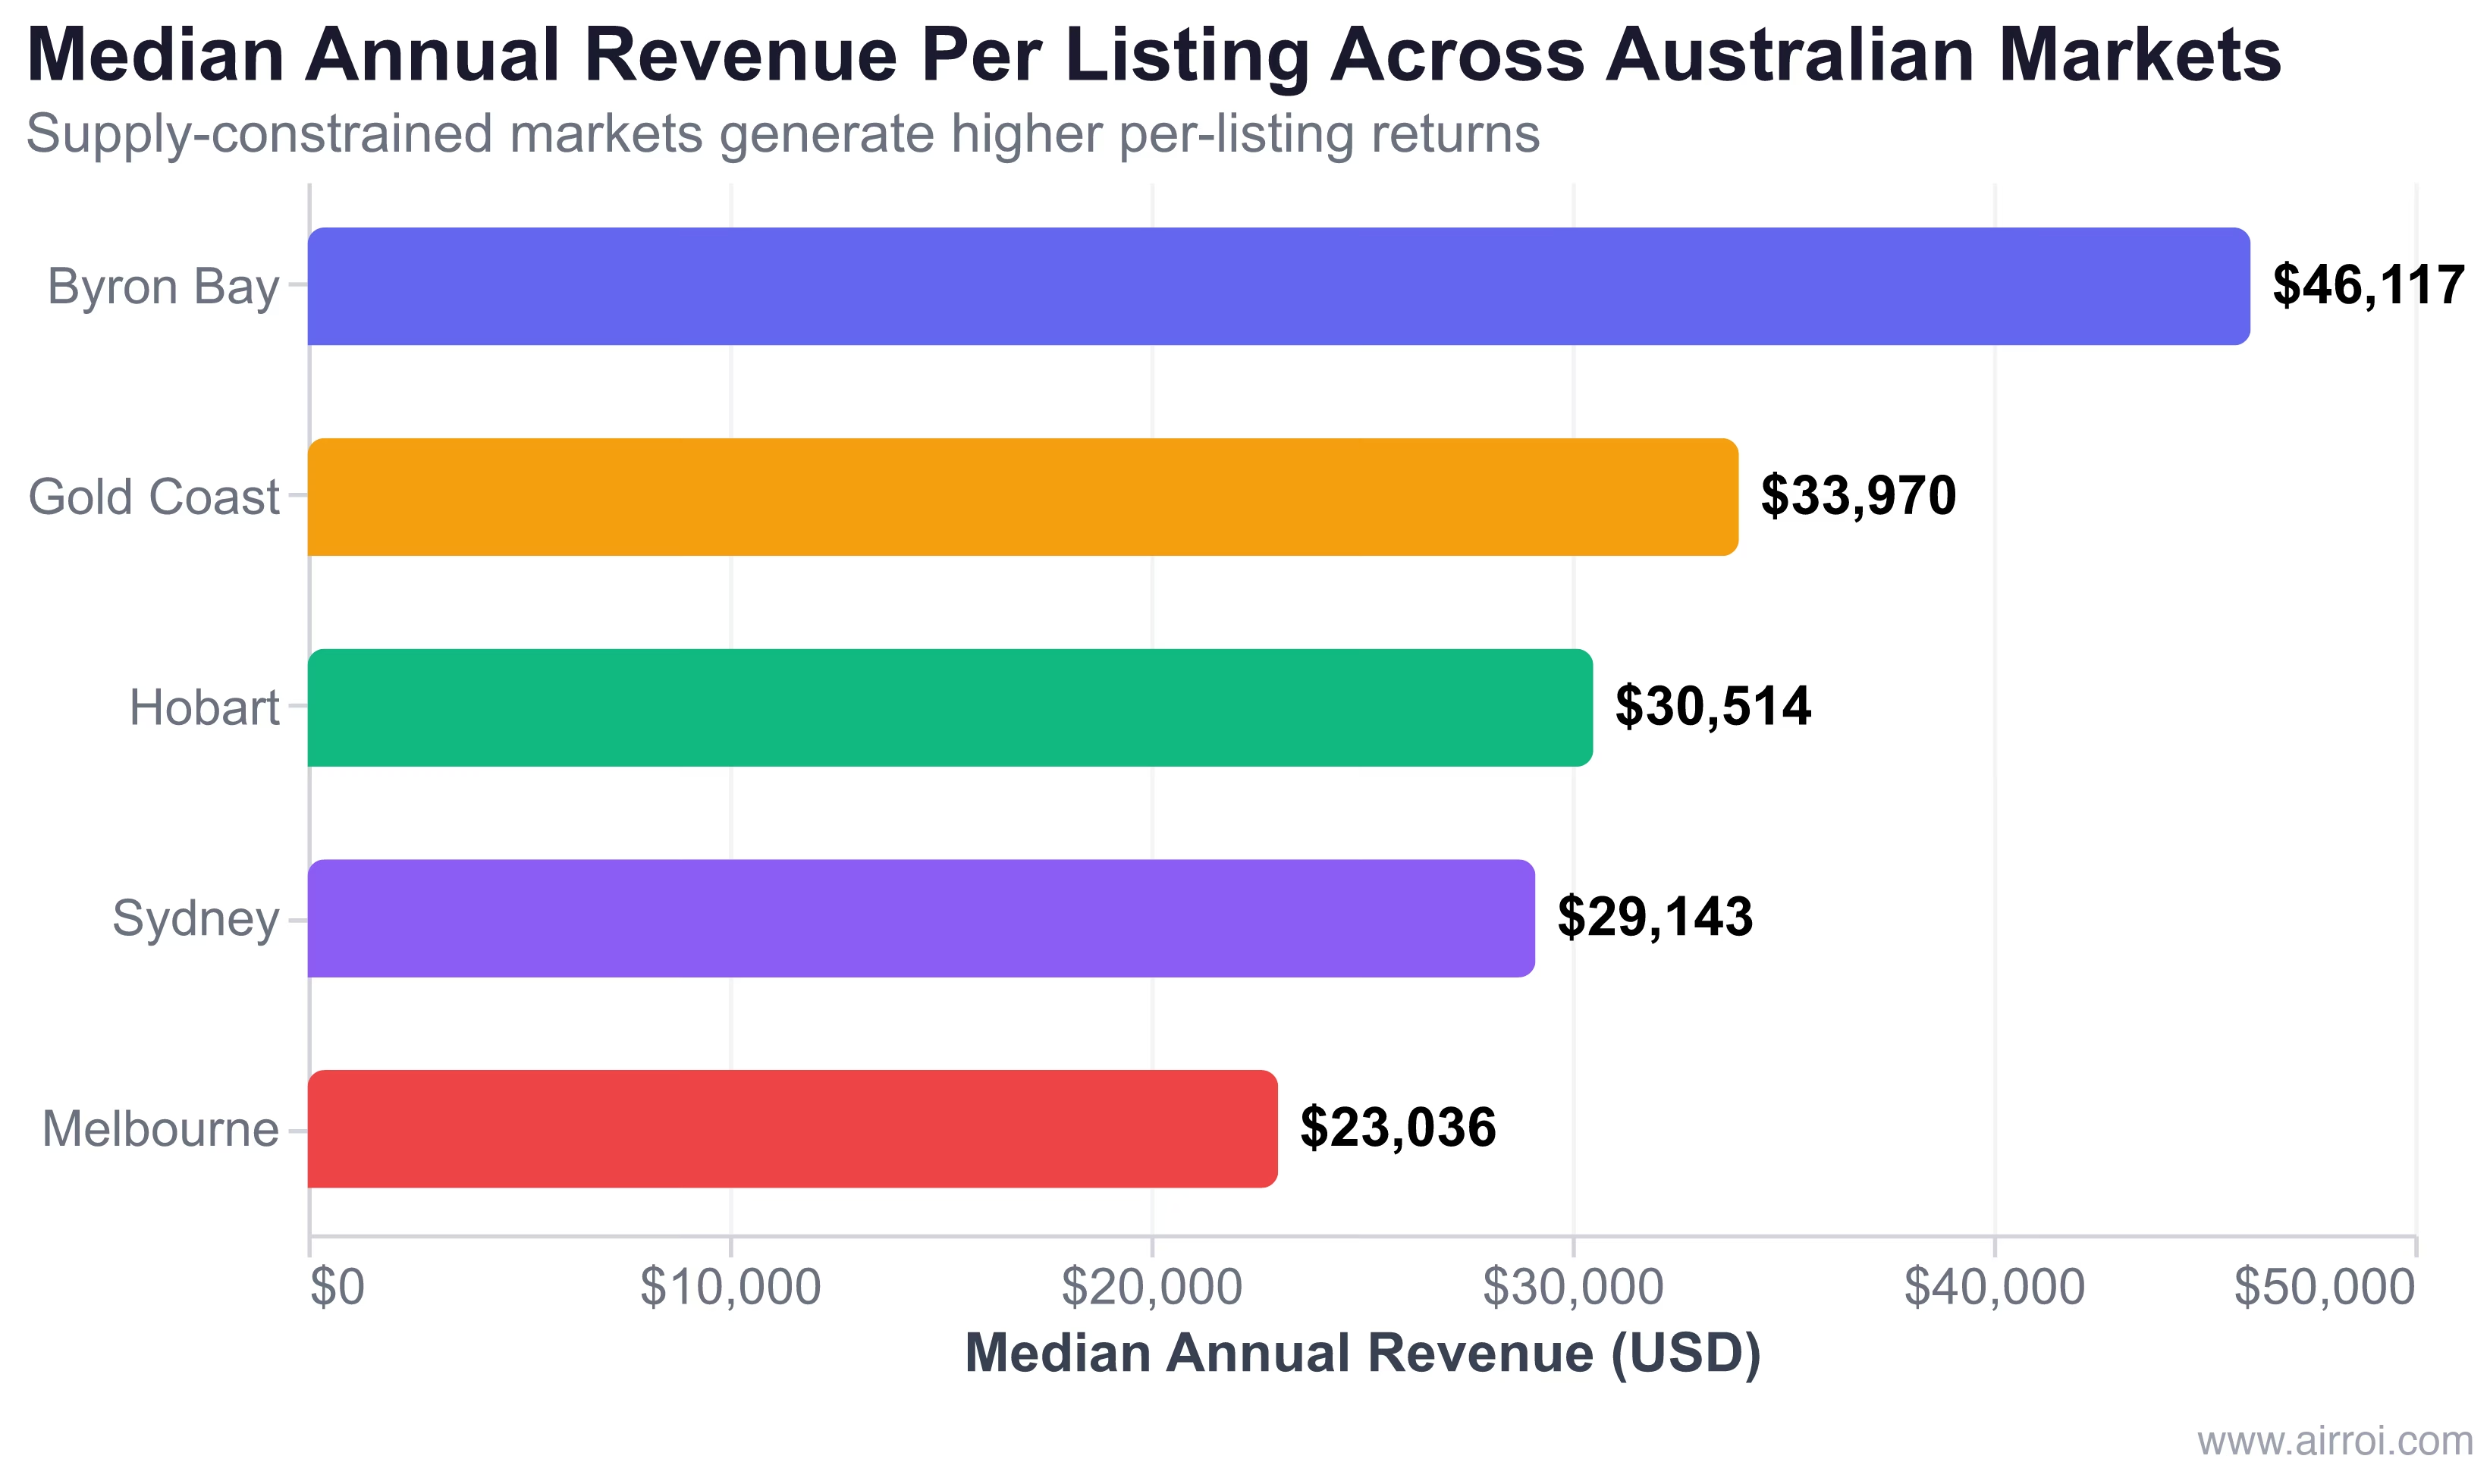
| Byron Bay | 1,178 | $417 | 44% | $179 | $46,117 | 60-day cap + registration |
| Gold Coast | 6,618 | $271 | 50% | $135 | $33,970 | No state regulation |
| Hobart | 1,894 | $194 | 56% | $107 | $30,514 | Proposed levy (Jul 2026) |
| Sydney | 15,472 | $235 | 52% | $118 | $29,143 | 180-day cap + registration |
| Melbourne | 21,192 | $219 | 46% | $95 | $23,036 | 7.5% levy + 180-day cap |
Source: AirROI market data, May 2026. Revenue figures represent trailing twelve-month medians in USD.
Byron Bay, operating under Australia's strictest 60-day cap, produces the highest ADR ($417) and highest annual revenue ($46,117) of any market analyzed. Melbourne, with the most listings (21,192) and a levy-based enforcement approach, delivers the lowest RevPAR ($95) and lowest annual revenue ($23,036).
The supply trends tell a parallel story. AirROI data shows Sydney's active listing count peaked at 15,668 in January 2025 before declining to 11,252 by April 2026 -- a 28% drop that correlates with enforcement of NSW's mandatory registration. Melbourne peaked at 21,710 in February 2025 and has since declined to 16,145, coinciding with the rollout of Victoria's 7.5% levy. Gold Coast peaked at 6,999 in May 2025 and has contracted to 4,886 -- even without state-level regulation, natural market forces compressed supply as revenue per listing tightened.
Sydney's Proposed Suburban Bans: The Barcelona Playbook Down Under
On April 29, 2026, City of Sydney councillors passed a Greens-led motion to investigate restricting or banning short-term rentals in specific suburbs. The investigation targets areas where STR density is high and rental vacancy rates are low: Surry Hills, Pyrmont, Darlinghurst, Kings Cross, Potts Point, Ultimo, Chippendale, Haymarket, Woolloomooloo, and Millers Point.
"In the middle of a housing crisis, when rents have never been higher, every house should be a home." -- Greens Councillor Matthew Thompson, City of Sydney
The housing context is acute. Sydney's rental vacancy rate sits at 1.1%, and average weekly rent hit $1,193 -- a 7% year-on-year increase. The proposed restrictions would only apply to properties that are not the owner's primary residence.
The approach echoes Barcelona's locational model, where the city froze new STR licenses and is phasing out all 10,101 existing licenses by November 2028. Amsterdam similarly restricts STRs to 30 nights per year and requires properties to be the host's primary residence.
| Dimension | Sydney (Proposed) | Barcelona | Amsterdam | NYC |
|---|---|---|---|---|
| Primary tool | Suburban bans + day cap | License phaseout | Night cap (30 days) | Registration + enforcement |
| Strictest limit | Outright ban (select suburbs) | Zero new licenses | 30 nights/year | Effectively banned (unhosted) |
| Current supply | 15,472 listings | ~10,000 licenses | ~8,371 listings | Severely compressed |
| Housing trigger | 1.1% vacancy rate | Tourist saturation | Housing affordability crisis | Rental affordability crisis |
Stayz's government affairs director urged the council to "refrain from implementing bans, day or night caps, limits on guest numbers, or day fees," arguing that existing state-level regulation provides adequate oversight. Current NSW law already caps unhosted stays at 180 days in Greater Sydney and mandates STRA registration with fire safety compliance.
The critical question is whether suburban-level bans would succeed where Byron Shire's 60-day cap has not.
Byron Bay's 60-Day Experiment: Higher Rents, Fewer Rentals, No Fix
Byron Bay provides the most complete case study of aggressive day-cap regulation in Australia. The Independent Planning Commission recommended slashing the limit from 180 days to 60 days for unhosted stays, effective September 26, 2024.
One year later, the results are in. According to independent analysis by Frontier Economics, the 60-day cap produced none of the promised housing benefits:
- No increase in long-term rental listings
- No improvement in housing affordability
- Weekly rents rose 7% to $1,193 per week
- 95% of surveyed hosts said they would not move their properties to the long-term rental market
The cap failed at its stated housing objective. But it succeeded at something else: concentrating revenue among the properties that remain in the STR market. Byron Bay's $417 ADR is the highest of any major Australian market -- 78% above Sydney's $235 and 115% above Hobart's $194. With only 1,178 active listings in a market that draws international tourism demand, supply compression drives extraordinary rate power.
The paradox is structural. Capping days doesn't return properties to the long-term market because STR operators have financial incentives to maximize revenue within the cap. A Byron Bay host earning $417 per night for 60 nights generates $25,020 in gross STR revenue -- which competes with or exceeds long-term rental returns in the area even at 60 nights.
For investors watching the City of Sydney's suburban ban investigation, Byron Bay offers a clear lesson: supply-side restrictions elevate rates for remaining operators but do not solve the housing supply equation.
The 43% Problem: Professional Operators vs the Home-Sharing Narrative
AHURI's finding that 43% of Australian STR listings are controlled by professional multi-property entities challenges the foundational narrative that platforms and regulators both use: that short-term rental is "home-sharing."
The numbers tell a different story. Those 18,187 professional entities manage 98,384 listings -- an average of 5.4 properties each. Meanwhile, the number of STRA landlords fell 25% between 2019 and 2023 even as listings declined only 11%. The market is consolidating toward commercial-scale operators.
This professionalization has regulatory consequences. Victoria's 7.5% short stay levy, projected to generate $75 million annually according to the Victorian Parliamentary Budget Office, was explicitly designed as a revenue mechanism that captures value from commercial STR activity. Victoria also allows owners corporations to vote to ban short-term rentals with a 75% majority -- a tool that empowers residential communities to resist commercial STR operations in their buildings.
NSW's mandatory registration achieves a different form of professionalization pressure. With 94% of active Sydney listings showing registration compliance according to AirROI data, the registration requirement has become less about identifying non-compliant operators and more about establishing a baseline for further regulation -- including the suburban bans now under investigation.
36 to 1: Hobart's Housing Arithmetic
Hobart presents the most extreme version of Australia's STR-housing tension. AHURI's finding that STR whole-property listings outnumber long-term rental vacancies 36 to 1 represents a concentration ratio that no other Australian capital approaches.
Research indicates that nearly 50% of Hobart's short-stay accommodation properties were previously part of the long-term rental market. The city's STR supply grew from 1,993 properties in 2018 to 2,379 -- approximately 400 homes removed from the rental market over a period when Hobart was rated the least affordable metropolitan area in Australia for renters relative to income.
Despite this housing pressure -- or perhaps because of it -- Hobart maintains the highest occupancy rate (56%) of the five markets analyzed. The $194 ADR is the lowest among the five, but the combination of high occupancy and consistent demand produces $30,514 in median annual revenue, outperforming Sydney ($29,143) on a per-listing basis.
Tasmania is responding. A proposed STR levy is set to commence July 1, 2026, joining Victoria and the ACT as the third Australian state or territory to impose a financial cost on short-stay accommodation. The levy will fund affordable housing initiatives -- a direct response to the 36-to-1 ratio that AHURI documented.
What This Means for International STR Investors
Australia's regulatory trajectory mirrors the pattern we have tracked across every major STR market globally: fragmented local responses that gradually centralize toward registration, day caps, and financial levies.
The compliance moat pattern holds across continents. Strict enforcement compresses supply, drives ADR higher for compliant operators, and creates barriers that deter unregistered competition. Amsterdam's $313 ADR under Europe's strictest enforcement, Byron Bay's $417 ADR under Australia's strictest cap, Singapore's $215 ADR under its near-total ban -- the mechanism repeats.
The investment framework for evaluating any STR market now requires three assessments:
- Regulatory trajectory -- is the market moving toward registration, caps, or levies? Australia's state-by-state rollout provides a roadmap: NSW registered first, Victoria levied second, Tasmania follows third.
- Professionalization stage -- what share of listings are held by multi-property operators? Markets above 40% professional share (like Australia's 43%) attract regulatory attention because they challenge the home-sharing narrative.
- Housing pressure ratio -- what is the relationship between STR supply and long-term rental vacancy? Hobart's 36-to-1 ratio triggered legislative action. Markets approaching similar ratios face similar regulatory risk.
Australia's regulatory patchwork -- five states with five approaches, from Queensland's hands-off stance to Byron Shire's 60-day cap -- provides a natural experiment that every international STR investor should study. The data does not support avoiding regulated markets. It supports selecting markets where compliance creates competitive advantage.
Frequently Asked Questions
AHURI's May 2026 report found 174,558 short-term rental listings across Australia, a 10%+ increase from December 2022 to December 2024. AirROI data shows the five largest markets alone account for over 46,000 active listings: Melbourne (21,192), Sydney (15,472), Gold Coast (6,618), Hobart (1,894), and Byron Bay (1,178).
Not yet, but the City of Sydney passed a Greens-led motion on April 29, 2026 to investigate banning STRs in specific suburbs with low rental vacancy rates. Potential restrictions include outright bans in suburbs like Surry Hills, Pyrmont, and Darlinghurst. Current NSW law caps unhosted stays at 180 days in Greater Sydney.
AHURI's Final Report 451 found 174,558 STR listings nationally, 10%+ growth in two years, and that 43% of listings are controlled by professional multi-property hosts. The number of STRA landlords fell 25% while listings declined only 11%, indicating consolidation toward larger operators. In Hobart, STR whole-property listings outnumber long-term rental vacancies 36 to 1.
By most housing measures, no. Frontier Economics found that one year after the September 2024 implementation, there was no increase in long-term rental listings and no improvement in affordability. Weekly rents rose 7% to $1,193. However, the cap did compress supply and drive Byron Bay's ADR to $417 -- the highest of any major Australian market.
Australia's state-by-state regulatory patchwork mirrors Europe's pre-2024 fragmentation. Both regions use registration requirements, day caps, and financial levies. The key difference is enforcement infrastructure -- Europe is centralizing through EU Regulation 2024/1028's mandatory platform data-sharing, while Australia's enforcement remains decentralized across six states and two territories.