
How to Analyze an Airbnb Market: Thresholds From 1,026 Markets

Two numbers describe Ocean City, Maryland's entire-home Airbnb market in the twelve months to May 2026: 17.6% occupancy and 39.1% occupancy. Both are arithmetically correct. They come from the same listings, the same bookings and the same calendar. The only difference is whether listing-months that booked nothing are counted in the denominator, and 49.2% of Ocean City's active listing-months booked nothing at all — so the choice of rule moves the market's occupancy rate by 21.5 percentage points.
That is where market analysis has to begin, because a threshold you read somewhere is worthless until you know which rule produced it. What follows is the method: five measurable dimensions — demand depth, seasonality shape, supply saturation, regulatory posture and revenue dispersion — each with one metric, and each metric placed against the distribution of 1,026 US markets and 862,035 entire-home listings for the year to June 30, 2026. That turns "is this a good market" into a percentile question instead of an opinion.
Five markets carry the worked examples, each the extreme case on exactly one dimension: Lisbon, Ocean City, Greenville (SC), Estes Park (CO) and Philadelphia.
The denominator decides the answer, so fix it first
Airbnb market occupancy can be computed three defensible ways, and the gap between them is wider than the gap between most markets. Across five markets in the twelve months to May 2026, AirROI measured mean monthly occupancy under each rule: over every listing-month in the snapshot; over only the months a listing was active; and over months a listing was active and booked at least one night. The third rule reads 15.9 to 21.5 percentage points higher than the first — Ocean City runs 17.6% under rule A and 39.1% under rule C. Neither is wrong, and comparing one market's rule-A occupancy with another's rule-C occupancy teaches nothing.
| Market | A: every listing-month | B: active months only | C: active and booked ≥1 night | C ÷ A | Active months with zero bookings |
|---|---|---|---|---|---|
| Lisbon, PT | 41.3% | 45.6% | 59.4% | 1.44× | 23.3% |
| Estes Park, CO | 33.3% | 36.3% | 49.2% | 1.48× | 26.3% |
| Greenville, SC | 30.5% | 36.3% | 51.8% | 1.70× | 29.9% |
| Philadelphia, PA | 27.4% | 33.0% | 48.3% | 1.76× | 31.8% |
| Ocean City, MD | 17.6% | 19.9% | 39.1% | 2.22× | 49.2% |
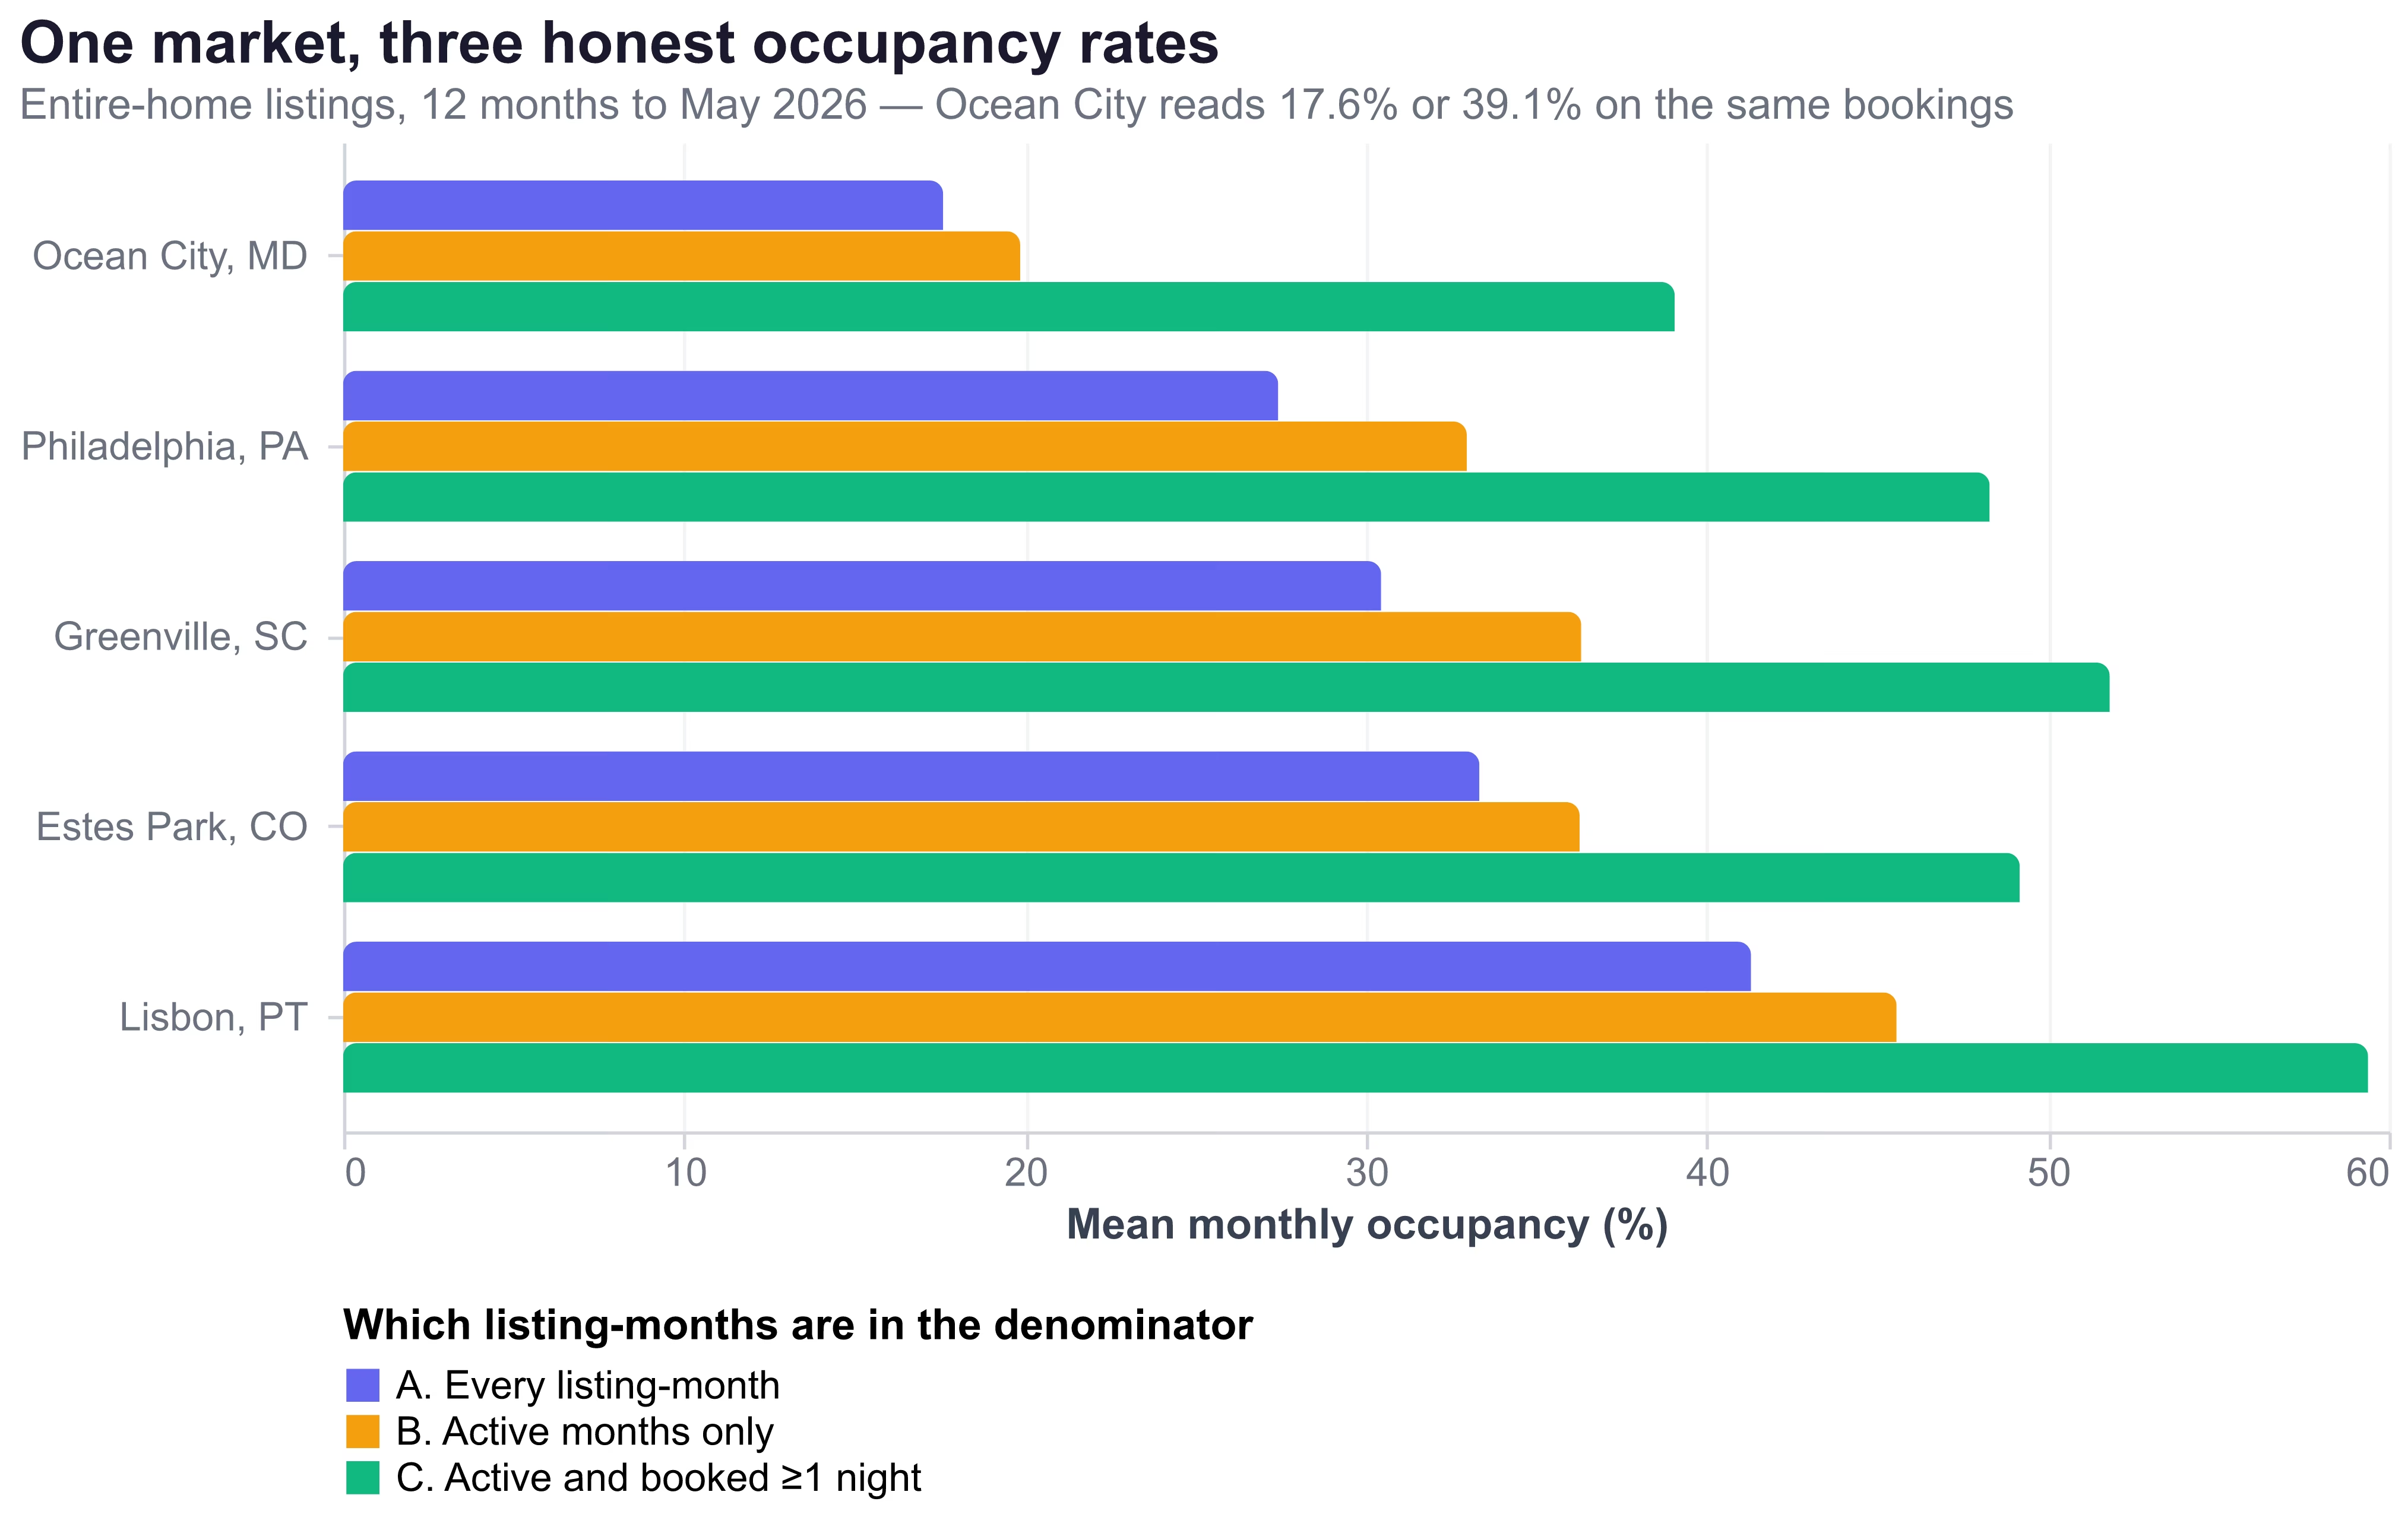
Rule C is the convention most published "average Airbnb occupancy" figures follow, including AirROI's own public market series. We confirmed that by rebuilding the Lisbon July 2025 figure from listing-level rows: the active-listing count reproduces the published number exactly (15,238) and the rule-C median reproduces the published median (0.6985 against 0.69). The published mean sits below our reconstruction (0.61 against 0.6283), so a further minor filter exists that we could not identify — which is why we quote medians, not means.
This is the mechanism behind most public arguments about whether a market is healthy. In April 2024 the STR investor Taylor Jones posted a correction to another commentator's Cape Coral figures that drew 24,141 views:
"-There is 5,200 listings in Cape Coral (NOT 17,000)
-Market occupancy is 55% (NOT 42%)"
— Taylor Jones (@MrJonesSTRs), April 28, 2024
We have verified neither the 5,200 nor the 55%, and neither should be repeated as fact. The disagreement is the useful part: 55% against 42% is a 1.31× gap, which sits inside the 1.30× to 1.97× range separating rule B from rule C in the five markets above — and neither side names a rule.
Where a normal US market actually sits
Every threshold below is a percentile drawn from the same panel: each US city with at least 200 qualifying entire-home listings, 1,026 markets and 862,035 listings, for the trailing twelve months ended June 30, 2026. We compute each market's median listing first, then report how those 1,026 market medians are distributed. A market in the top decile on revenue is not "good" because a rule of thumb says so; it is above nine in ten of 1,026 measured peers.
| Dimension | Metric | US p25 | US median | US p90 |
|---|---|---|---|---|
| Earnings level | Median listing's trailing-year revenue | $17,922 | $23,863 | $42,596 |
| Occupancy | Median listing's booked ÷ bookable nights | 20.7% | 25.9% | 37.3% |
| Volume | Median listing's booked nights | 66 | 83 | — |
| Demand depth | Midweek ÷ weekend occupancy | 0.576 | 0.676 | 0.840 |
| Seasonality | Share of annual RevPAR in the 3 best months | 32.9% | 37.3% | 54.2% |
| Seasonality | Peak month ÷ trough month RevPAR | 2.28× | 3.25× | 11.01× |
| Supply | 11-month change in entire-home supply | +0.03% | +5.7% | +18.7% |
| Dispersion | p90 ÷ p50 listing revenue inside the market | 2.77× | 3.13× | 4.35× |
The booked-nights p90 was not computed (p75 is 103 nights). The supply row covers 1,034 markets rather than 1,026 because it is anchored on the July 2025 snapshot, and every percentile comes from an approximate quantile function, so read them as "about".
Demand depth: how much of the week actually books
Demand depth asks whether a market has buyers on a Tuesday or only on a Saturday, and the cleanest single measure is midweek occupancy divided by weekend occupancy (Mon–Wed against Fri–Sat). Across 1,026 US markets over the 335 days to May 31, 2026, the median market's midweek-to-weekend ratio is 0.676, and the top decile runs above 0.840; on the same panel, median midweek occupancy is 24.3% and median weekend occupancy 36.6%. All three medians are taken separately across the 1,026 markets, so the two occupancies are not the pair that produces the ratio — they belong to different markets. At 0.60 a market's Monday-to-Wednesday nights fill at about three-fifths of the weekend rate; at 0.88 the week is close to uniform. That difference carries straight into pricing power, minimum-stay policy and what a single soft weekend costs.
| Market | Midweek occupancy | Weekend occupancy | Midweek ÷ weekend | Saturday vs Monday booked rate |
|---|---|---|---|---|
| Lisbon, PT | 41.5% | 47.1% | 0.880 | +5.3% |
| Estes Park, CO | 27.3% | 39.5% | 0.691 | +0.8% |
| Greenville, SC | 26.8% | 43.2% | 0.621 | +17.2% |
| Philadelphia, PA | 22.7% | 36.9% | 0.616 | +31.4% |
| Ocean City, MD | 12.9% | 21.5% | 0.602 | −0.8% |
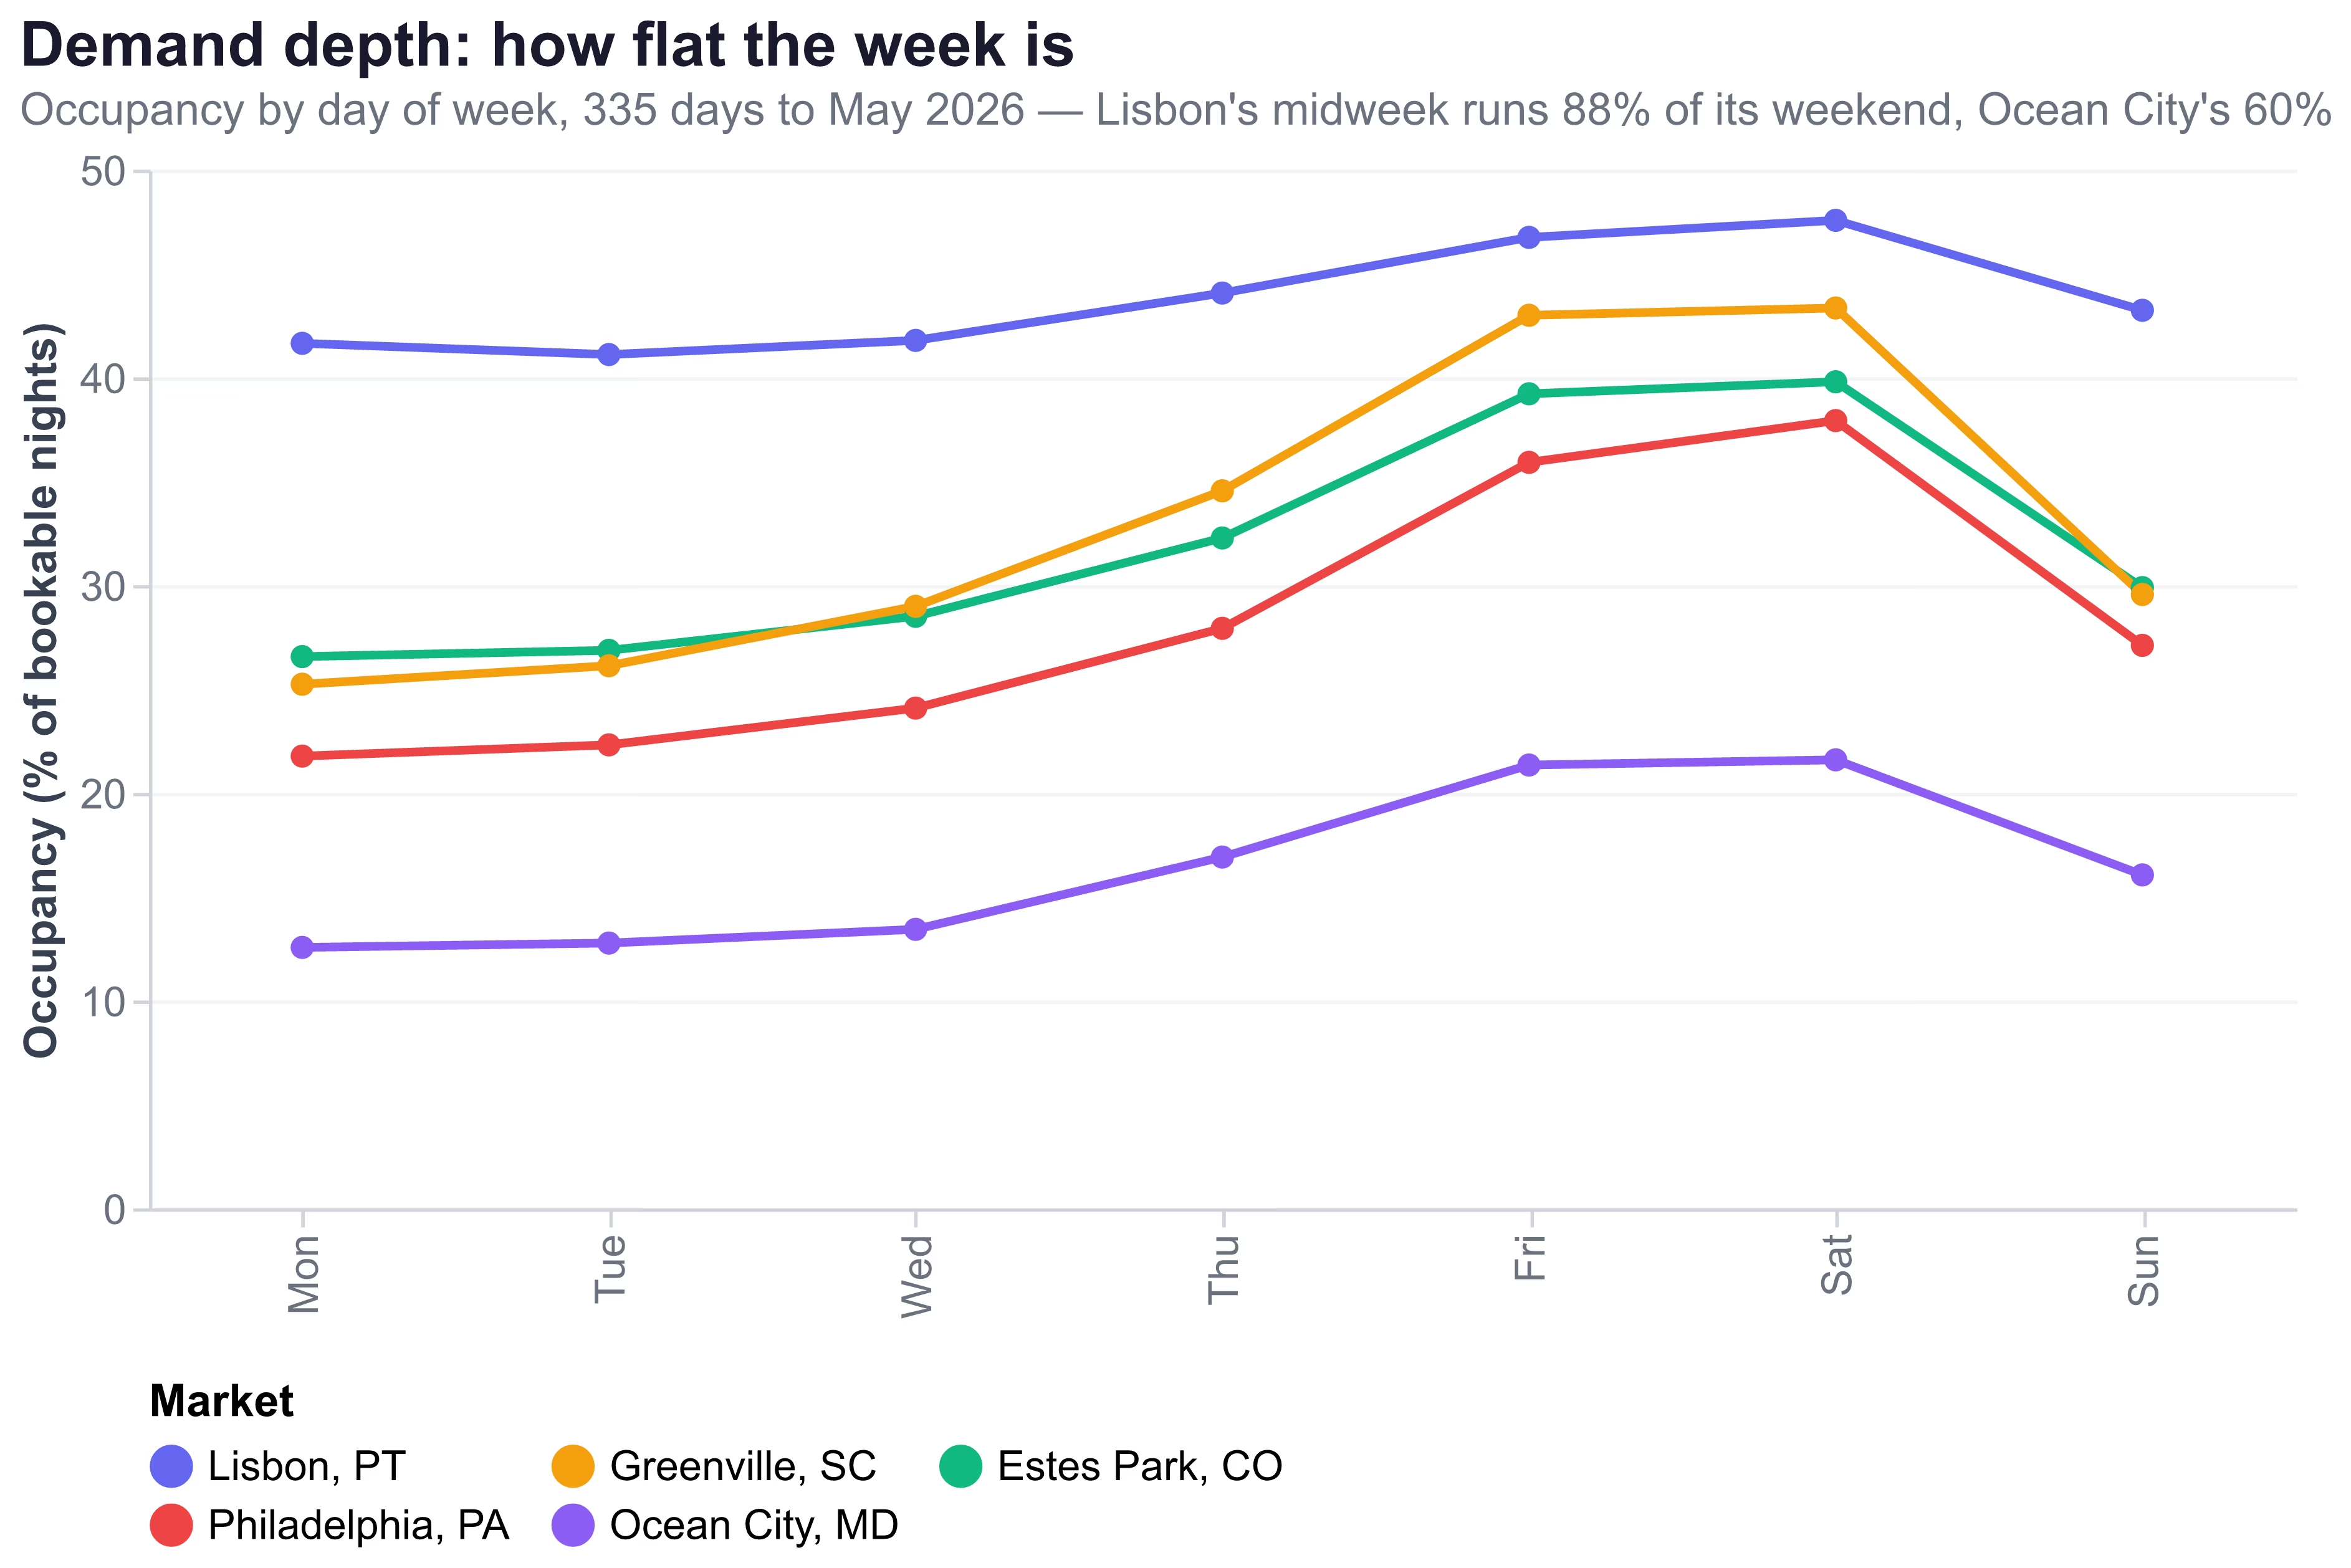
Lisbon's 0.880 sits above the US 90th percentile, though the benchmark is US-only, so read that as a reference placement rather than a rank. The more useful finding is that "urban" is not itself a demand-depth signal: Philadelphia runs 0.616, below the US median, and charges a 31.4% Saturday premium over Monday — weekend-leisure demand, not business travel, which inverts the usual assumption about big-city markets. Estes Park and Ocean City barely charge a weekend premium at all (+0.8% and −0.8%), because in a destination market the whole week is peak.
Booking lead time is the second demand-depth reading, and it contradicts the loudest belief in the host community. A June 2026 thread on r/ShortTermRentals (22 points, 45 comments) put the premise plainly:
"The claim is that booking lead times have collapsed industry-wide over the last 18 months. Hosts who used to see 60 to 70 percent of summer weekends booked by mid-May are now sitting at 20 to 30 percent at the same point in the year, and apparently this is showing up across markets, not just one region."
— r/ShortTermRentals, June 20, 2026
Average lead time by stay month rose in all five markets year over year: Philadelphia +25.0% (29.2 → 36.5 days), Ocean City +19.5%, Greenville +17.6%, Estes Park +11.5%, Lisbon +6.9%. Philadelphia's figure is inflated by two outlier months, but dropping June 2026 entirely still leaves +18.4%. This is a five-market read on our published series rather than a national panel, and portfolios genuinely differ — one Jersey Shore operator in that thread reported lead times down 20–30% across 12 listings. The collapse is not visible in these five markets.
Seasonality shape: how much of the year lives in three months
Two markets can post identical annual revenue and run completely different businesses; the metric that separates them is the share of the year's RevPAR earned in its three best months, paired with the peak-to-trough month ratio. A perfectly flat market would put 25.0% of its year in three months (3 ÷ 12) at a peak/trough of 1.00×. The US median market puts 37.3% in three months at 3.25×, and the top decile of concentration reaches 54.2% and 11.01×. Ocean City clears both: 68.2% of its year in three months, with a July peak that out-earns its January trough by 30.5× ($217.96 against $7.15 in per-listing RevPAR).
| Market | Top-3-month share | Peak month | Trough month | Peak ÷ trough | Months at or above 1/12 of the year |
|---|---|---|---|---|---|
| Ocean City, MD | 68.2% | Jul 2025 ($217.96) | Jan 2026 ($7.15) | 30.48× | 4 |
| Estes Park, CO | 45.1% | Jul 2025 ($289.51) | Jan 2026 ($53.12) | 5.45× | 5 |
| Lisbon, PT | 32.4% | Sep 2025 ($110.32) | Jan 2026 ($43.51) | 2.54× | 7 |
| Philadelphia, PA | 32.0% | May 2026 ($84.62) | Jan 2026 ($39.80) | 2.13× | 6 |
| Greenville, SC | 28.8% | Mar 2026 ($82.70) | Jan 2026 ($48.29) | 1.71× | 6 |
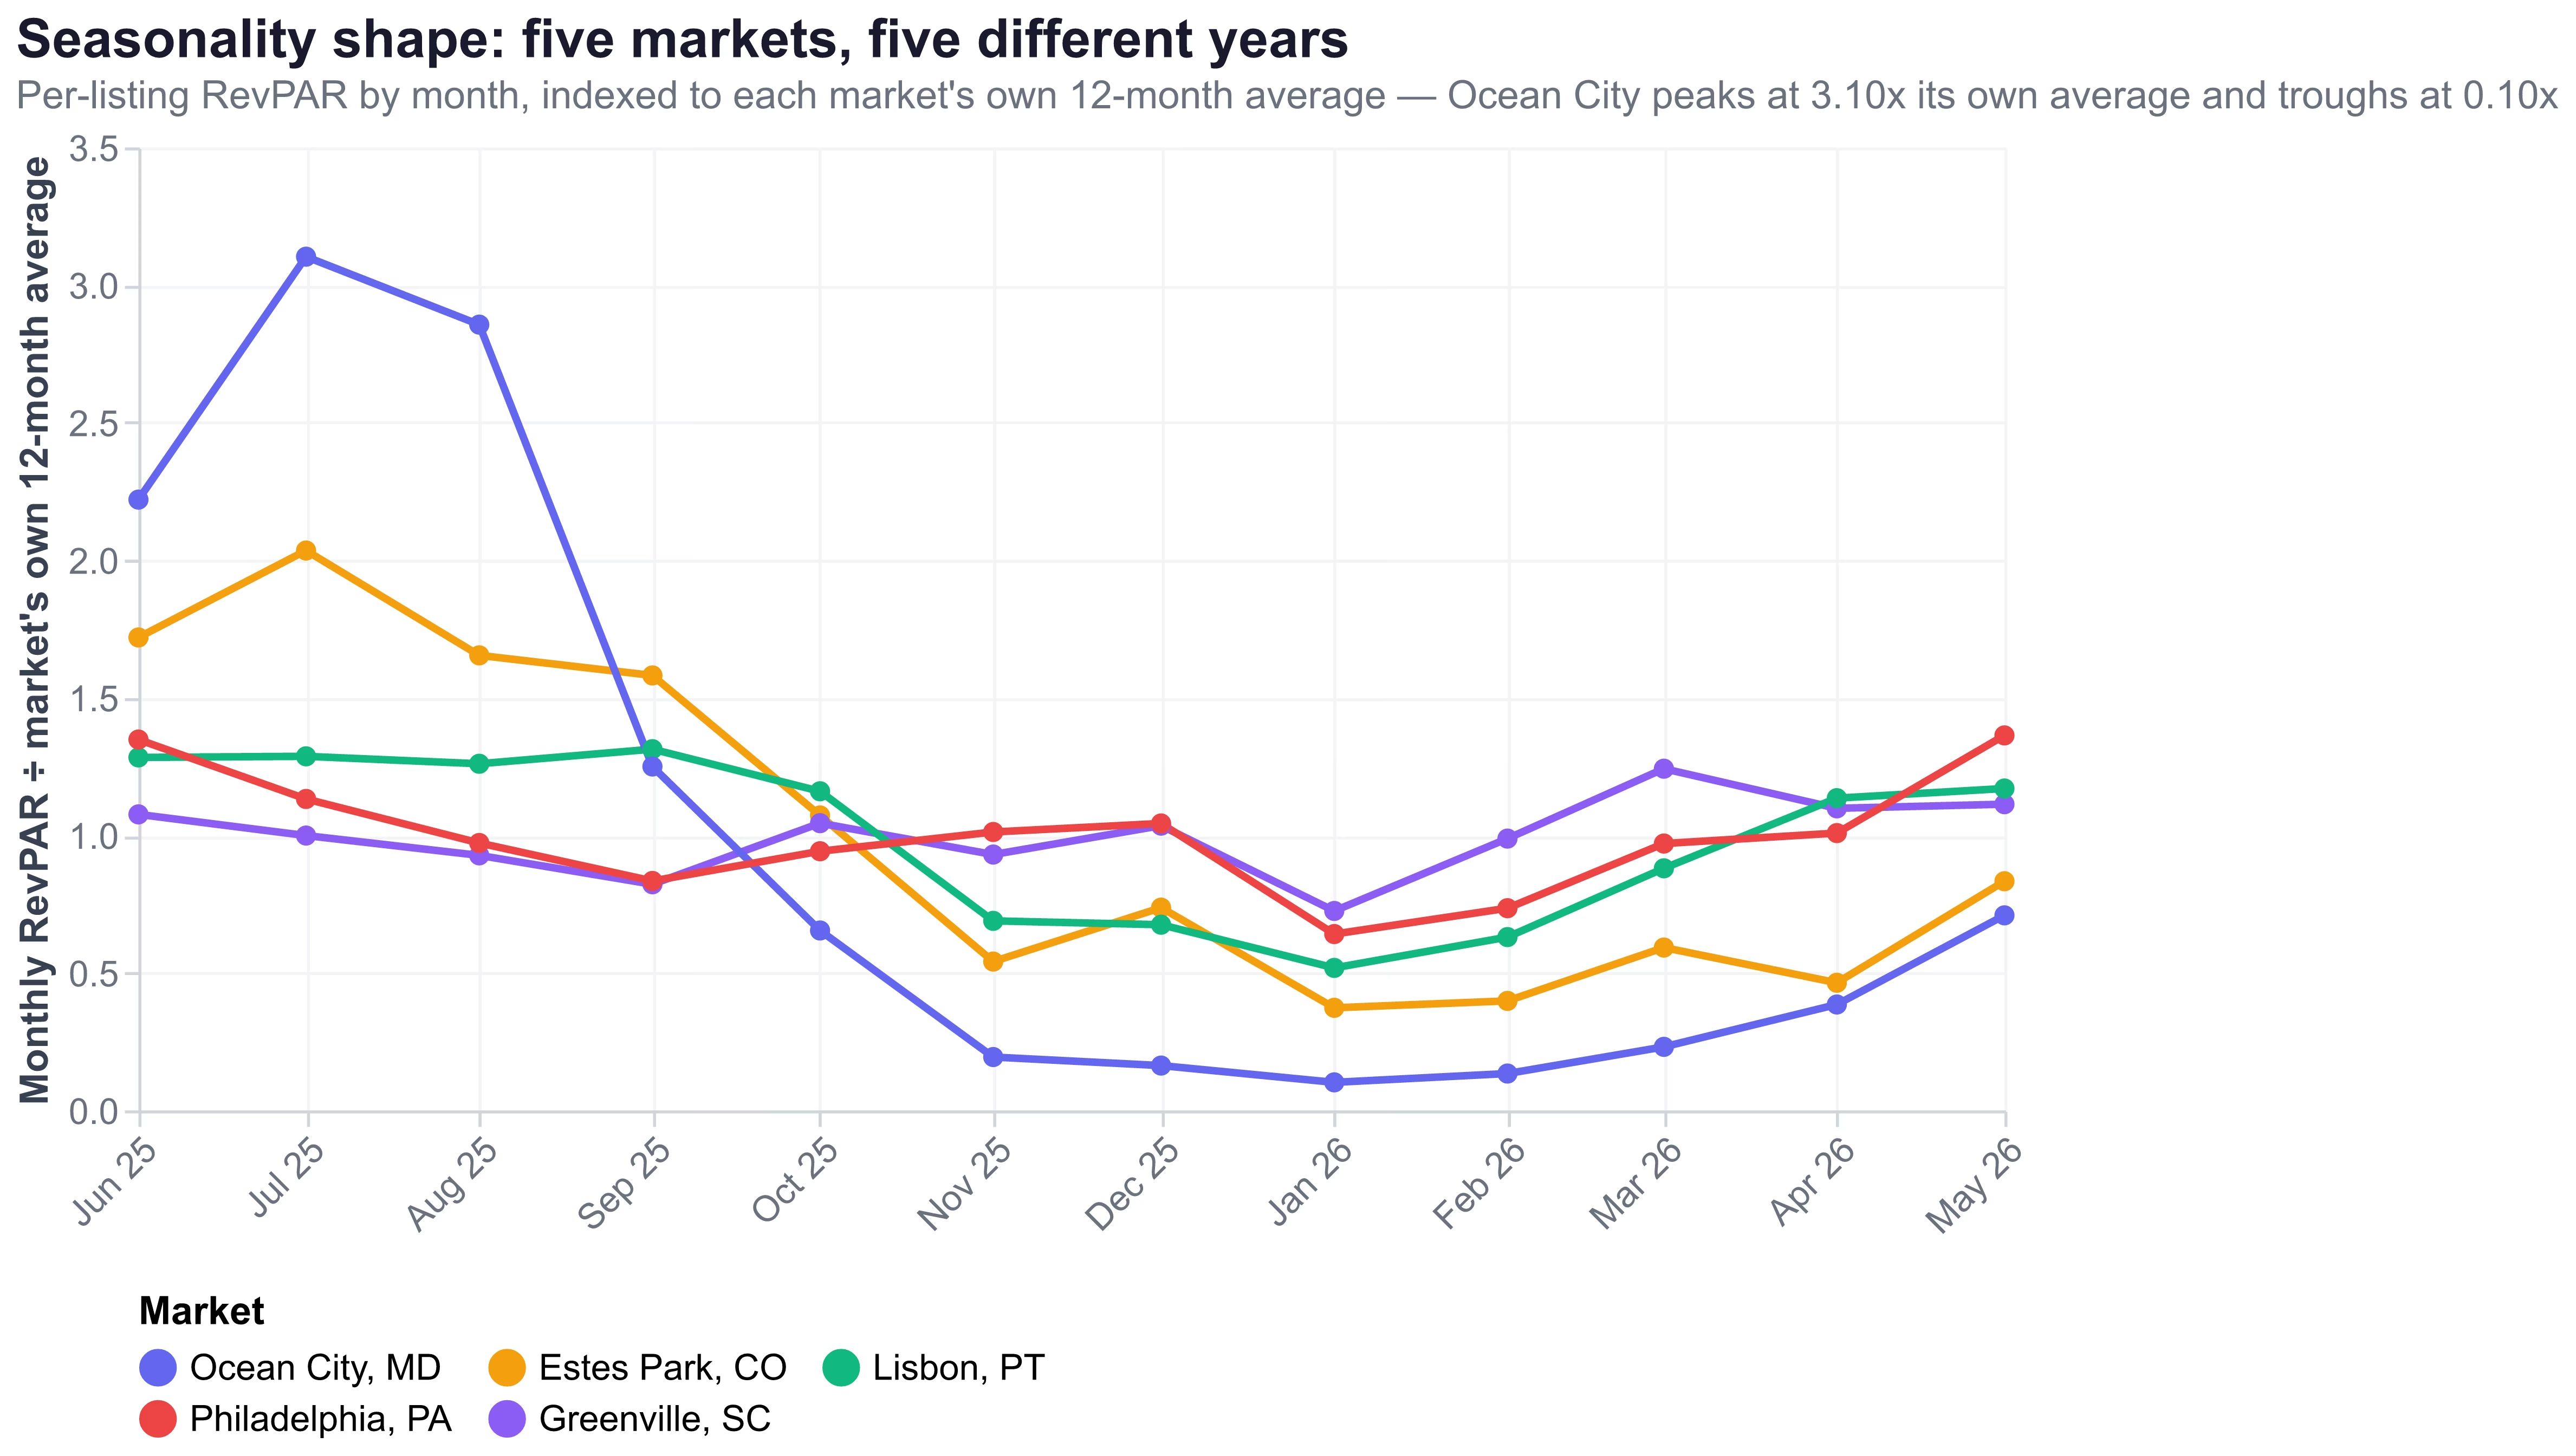
Greenville is the mirror image: flatter on peak/trough (1.71×) than the US 10th percentile (1.83×), with a March peak rather than a summer one. Two details in the table outrank the headline numbers. All five markets trough in January, so any twelve-month window starting or ending mid-winter distorts a level comparison. And Ocean City clears one-twelfth of its year in only four months — a four-month business carrying twelve months of costs.
The pairing that shows why the shape matters more than the level: on AirROI's published 12-month KPIs to June 2026, Ocean City and Estes Park look like the same kind of market — ADRs of $376.80 and $414.10, occupancy of 35% and 45% under rule C. On AirROI's listing-level panel, the median Ocean City entire home booked 46 nights in the trailing year against 105 in Estes Park. Same headline profile, different asset.
Supply saturation: growth measured against what the median earned
Supply growth on its own is close to uninformative, because almost every market grows. Comparing the July 2025 and June 2026 snapshots — two independently built vintages, an 11-month gap — entire-home supply grew in 772 of 1,034 US markets (74.7%), with a median of +5.7% and an aggregate move from 868,487 to 924,766 listings (+6.5%). The metric that carries signal is supply growth set against the change in what the median listing actually earned. We call the difference the absorption gap, and Greenville, SC is the clearest negative case in our five: supply +10.3% while median trailing-year revenue fell 9.8%, a gap of −20.1 percentage points.
| Market | Listings Jul 2025 → Jun 2026 | Supply growth | Median revenue Jul 2025 → Jun 2026 | Revenue change | Absorption gap |
|---|---|---|---|---|---|
| Estes Park, CO | 1,445 → 1,535 | +6.2% | $33,629 → $39,121 | +16.3% | +10.1 pp |
| Ocean City, MD | 4,348 → 5,052 | +16.2% | $16,120 → $18,104 | +12.3% | −3.9 pp |
| Philadelphia, PA | 3,954 → 4,323 | +9.3% | $13,673 → $13,456 | −1.6% | −10.9 pp |
| Lisbon, PT | 11,792 → 12,533 | +6.3% | $23,393 → $22,442 | −4.1% | −10.3 pp |
| Greenville, SC | 943 → 1,040 | +10.3% | $16,762 → $15,117 | −9.8% | −20.1 pp |
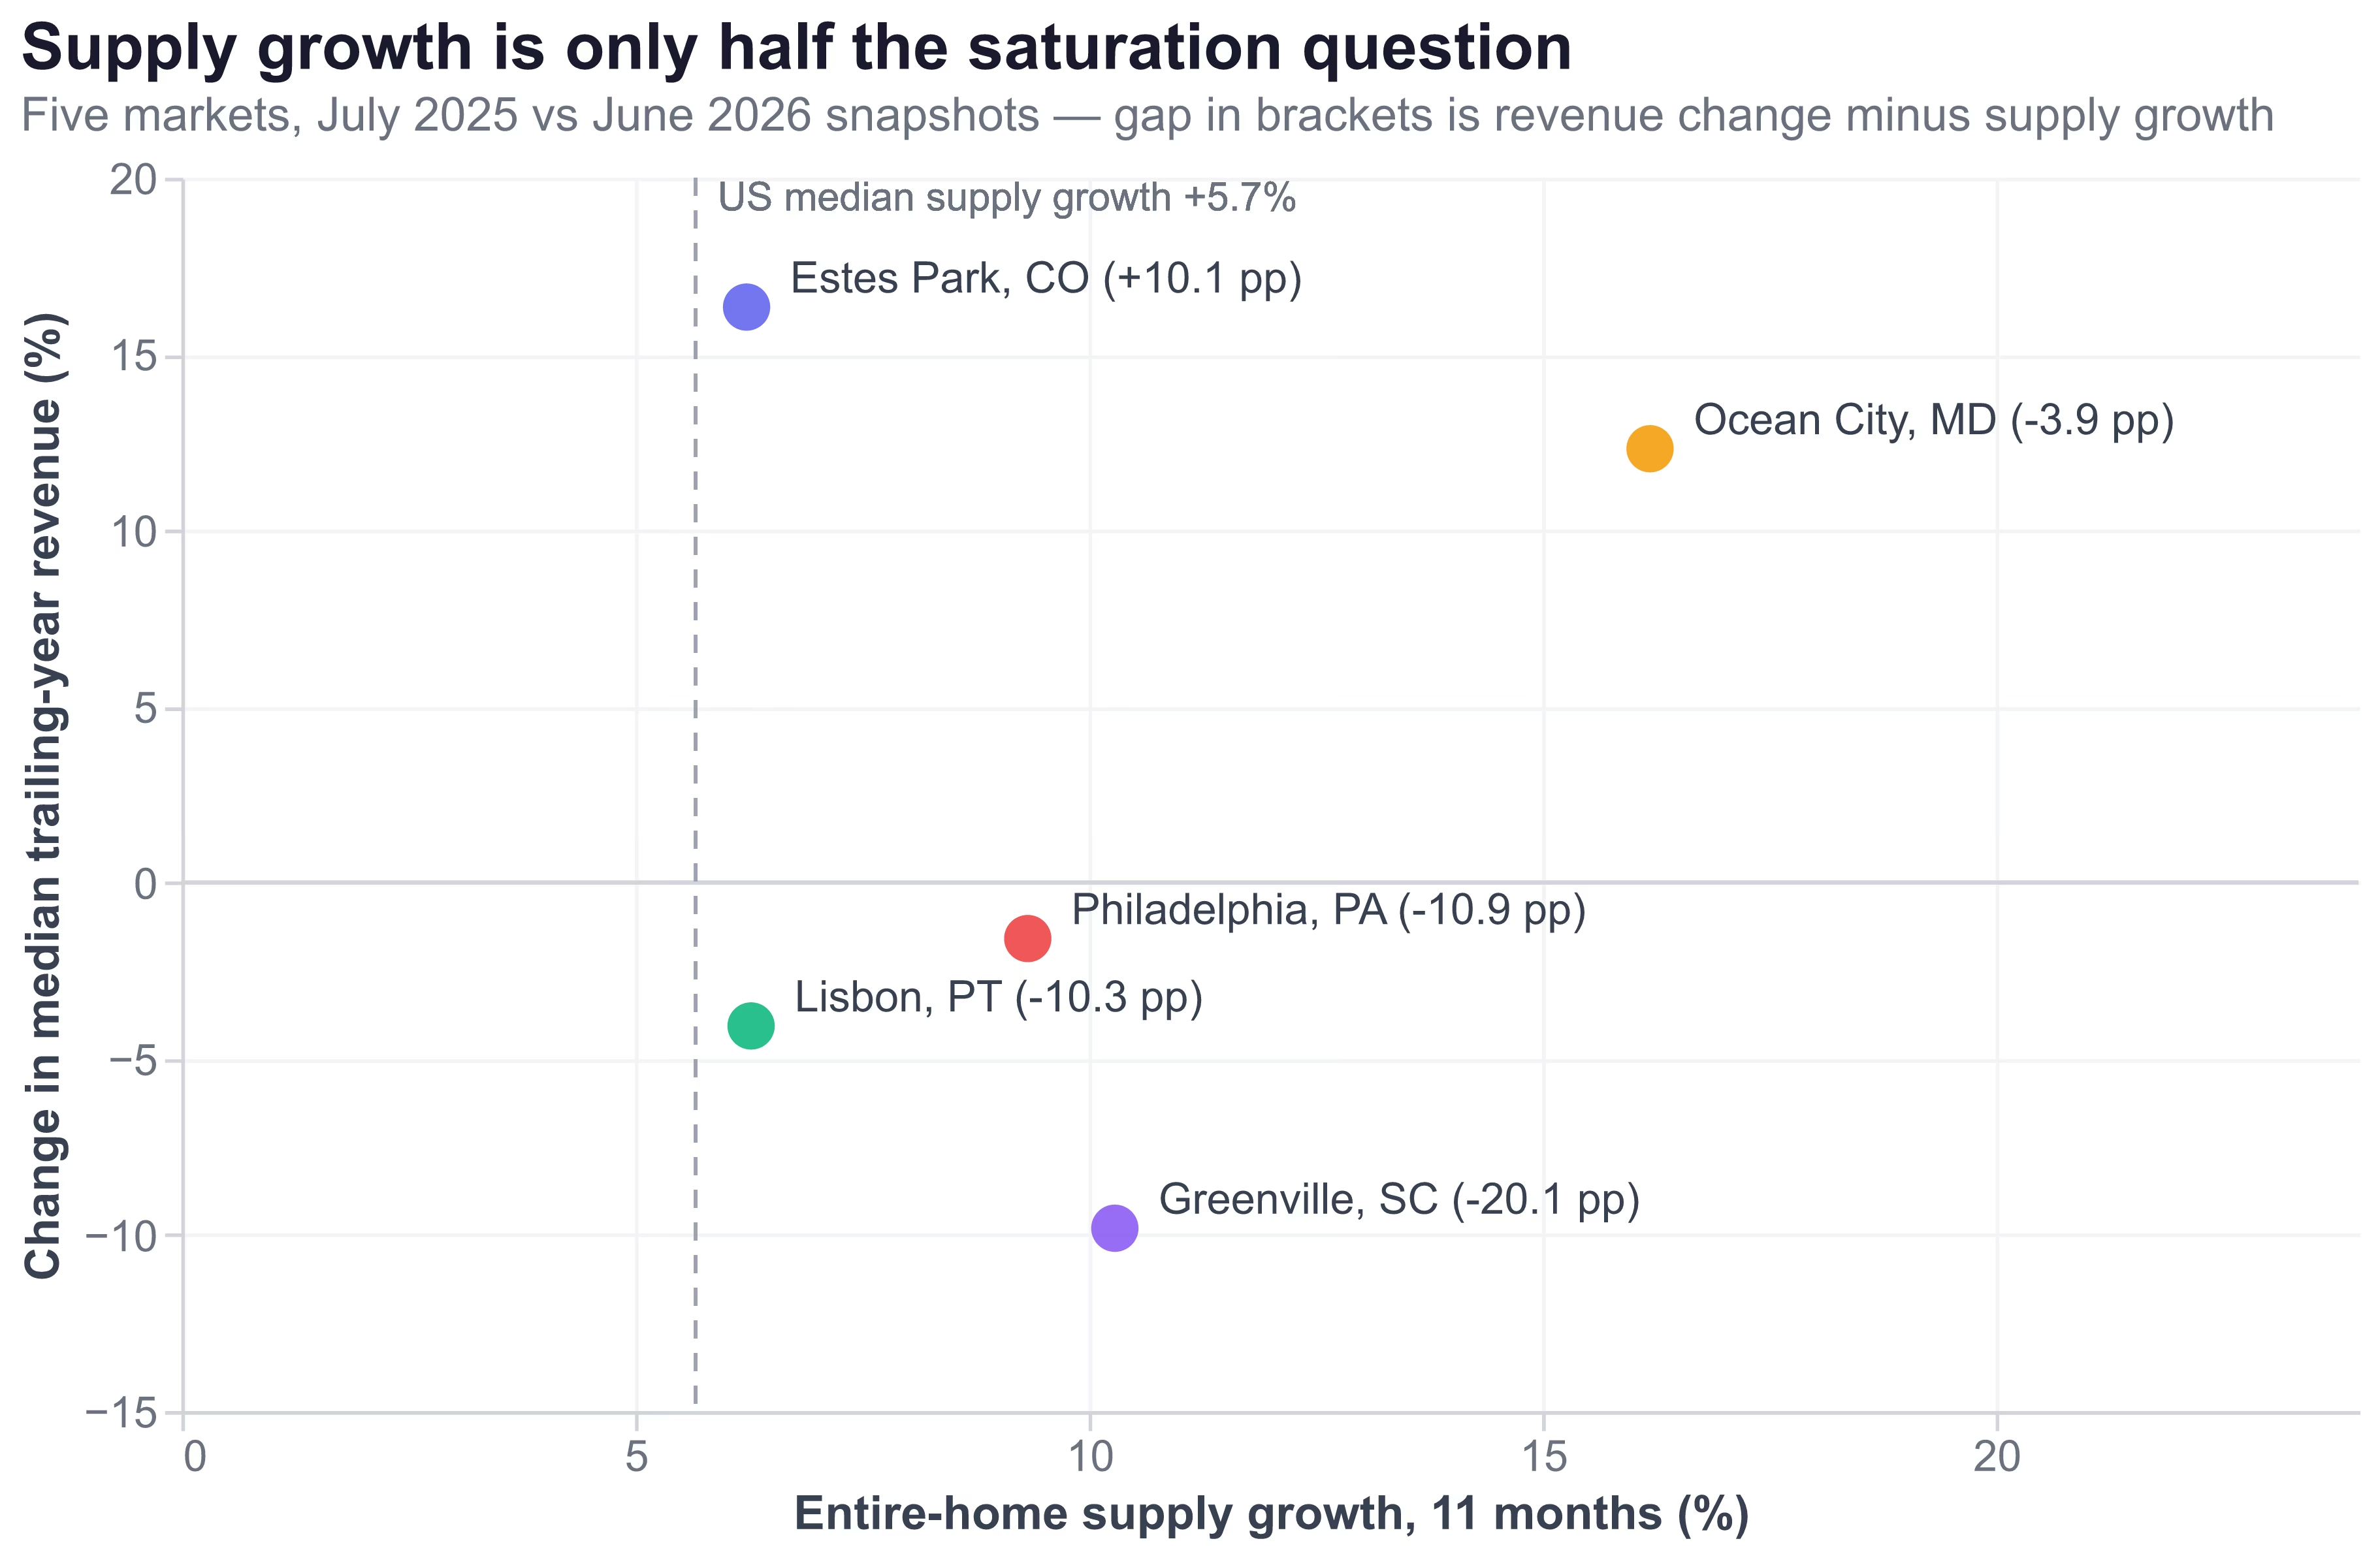
One warning, because it would have produced a fake finding: do not compute supply growth from a long public active-listings series without checking it first. Our own 24-month market-listings series steps down 12.1% to 22.6% in a single month — September 2024 — across all five of these unrelated markets, then climbs back above the August 2024 level over the following four to nine months: Greenville by January 2025 (879 against 877), Lisbon by March (13,868 against 13,810), Philadelphia by May (4,917 against 4,723), Ocean City and Estes Park by June (4,495 against 4,186, and 1,464 against 1,443). A one-month cliff in five unrelated markets at once, followed by a multi-month climb back to where the series started, is the signature of a re-baselined collection method rather than a supply event — which is why every growth figure above comes from two independent snapshot tables.
Regulatory posture: the cap and the listing count are different numbers
Regulatory posture is the one dimension whose primary source is an ordinance rather than a dataset, and the first thing to establish is that a municipality's licence count and a data provider's listing count measure different objects. Estes Park, Colorado caps residentially-zoned vacation homes inside Town limits at 322; AirROI counts 1,535 entire-home listings with a full trailing year geocoded to Estes Park. Both are correct, and the reconciliation is in the Town's own language.
"As of April 1, 2020 the 588 cap number which was maintained by the Town, was split between the Town and Larimer County resulting in 322 residential zoned properties in Town limits and 266 residential zoned properties in the unincorporated area of Larimer County."
"Please note there is no limit on the number of commercial-zoned Vacation Home Licenses."
— Town of Estes Park, Vacation Home Licensing, accessed July 30, 2026
The cap binds one zoning class inside Town limits; the data partition is the geocoded city, which sweeps in commercially-zoned properties and unincorporated Larimer County. Estes Park also froze the residential waitlist under Ordinance 16-21 (October 26, 2021) and terminates residential licences not issued by October 18, 2021 on transfer of ownership, so an existing licence is often not conveyed with the house. We cannot split the 1,535 by zoning and do not guess the overlap.
One regulatory signal is measurable in listing data: the share of listings displaying a registration or licence number. It runs 95.0% in Ocean City, 91.6% in Lisbon, 79.9% in Philadelphia, 2.8% in Estes Park and 0.0% in Greenville. Read it strictly as a proxy for platform-level registry integration, never as compliance — Estes Park caps residential licences and has frozen its waitlist since 2021 while displaying a licence number on 2.8% of listings, so 0.0% means no registry integration, not no rules. We could not obtain a primary ordinance source for Greenville at all (the city's short-term-rental page returns a 404), which is why Greenville carries the supply dimension here on data alone.
One more check belongs at the source rather than in a summary. Philadelphia splits short-term rentals into two use classes — a Zoning Permit "for limited lodging use if your property has a primary resident" against one "for visitor accommodation use if your property does not have a primary resident" — each carrying its own licence. Separately, Philadelphia's listings carry an average 12.7-night minimum stay, the highest of our five markets. Whether hosts set long minimums to land inside one use class rather than the other is an untested hypothesis: nothing on the city's page ties the use classes to a stay length, and we have run no test of the mechanism. The two facts sit side by side here, and a buyer should put the question to the city rather than infer the answer from us.
Revenue dispersion: what the market median hides
The last dimension asks how much of a market's revenue the top of the market takes, because a market median is a poor forecast for any individual property. Two ratios do the work: p90 ÷ p50 and p50 ÷ p25 of trailing-year revenue among listings offered for at least half the year. In the median US market the 90th-percentile listing earns about 3.13× the median. Philadelphia runs 3.89×, between the US 75th and 90th percentiles for internal inequality (3.59× and 4.35×), and its median listing earns 5.75× the 25th percentile, the widest bottom half in our five. Its top decile of listings takes 37.8% of all market revenue.
| Market | n | p25 | p50 | p90 | p90 ÷ p50 | p50 ÷ p25 | Top decile's revenue share | Listings booking <30 nights |
|---|---|---|---|---|---|---|---|---|
| Philadelphia, PA | 4,041 | $2,617 | $15,046 | $58,593 | 3.89× | 5.75× | 37.8% | 31.4% |
| Greenville, SC | 946 | $4,171 | $17,578 | $56,258 | 3.20× | 4.21× | 35.8% | 25.8% |
| Ocean City, MD | 4,632 | $6,554 | $17,861 | $56,977 | 3.19× | 2.73× | 34.4% | 38.2% |
| Estes Park, CO | 1,474 | $14,246 | $40,091 | $115,206 | 2.87× | 2.81× | 31.1% | 22.1% |
| Lisbon, PT | 11,928 | $8,871 | $23,949 | $64,506 | 2.69× | 2.70× | 32.7% | 17.9% |
Restricting the panel to listings that were bookable for at least 180 nights does not clean up the bottom of the distribution. In Philadelphia, Greenville and Estes Park the 10th-percentile listing among properties offered half the year or more earned $0. Between 17.9% and 38.2% of listings in these markets booked fewer than 30 nights in twelve months. Whatever the market median says, a meaningful minority of the competition is not a business.
Two ways a clean-looking twelve months lies
Even a full twelve months has two known failure modes, both checkable before you underwrite anything. The first: the most recent month in any snapshot is provisional. We took the same matched listings from two consecutive AirROI snapshots and asked both what May 2026 looked like. Lisbon's market occupancy read 38.14% first and 42.29% one month later — a +10.9% revision on 11,234 matched listings. Estes Park moved the other way, −5.3% on occupancy and −8.9% on per-listing revenue across 1,283 matched listings; Philadelphia +6.8%, Greenville +2.9%, Ocean City −4.7%.
The direction is not consistent, which kills the convenient story that the newest month always fills in upward. We have not established the mechanism — late-landing bookings, cancellations and blocked-day reclassification would all produce this — so the rule is to exclude the newest month from anything load-bearing, not to apply a correction factor.
| Philadelphia, June | Occupancy | ADR | RevPAR |
|---|---|---|---|
| June 2025 | 49% | $195.90 | $99.60 |
| June 2026 | 36% | $417.20 | $152.00 |
| Change | −26.5% | +113.0% | +52.6% |
June's share of trailing-12 RevPAR rose from 10.5% to 14.1% between the two years. The month Philadelphia hosted five matches priced 113.0% above the same month a year earlier while filling 26.5% fewer of its nights. We cannot attribute all of that to the tournament — supply mix and general 2026 rate inflation are also present — but nobody should underwrite a Philadelphia purchase off a trailing year that contains it, which is also why the seasonality figures here use a clean window ending May 31, 2026.
How we measured this
Data. AirROI listing-level snapshots dated June 30, 2026 (primary), May 31, 2026 and July 31, 2025, plus AirROI's public market API, pulled July 30, 2026. Every query, execution ID and raw response — including the two validation queries this section cites — is saved with this analysis.
Panel. Unless a table says otherwise: room_type = entire_home, a full trailing twelve months of data, and at least 180 bookable nights, so the property was genuinely offered for at least half the year. In our five markets that filter removes 4.0% to 9.0% of listings and moves their medians by −0.9% (Ocean City) to +16.8% (Greenville).
Windows. Two, never mixed. Revenue, dispersion and booked-night figures use the trailing twelve months July 1, 2025 to June 30, 2026. Seasonality and the occupancy decomposition use a clean twelve months, June 1, 2025 to May 31, 2026, excluding June 2026 — the snapshot's own unstable month, and a World Cup month in Philadelphia.
Benchmark universe. Every US city with at least 200 qualifying entire-home listings: 1,026 markets and 862,035 listings for the June 2026 panel, 1,034 markets for the supply comparison anchored on July 2025. Each market's median listing is computed first, then the distribution across market medians is reported, using an approximate quantile function (roughly 2% error at these sample sizes).
Revenue field. AirROI's trailing-twelve-month revenue field throughout, which includes fee components beyond the displayed nightly rate. A day-level recount for Estes Park reproduced mean booked days (104.36) and mean bookable days (326.15) exactly, while the sum of nightly rates on booked nights came to 90.5% of the stored figure. The two are never mixed in one calculation. That validation query carries no room-type filter, so its n=1,658 includes private rooms — it is not the entire-home panel defined above.
Limitations. Five worked examples illustrate the metrics; they do not test relationships between them, and we make no cross-market correlation claims from n=5. The benchmark is US-only, so Lisbon's percentile placements are references rather than ranks. Registration-display share measures platform-level registry integration, not compliance. We have no purchase prices, so no figure here is a cap rate, a cash-on-cash return or a yield. And we could not resolve Ocean City's current new-permit moratorium status in residential districts from primary sources, so this guide does not state it.
Five markets, five different businesses
Set the five dimensions side by side and the same markets sort differently in every column — the practical argument for measuring all five rather than screening on revenue and moving on.
| Market | Median TTM revenue | Demand depth (midweek ÷ weekend) | Top-3-month share | Absorption gap | p90 ÷ p50 | Registration display |
|---|---|---|---|---|---|---|
| Estes Park, CO | $40,091 | 0.691 | 45.1% | +10.1 pp | 2.87× | 2.8% |
| Lisbon, PT | $23,949 | 0.880 | 32.4% | −10.3 pp | 2.69× | 91.6% |
| Ocean City, MD | $17,861 | 0.602 | 68.2% | −3.9 pp | 3.19× | 95.0% |
| Greenville, SC | $17,578 | 0.621 | 28.8% | −20.1 pp | 3.20× | 0.0% |
| Philadelphia, PA | $15,046 | 0.616 | 32.0% | −10.9 pp | 3.89× | 79.9% |
Estes Park leads on earnings and absorption under a residential cap with a frozen waitlist, so access there depends on which licence class comes with the property. Lisbon has the deepest week and the narrowest revenue spread, and its median listing's revenue still fell 4.1% over eleven months. Ocean City concentrates two-thirds of its year into three months and still absorbed supply growth above the US 75th percentile. Greenville is the flattest of the five and the one where supply growth outran realised revenue by the widest margin. Philadelphia has the widest internal inequality and a trailing year containing an event that will not repeat.
What the five dimensions do not price is the acquisition. We measure revenue, demand and supply; we do not have purchase prices, so no number here is a return. That gap matters less than it sounds, because the dispersion inside a market is wider than the difference between markets: the 90th-percentile listing earns about 3.13× the median listing in the median US market, while the median listing in a 90th-percentile market earns only 1.79× ($42,596 ÷ $23,863) what it earns in the median market. Both are p90-to-p50 ratios — one across listings inside a market, one across market medians — and the within-market spread is the larger of the two. Choosing between two mid-tier markets is a smaller decision than which property you buy inside either one and how well it is run.
This guide is for informational purposes only and is not investment, legal or tax advice. Regulatory details are as of the access dates shown and change frequently; verify every ordinance with the municipality before committing capital. AirROI measures observed rates, availability and bookings — not returns.
Frequently Asked Questions
There is no single figure, because occupancy depends on which listings are in the denominator. Across 1,026 US markets in the year to June 2026, the median market's median entire-home listing booked 83 nights and filled 25.9% of the nights it was actually available; a top-quartile market clears 31.6%. The 55–75% range common in host guides counts only listings that were active and booked at least one night, and often only full-time operators — under that rule the five markets we measured read 39.1% to 59.4%.
At minimum a full twelve months, and treat the most recent month as provisional. Reading the same calendar month (May 2026) from two consecutive AirROI snapshots for the same matched listings moved market occupancy by −5.3% to +10.9% and per-listing revenue by −8.9% to +7.9%. Also check whether your twelve months contain a one-off: Philadelphia's June 2026 ADR ran 113.0% above June 2025 because the city hosted five World Cup matches that month.
Usually the denominator and the boundary, not the underlying bookings. Occupancy computed over every listing-month versus only active-and-booked listing-months differs by up to 21.5 percentage points in the same market and window. Boundaries diverge too: Estes Park's residential licence cap covers 322 properties inside Town limits, while the geocoded city partition in our data holds 1,535 entire-home listings with a full trailing year.
In the year to June 30, 2026, the median 2-bedroom entire home offered for at least half the year earned $37,261 in Estes Park, CO (n=493), $27,832 in Lisbon (n=3,931), $20,867 in Greenville, SC (n=320), $15,648 in Ocean City, MD (n=2,009) and $13,293 in Philadelphia (n=1,140). In every one of those markets the 90th-percentile 2-bedroom earned 2.4× to 4.1× the median, so the median is a starting point rather than a forecast.