Eclipse 2026: Airbnb Occupancy Traces the Path of Totality

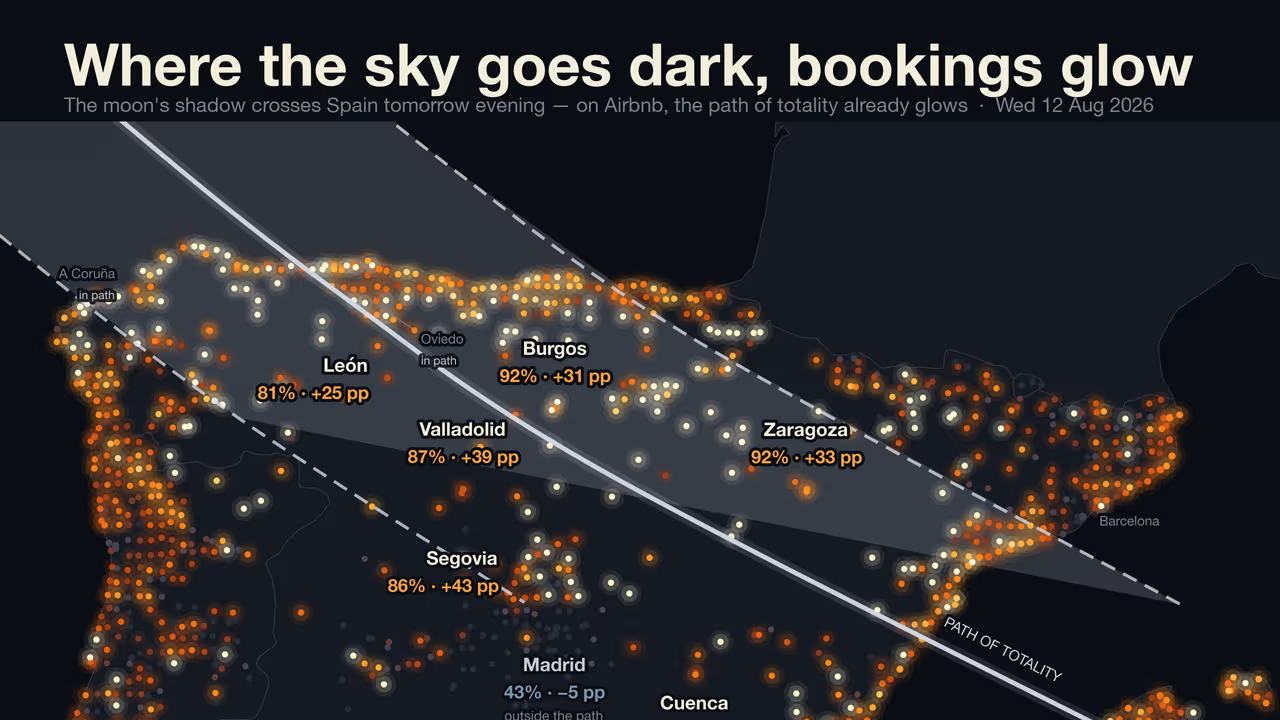
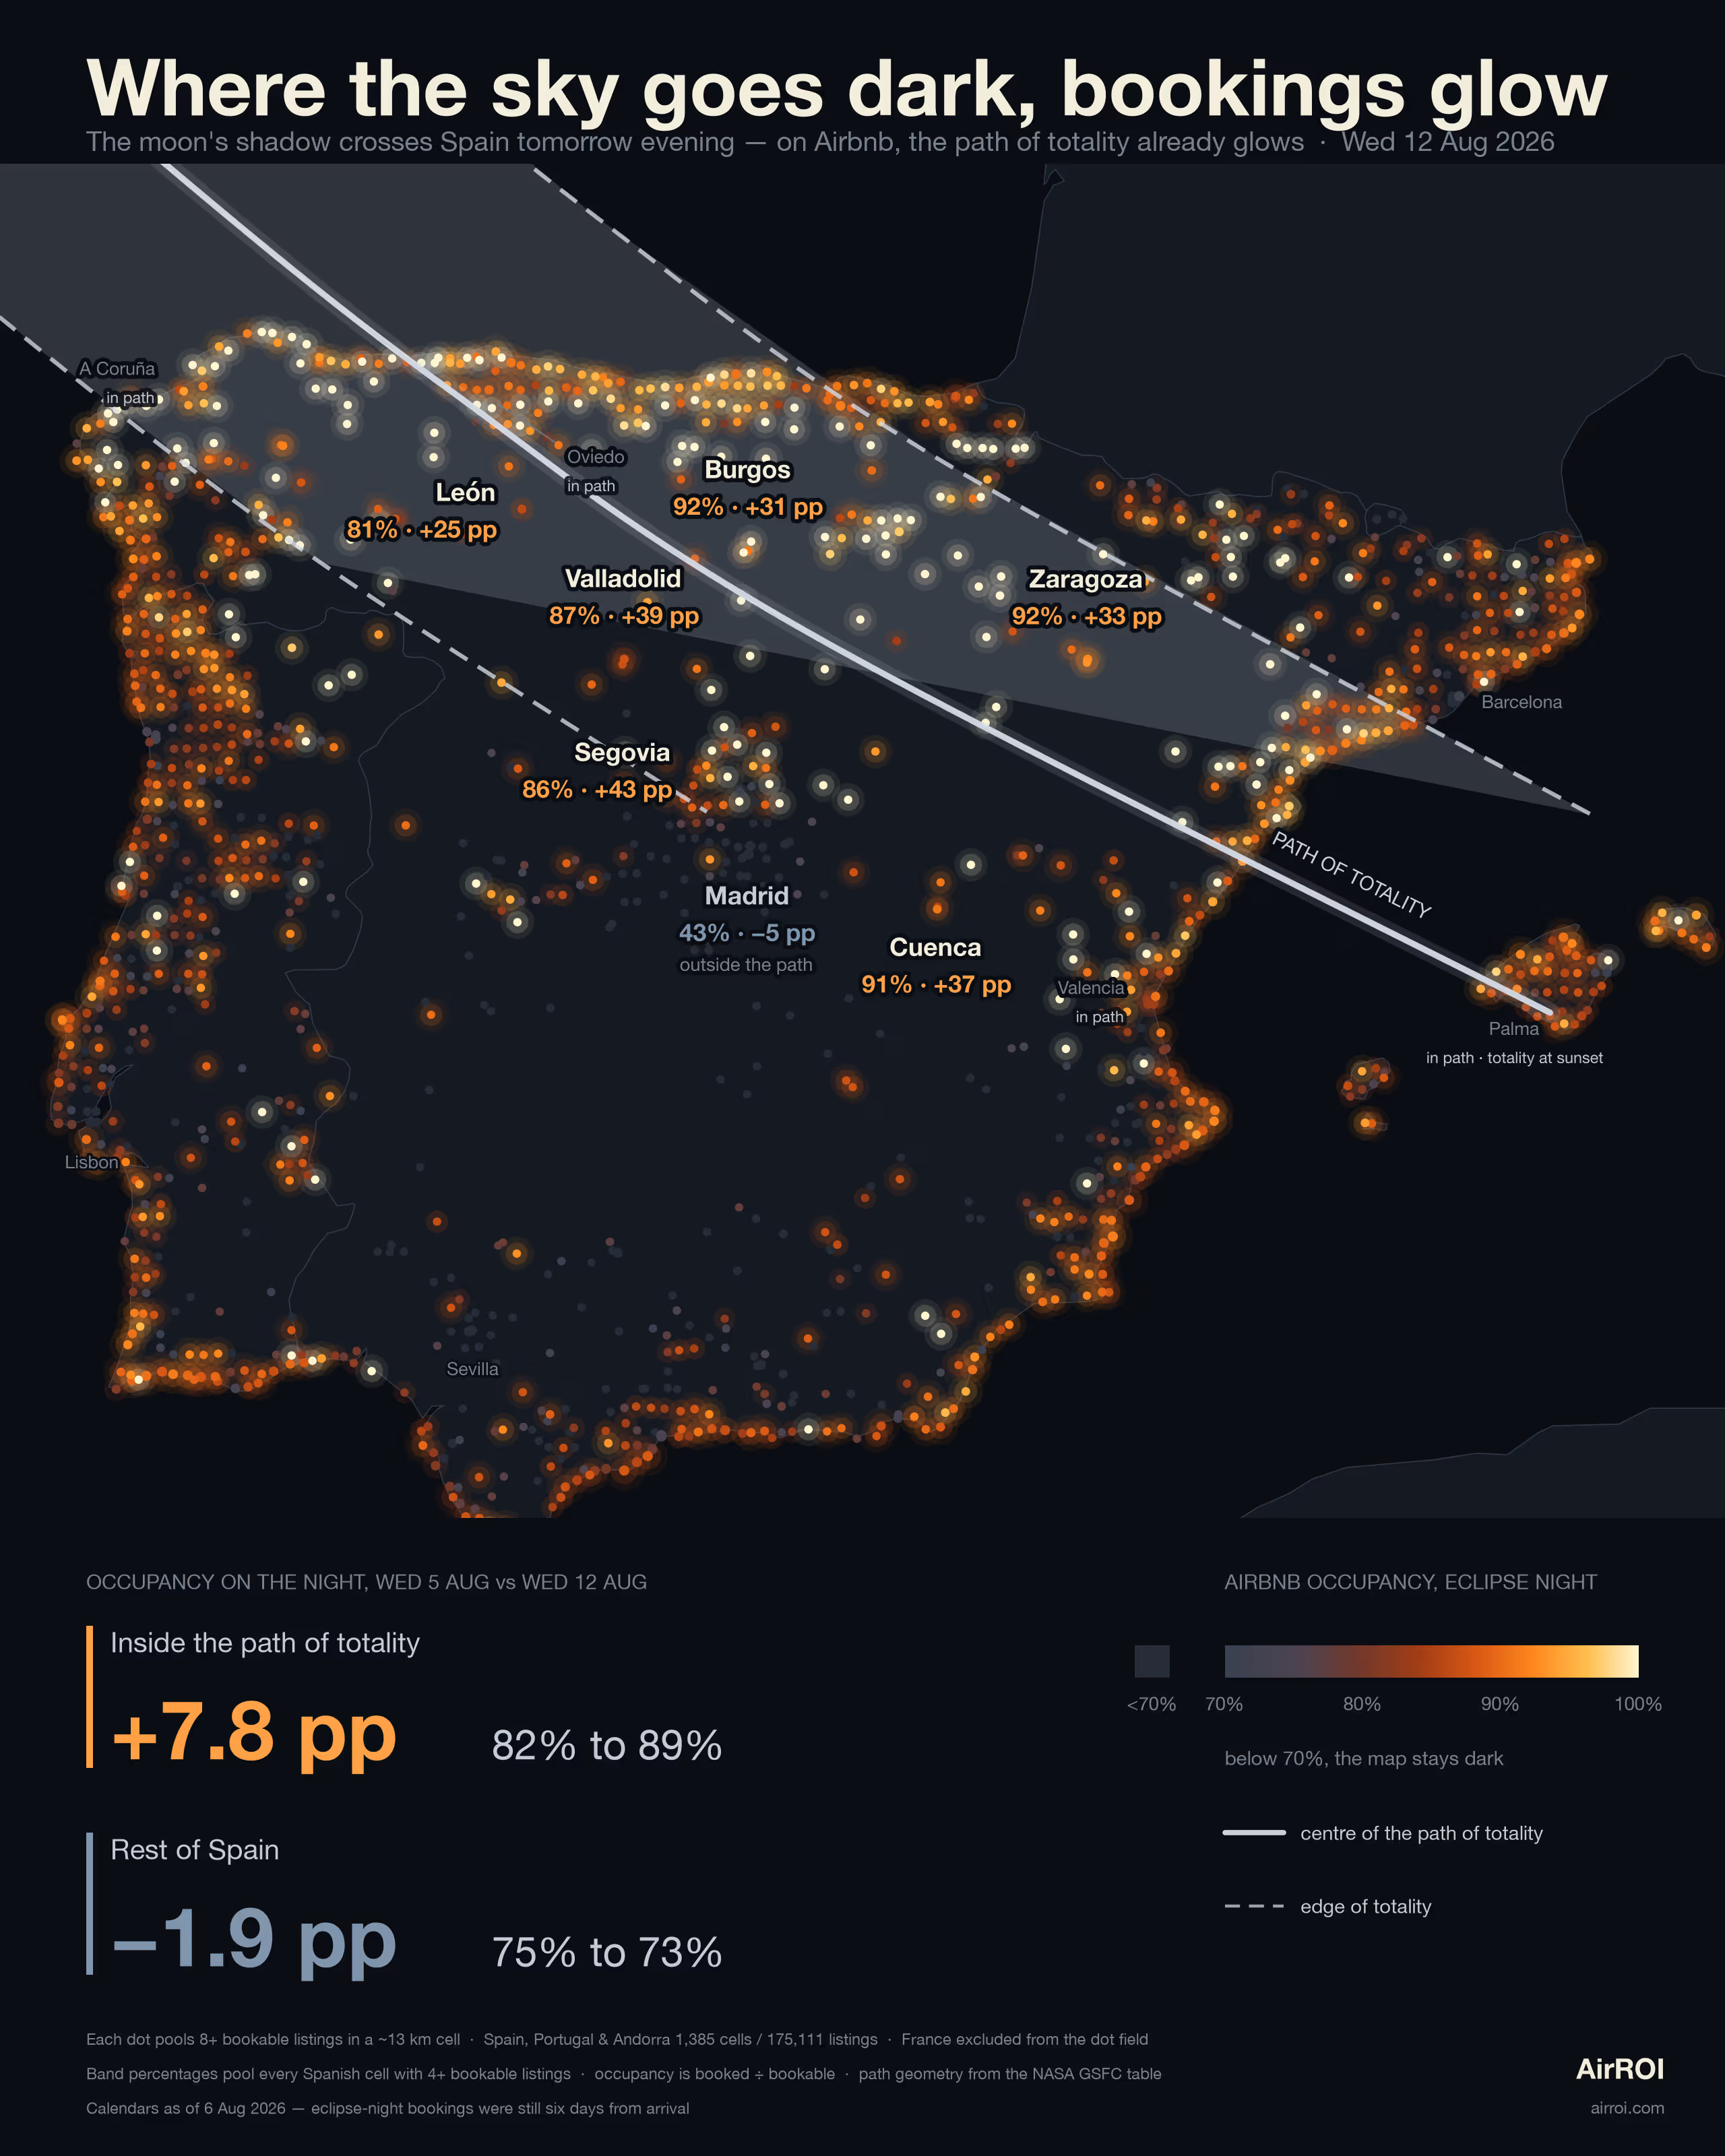
Tomorrow evening the moon's shadow crosses northern Spain and western Iceland. We mapped Airbnb occupancy for eclipse night and the path of totality is visible in the data alone — a corridor of near-sold-out towns cutting through the emptiest part of the country. Inside the path, Spanish listings hit 89% occupancy on a Wednesday night in August. Outside it: 73%. A week earlier those two groups were basically the same market.
At a glance (AirROI analysis, August 2026)
- Eclipse-night occupancy inside the path of totality: 89% (vs 73% rest of Spain)
- Week-over-week change: +7.8 pp inside the path, −1.9 pp outside
- Same Wednesday last year: 71% inside, 62% outside — in-path premium +9.4 pp then, +16.1 pp now
- Corridor town year-over-year: Logroño 49% → 97%, Burgos 49% → 92%, Zaragoza 45% → 92%
- Price signal: Spanish path markets raised rates +6.7% median (74% raised); French holiday markets −1.5% (34% raised)
The corridor appears in one week
AirROI's analysis shows a single-week occupancy gain of 7.8 percentage points inside the path of totality — from 82% on Wednesday 5 August to 89% on Wednesday 12 August — while the rest of Spain fell from 75% to 73%. The corridor gained while the country contracted.
Interior Spain is the empty half of the country in August. Everyone is at the coast. Except this week, in a 290 km-wide strip running from Galicia through Castilla y León to the Balearics:
| City | 5 Aug 2026 | 12 Aug 2026 | Change |
|---|---|---|---|
| Segovia | 43% | 86% | +43 pp |
| Valladolid | 48% | 87% | +39 pp |
| Cuenca | 53% | 91% | +37 pp |
| Logroño | 63% | 97% | +34 pp |
| Zaragoza | 60% | 92% | +33 pp |
| Burgos | 61% | 92% | +31 pp |
| León | 57% | 82% | +25 pp |
Madrid, an hour down the road, stayed at 43% — down 5 points from the week before. The difference between Madrid and Burgos is a line NASA published years ago. Madrid sits 157 km from the centre of the eclipse path, just outside the ~150 km edge of totality over Spain.
The effect decays with distance from the centre line
We sorted every Airbnb cell in Iberia by its distance from the centre of the eclipse path and pooled occupancy within distance bands, producing a dose-response curve clean enough to read the eclipse geometry off the x-axis. The effect peaks at 50–100 km — interior towns with maximum headroom — and flips sign at almost exactly the ~150 km boundary where totality ends.
| Distance from centre line | Occupancy change (5 → 12 Aug) | Note |
|---|---|---|
| 0–50 km | +6.6 pp | Centre line hits the Asturian coast — already full, less headroom |
| 50–100 km | +10.1 pp | Peak effect — interior towns with maximum headroom |
| 100–150 km | +7.0 pp | Still inside the path |
| 150–200 km | −2.9 pp | Past the edge — the eclipse premium is gone |
| 200–300 km | +0.2 pp | Flat |
| 300–400 km | −3.8 pp | Normal August fade |
The 0–50 km band is lower than 50–100 km because the centre line comes ashore on the north coast, which was already near-full in August and had little room to grow. The interior towns 50–150 km from the line had all the headroom — and they used it. In-path cells cap at 151 km from the centre line; the first out-of-path cells start at 143 km.
This band did not exist last August
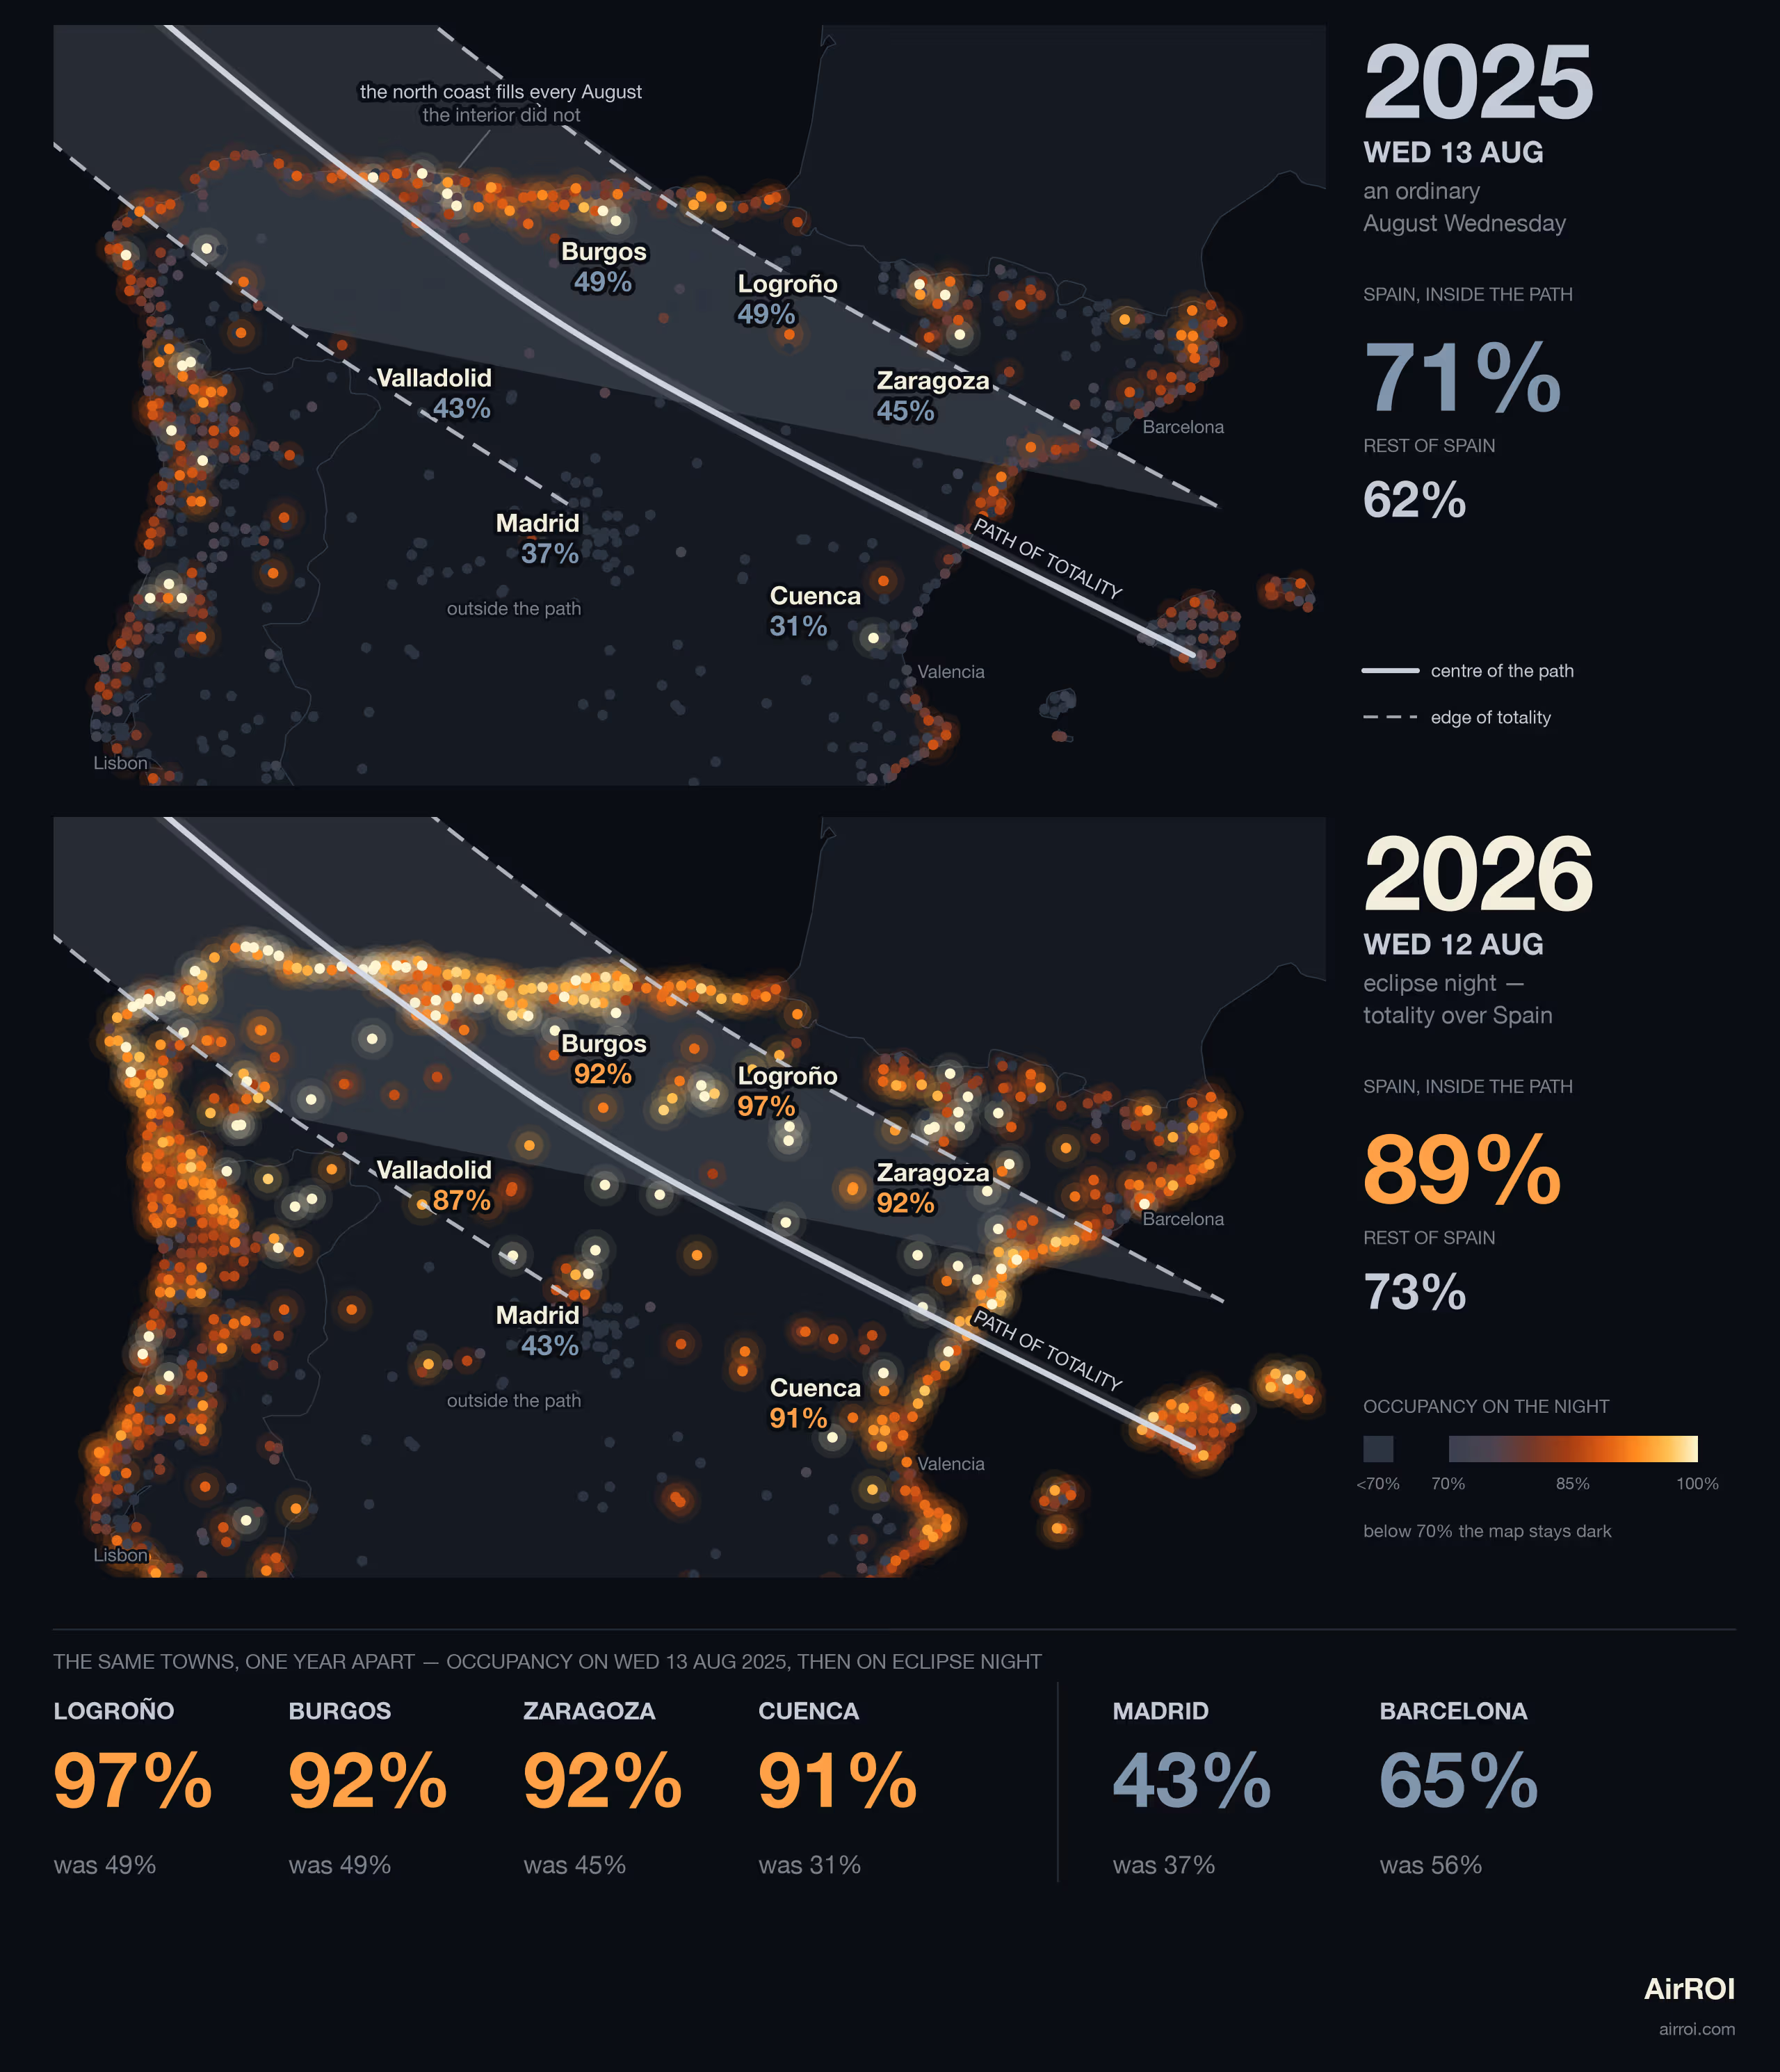
Week-over-week proves the corridor exists. Year-over-year proves it is new. We reconstructed the same occupancy map for Wednesday 13 August 2025 — same weekday, same week of August — from our listing-level archive. The 2025 and 2026 maps are drawn on the same 805 matched cells, so only the colour changes — the dots sit in the same positions.
| Wed 13 Aug 2025 (settled) | Wed 12 Aug 2026 (6 days out) | |
|---|---|---|
| Spain, inside the path | 71% | 89% |
| Rest of Spain | 62% | 73% |
| In-path premium | +9.4 pp | +16.1 pp |
The in-path region always runs about 9 points above the rest of Spain in August — it contains the premium north coast. That premium was +9.0 pp on 6 August 2025 and +9.4 pp on 13 August 2025: flat, week to week, year to year. On eclipse night it is +16.1 pp. Three control Wednesdays, one explosion.
The same towns, same weekday, one year apart:
| City | Aug 2025 | Eclipse night 2026 | In the path? |
|---|---|---|---|
| Logroño | 49% | 97% | Yes |
| Burgos | 49% | 92% | Yes |
| Zaragoza | 45% | 92% | Yes |
| Cuenca | 31% | 91% | Yes |
| Valladolid | 43% | 87% | Yes |
| Madrid | 37% | 43% | No — 157 km off centre |
| Barcelona | 56% | 65% | No |
Madrid gained 6 points. Barcelona gained 9. Both are normal year-over-year drift for a large urban market in August. The corridor towns gained 40 to 48 points. That is not drift.
Price confirms it is the eclipse, not the calendar
Among markets that gained 8 or more points of occupancy between 5 and 12 August, Spanish path-of-totality markets raised nightly rates by a median of 6.7%, with 74% of them increasing price. French markets filling for the same dates — the run-up to the 15 August bank holiday — discounted by a median of 1.5%, with only 34% raising price. Same occupancy move. Opposite price move. That separates a demand shock from a bank holiday.
| Spanish path markets | French markets | |
|---|---|---|
| Median rate change | +6.7% | −1.5% |
| Share raising price | 74% | 34% |
Iceland: the same shadow, forty minutes earlier
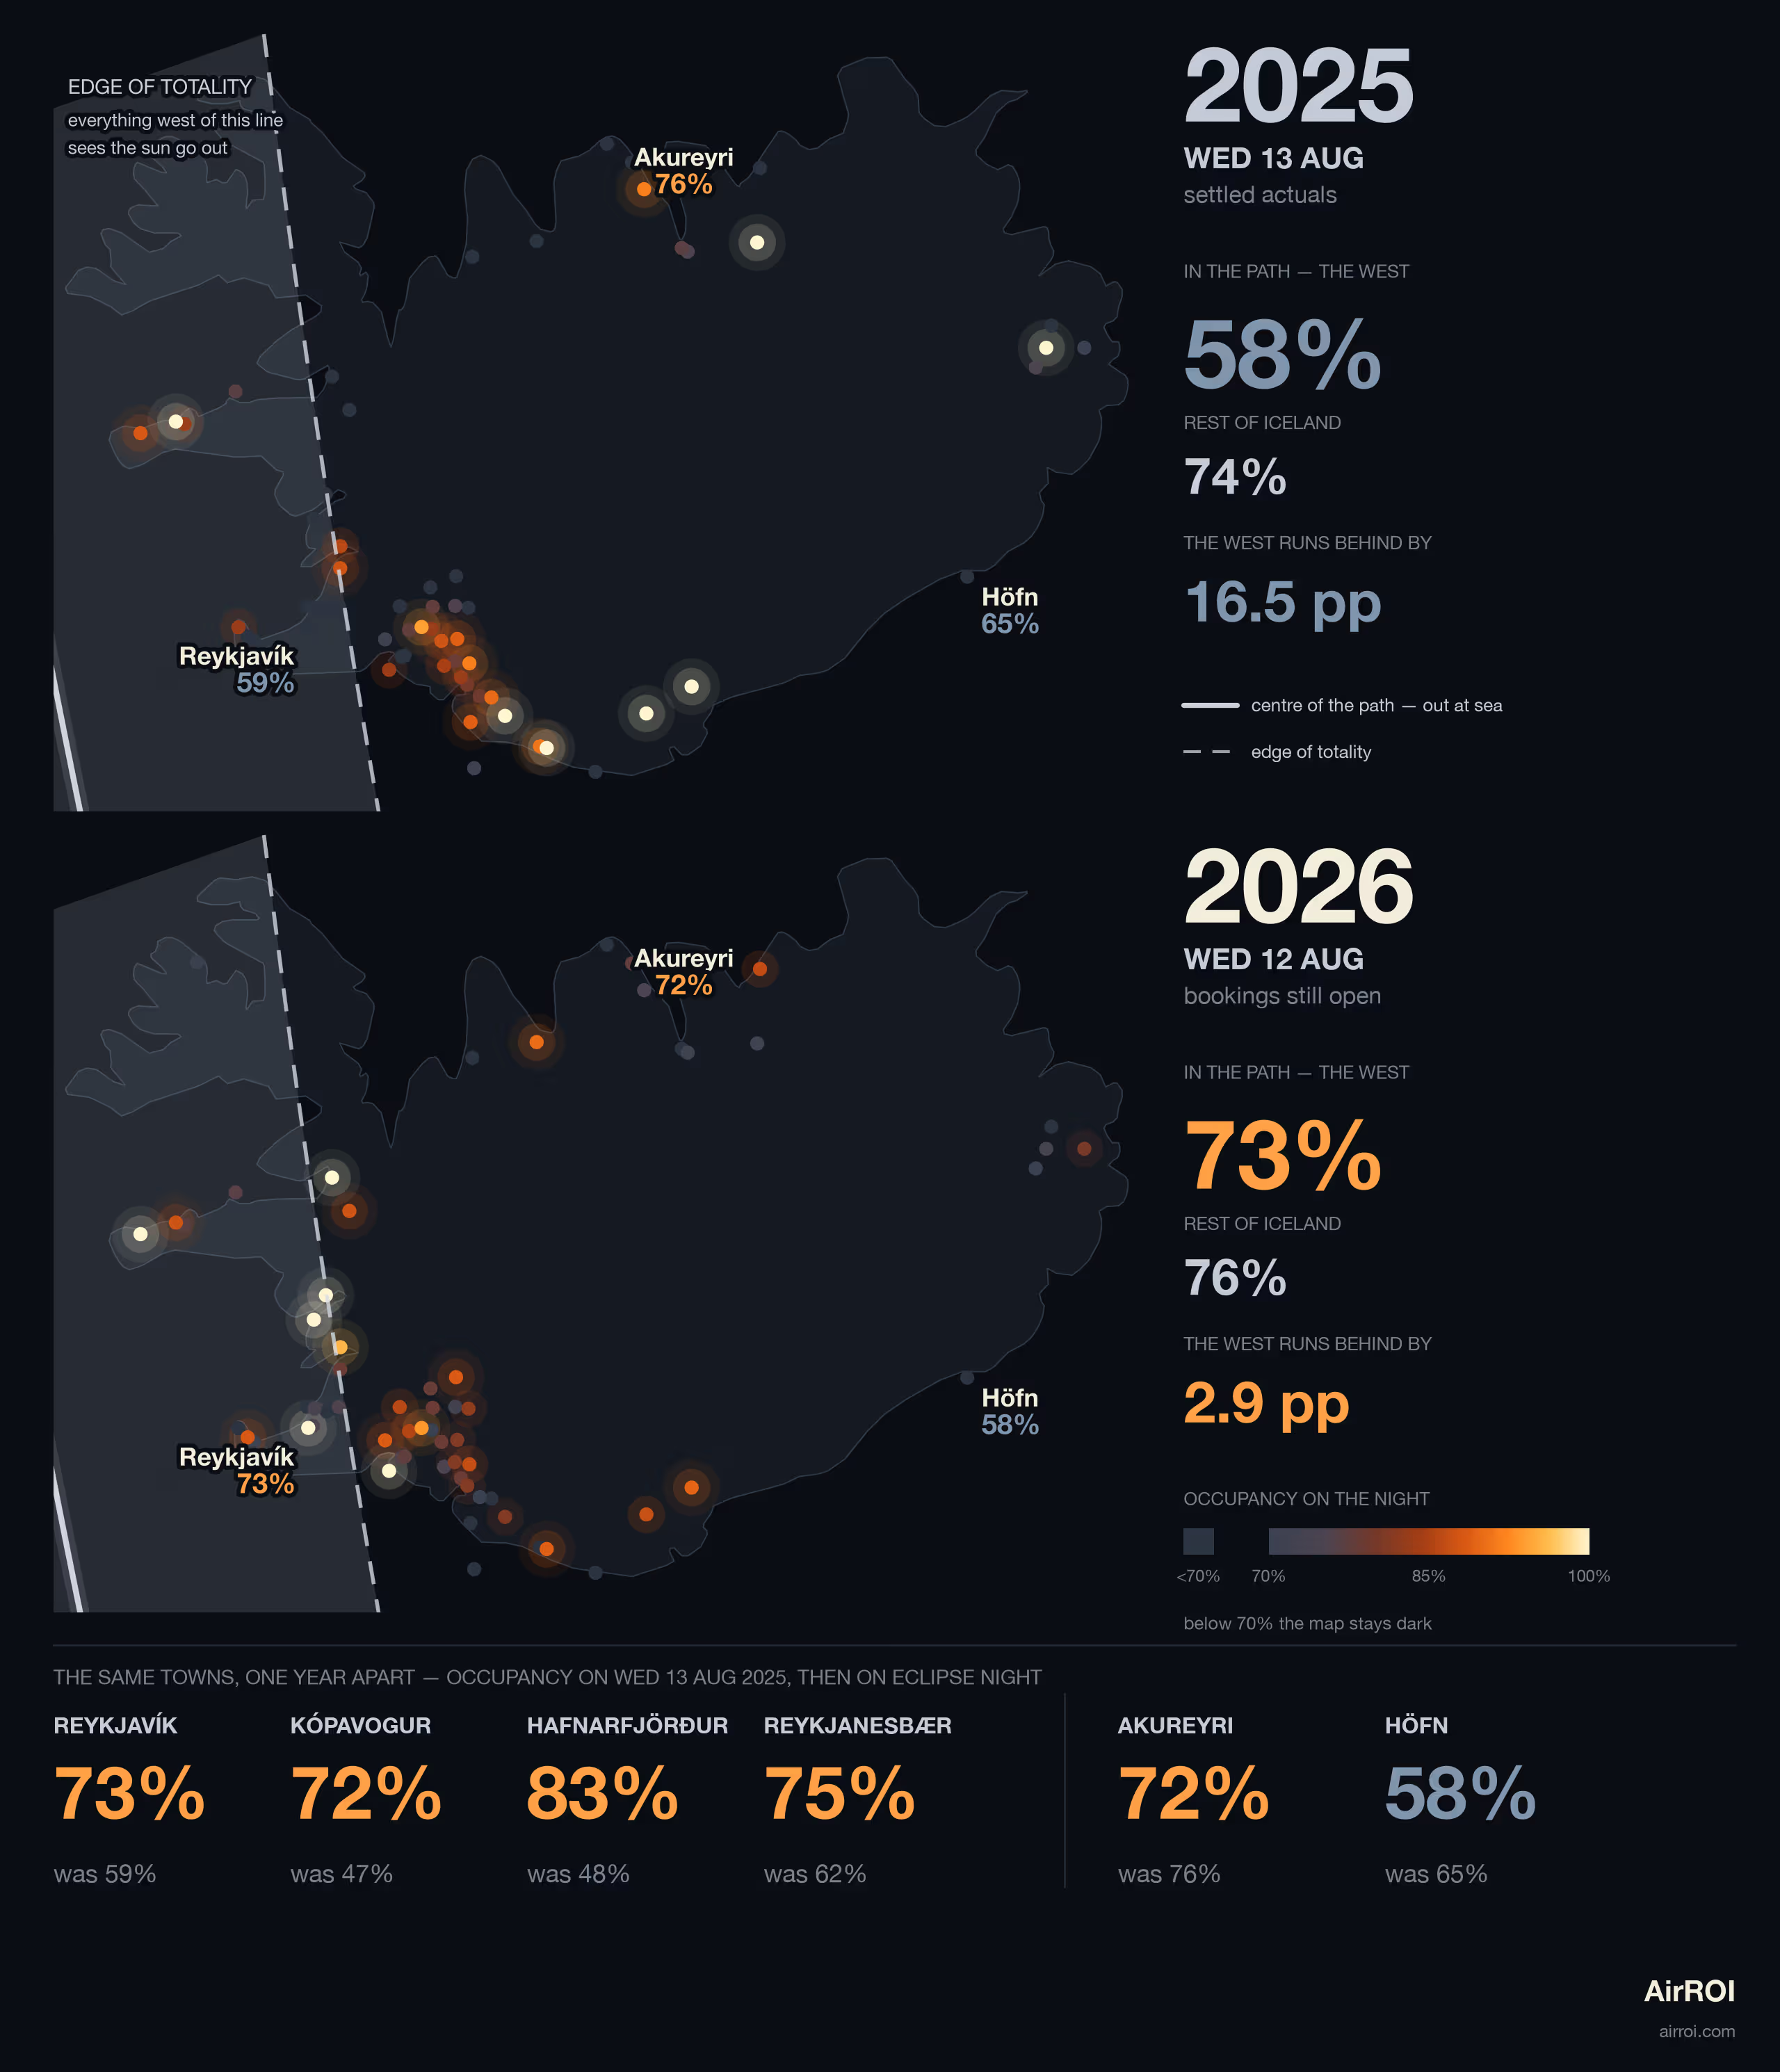
The eclipse crosses western Iceland before reaching Spain — totality arrives roughly forty minutes before the Spanish landfall. AirROI's analysis shows a real but differently shaped effect: the in-path west normally trails the rest of the island by about 17 points in August, and on eclipse night that deficit nearly vanishes.
Unlike Spain, where the eclipse creates a glowing band through empty interior, Iceland's in-path region — the western half, including the capital region — is the quieter half in August. The busy north and east (Akureyri, the Ring Road circuit) normally run well above Reykjavík's occupancy. The eclipse does not reverse that hierarchy; it narrows it.
| Wed 13 Aug 2025 | Wed 12 Aug 2026 | |
|---|---|---|
| In the path (the west) | 58% | 73% |
| Rest of Iceland | 74% | 76% |
| West's deficit | 16.5 pp | 2.9 pp |
The deficit was 18.2 pp on 6 August 2025 and 16.5 pp on 13 August 2025 — flat, week to week. On eclipse night: 2.9 pp.
| City | Aug 2025 | Eclipse night 2026 | Position |
|---|---|---|---|
| Reykjavík | 59% | 73% | Inside the path |
| Kópavogur | 47% | 72% | Inside the path |
| Hafnarfjörður | 48% | 83% | Inside the path |
| Akureyri | 76% | 72% | Outside the path |
| Höfn | 65% | 58% | Outside the path |
The west fills. The north and east empty. Over a market one-fiftieth the size of Spain's, the same geometry — NASA's path table — separates the movers from the non-movers.
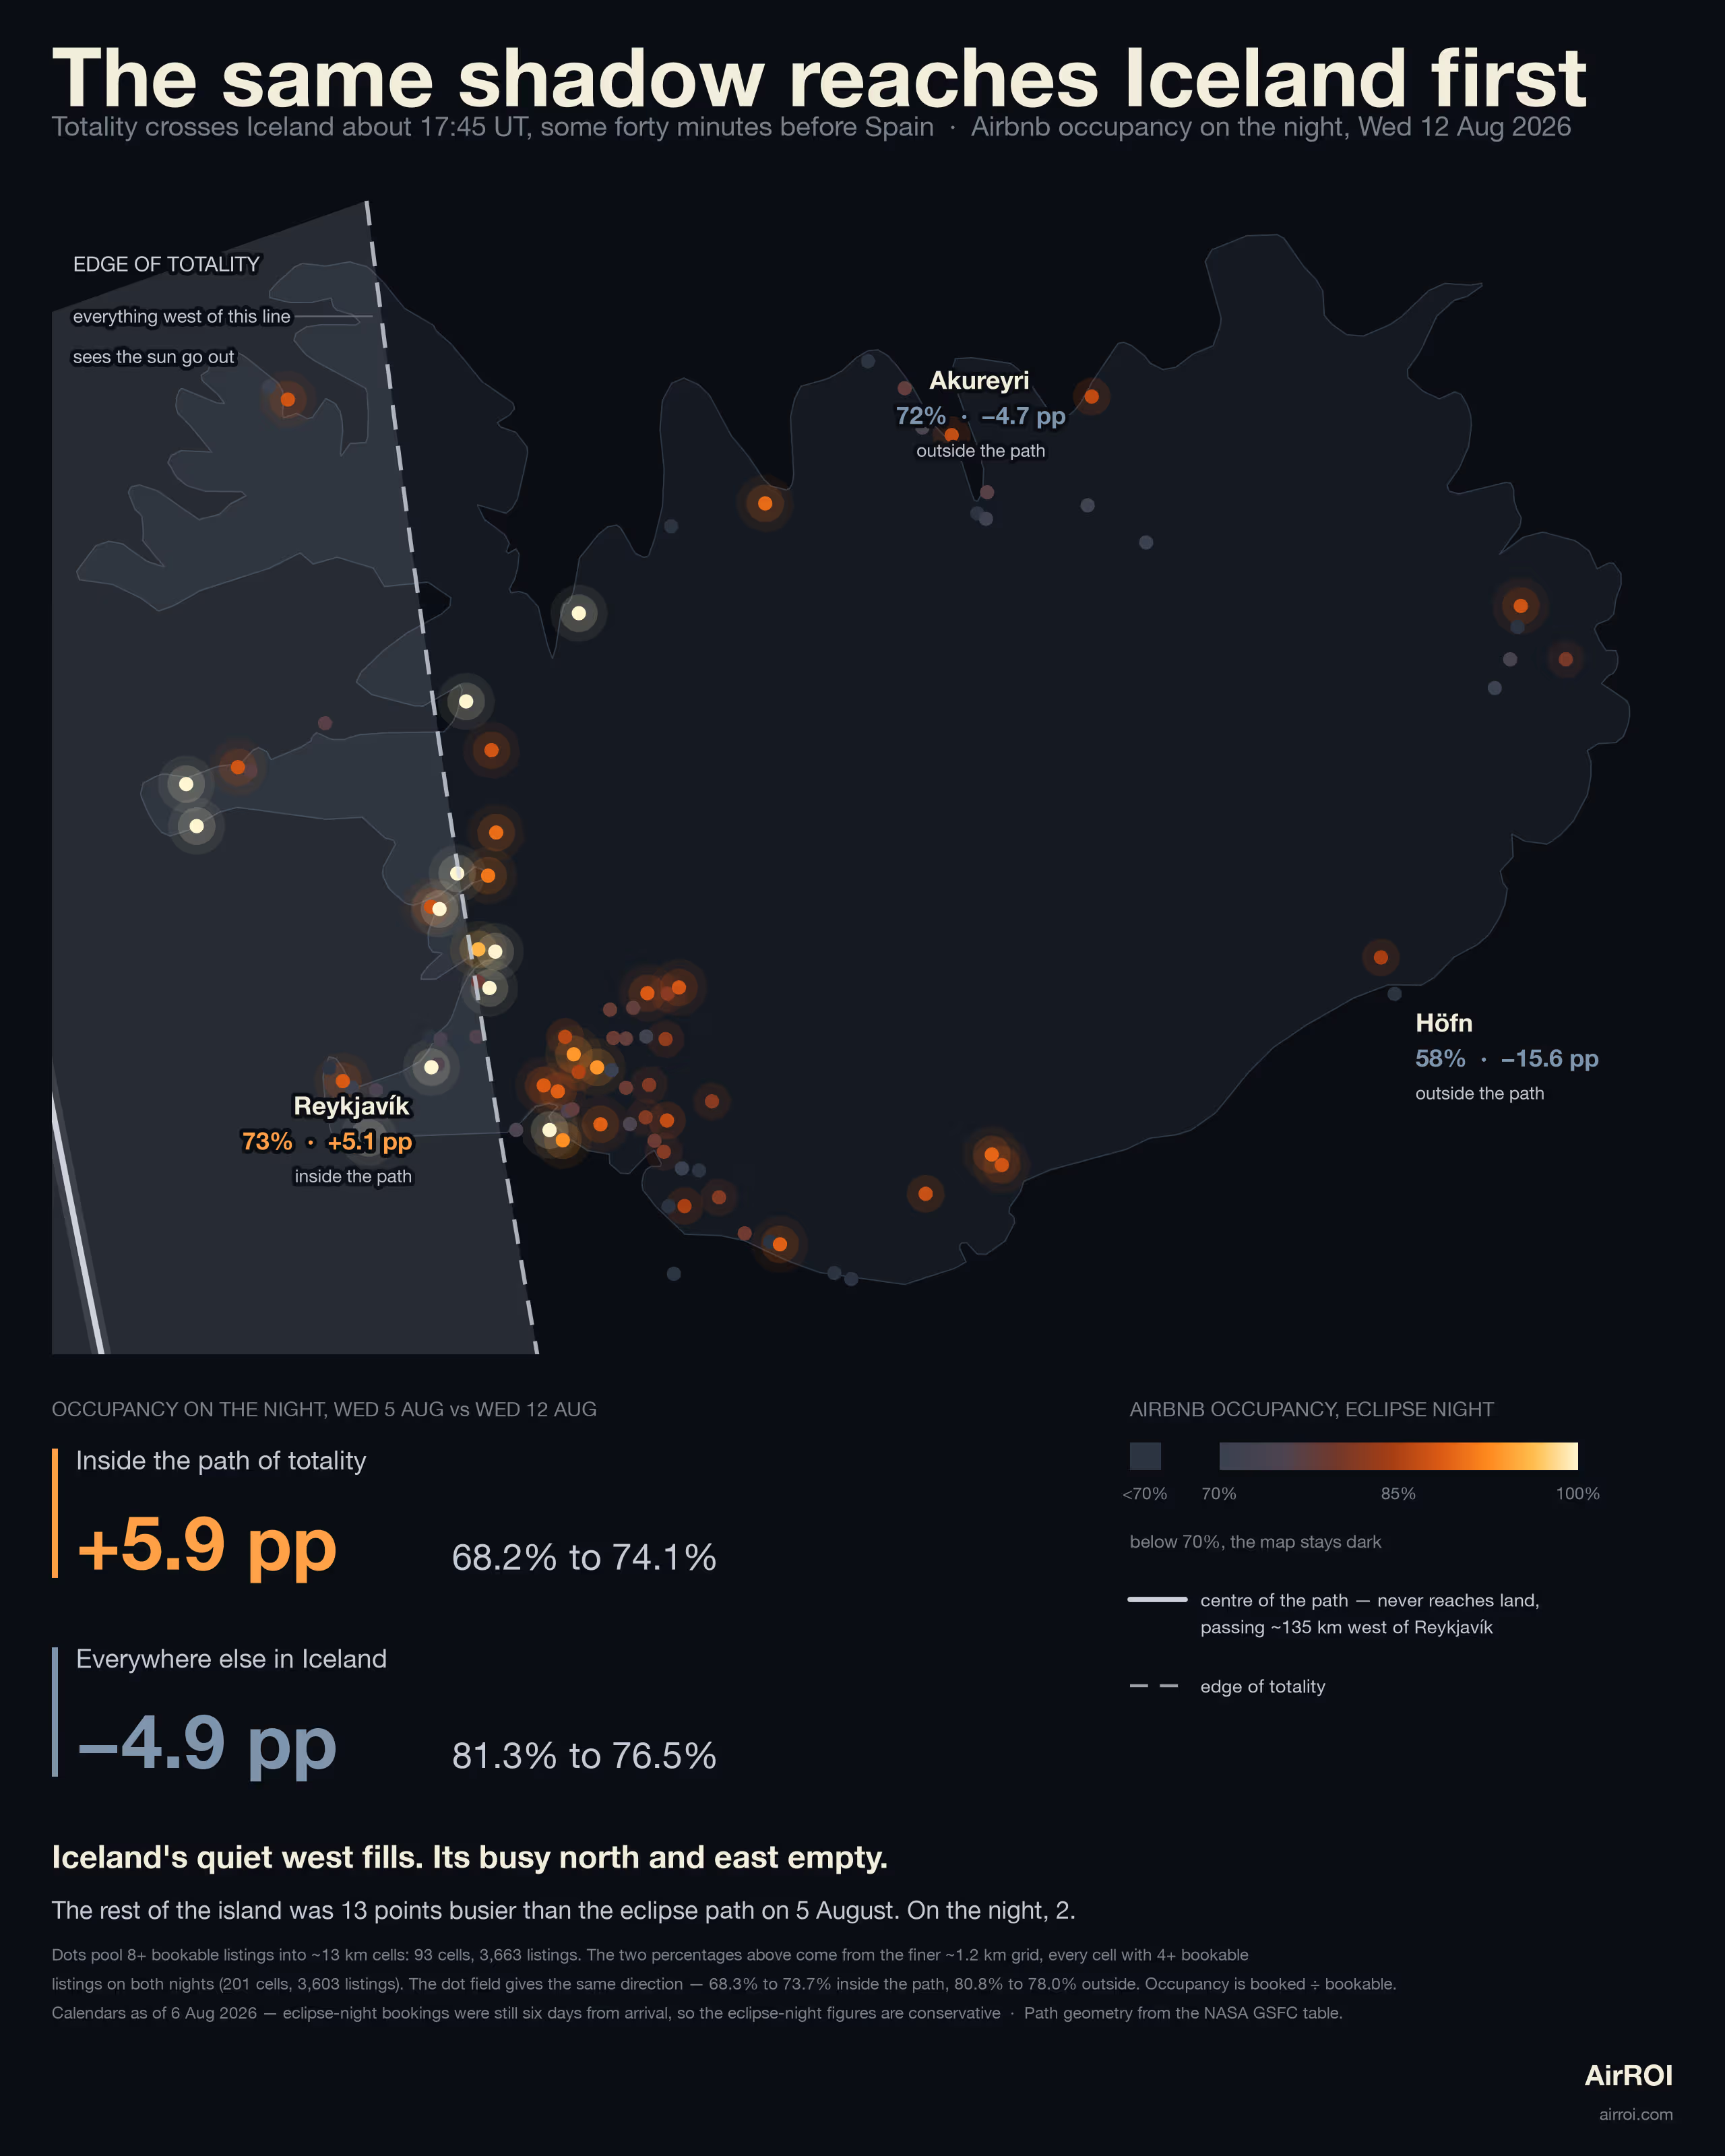
One geometric note worth knowing: over Iceland the umbra runs nearly north–south, so the "edge of totality" is functionally a vertical line through the highlands. Everything west of it sees the sun go out. The centre line never touches Icelandic land — it passes roughly 135 km west of Reykjavík, out at sea. The year-over-year comparison makes the deficit collapse visible — same cells, same positions, only the values change:
What the eclipse data tells hosts and investors
Eclipse demand is a textbook inelastic event: the timing is fixed years in advance by orbital mechanics, the geography is non-negotiable, the audience will pay to be in the right place, and there is no substitute. The 2024 US eclipse showed the same pattern; the 2026 Spain and Iceland data confirms it is structural, not a one-country fluke. For hosts and investors, the signal carries three operational implications.
The next total solar eclipse visible from Europe will cross North Africa, Gibraltar, and southern Spain on 2 August 2027 — a narrow coastal track with far higher baseline occupancy and far less headroom than the 2026 interior-Spain corridor. Whether that event generates a visible booking spike or simply maxes out an already-full coast is a question worth returning to with data when the time comes. We will be watching.
How we measured this
Data source. AirROI's listing-level Airbnb database across Spain, Portugal, France, Iceland, and Andorra. Occupancy is booked nights divided by bookable nights (host-blocked excluded), pooled across listings within each geographic cell.
Path geometry. NASA GSFC eclipse path table (Espenak/Meeus), validated against 12 known cities including Valencia (inside), Palma (inside, totality at sunset), and Madrid and Barcelona (outside).
Frequently Asked Questions
The August 2026 eclipse increased Airbnb occupancy inside the path of totality by 7.8 percentage points in Spain over a single week, from 82% to 89%, while the rest of Spain fell from 75% to 73%. Year-over-year on the same Wednesday, corridor towns like Logroño went from 49% to 97%. The effect decayed predictably with distance: +10.1 points at 50–100 km from the centre line, +7.0 at 100–150 km, and negative by 150–200 km.
Interior towns on the path of totality saw the largest year-over-year gains. Logroño went from 49% to 97% occupancy, Zaragoza from 45% to 92%, Burgos from 49% to 92%, Cuenca from 31% to 91%, and Valladolid from 43% to 87%. These are towns that normally sit at 40–50% on an August Wednesday — the eclipse filled them to levels the Spanish coast rarely reaches.
Yes. Among markets that gained 8 or more points of occupancy, Spanish path-of-totality markets raised rates by a median of 6.7%, with 74% of them increasing price. Burgos rates rose 40%, León 38%, and Logroño 33%. By contrast, French markets that also filled up for the 15 August holiday discounted by a median of 1.5%, with only 34% raising price — the opposite price signal on the same occupancy move.
Yes, though the pattern is a mirror image of Spain. Iceland's in-path west normally trails the rest of the island by about 17 points in August — 58% vs 74% on the same Wednesday last year. On eclipse night the deficit shrank to 2.9 points (73% vs 76%). Reykjavík went from 59% to 73% year-over-year. The effect is real but subtler: the west filled up rather than the east emptying, closing a structural gap rather than creating a visible spike.