College Football Airbnb Markets 2026: 16 Towns Ranked by Game-Day Premium

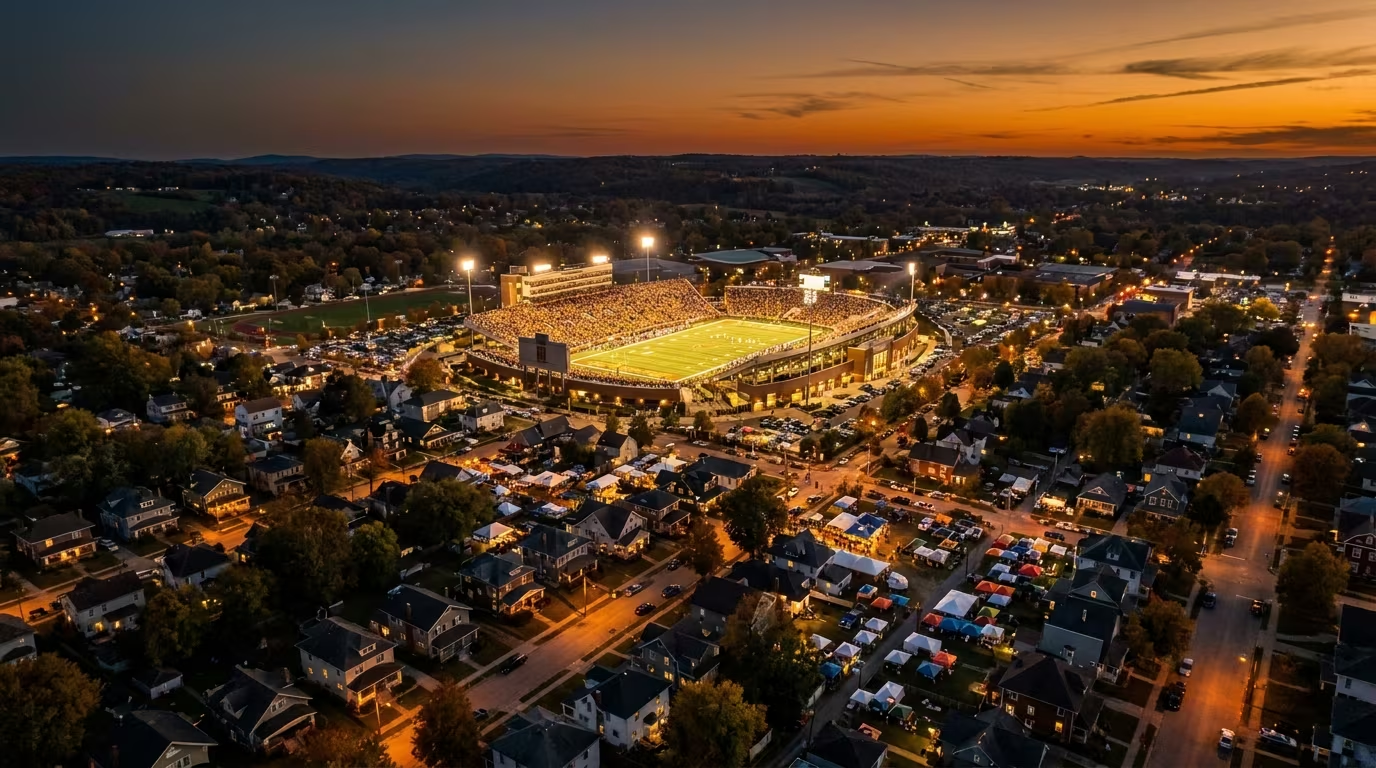
Across the 16 college football Airbnb markets AirROI tracks, a fall game-day Saturday commands 2.3x to 5.1x the off-season nightly rate — and the market that tops the ranking is not in the SEC. Ann Arbor, home of Big Ten Michigan and its 107,601-seat stadium, leads at 5.1x, ahead of Gainesville (4.0x), Athens (3.9x), and Tuscaloosa (3.7x). If you are looking for the best Airbnb markets college football season creates, that ranking is the headline: game day is a rate event, and the biggest rate events are not where most people assume.
The reason the ranking matters so much is concentration. In a college town, the calendar is not twelve months of steady demand — it is roughly six home Saturdays that carry the year. A peer-reviewed study from the UC San Diego Rady School of Management found that hosts in college towns earn about 60% of their August-through-December income on those six home-game weekends. One marquee weekend can out-earn a full week of peak summer.
This article ranks all 16 markets by AirROI's game-weekend premium multiple, explains what actually drives the premium, and lays out a data-grounded framework for pricing the fall 2026 schedule. Every number here comes from AirROI's trailing-12-month market data, pulled 2026-07-15, or from the cited sources.
The 16 college football Airbnb markets, ranked by game-day premium
Here is the ranking. Ann Arbor tops it at 5.1x, followed by Gainesville (4.0x), Athens (3.9x), Tuscaloosa (3.7x), and a tie at 3.6x between Oxford and State College. The top six are three SEC markets and three Big Ten markets — the "SEC owns game-day short-term rental demand" assumption does not survive contact with the data.
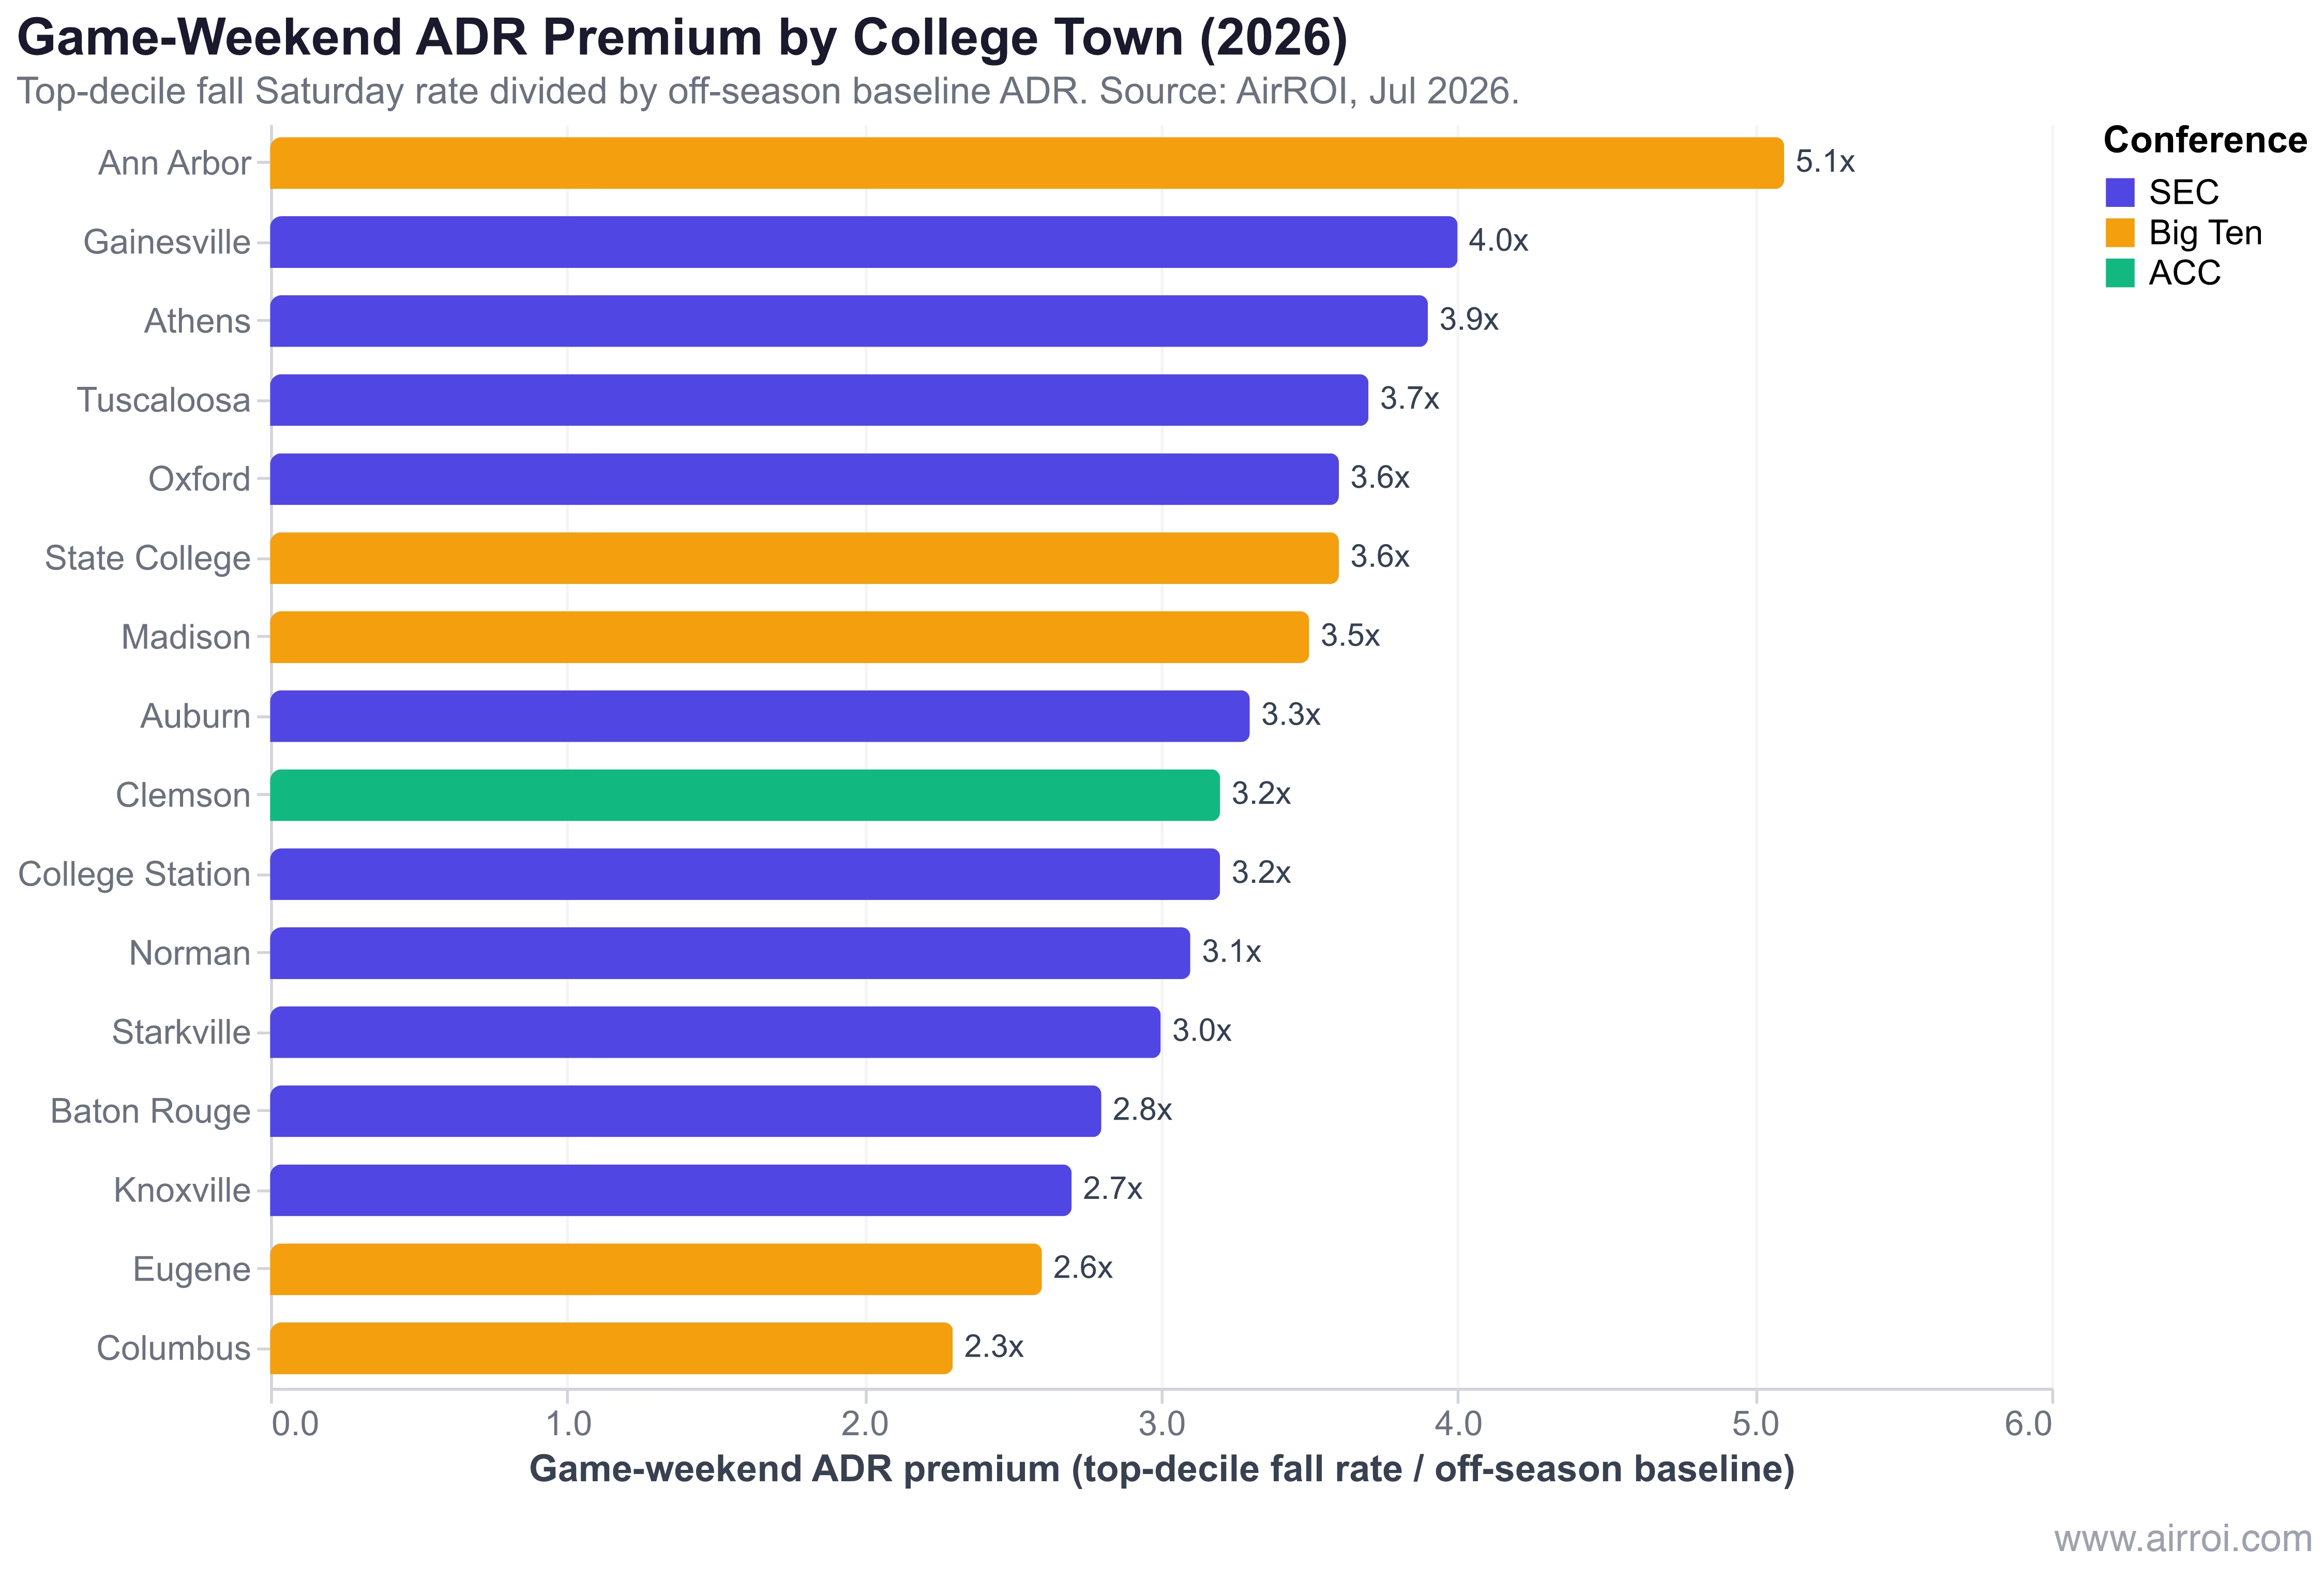
The metric is deliberately plain: the game-weekend premium multiple is the top-decile fall Saturday rate — the 90th-percentile nightly ADR in the peak football month (September through November) — divided by the off-season baseline ADR, which is the lowest monthly average in January through April. It is a market-wide, conservative proxy for what a well-priced listing captures on a game Saturday versus the market's off-season floor, not a cherry-picked hero listing. The full table shows the underlying rates.
| Rank | Town (Team) | Off-season ADR (month) | Peak FB month ADR avg (month) | Peak FB month p90 ADR | Seasonal ratio (peakAvg/off) | Game-weekend premium (p90/off) |
|---|---|---|---|---|---|---|
| 1 | Ann Arbor (Michigan) | $263 (Jan) | $555 (Oct) | $1,331 | 2.11x | 5.1x |
| 2 | Gainesville (Florida) | $178 (Jan) | $332 (Nov) | $712 | 1.86x | 4.0x |
| 3 | Athens (Georgia) | $255 (Jan) | $450 (Sep) | $1,002 | 1.76x | 3.9x |
| 4 | Tuscaloosa (Alabama) | $333 (Jan) | $644 (Oct) | $1,218 | 1.94x | 3.7x |
| 5 | Oxford (Ole Miss) | $378 (Feb) | $695 (Nov) | $1,370 | 1.84x | 3.6x |
| 6 | State College (Penn State) | $440 (Feb) | $740 (Nov) | $1,560 | 1.68x | 3.6x |
| 7 | Madison (Wisconsin) | $184 (Jan) | $269 (Sep) | $643 | 1.47x | 3.5x |
| 8 | Auburn (Auburn) | $252 (Jan) | $462 (Oct) | $830 | 1.84x | 3.3x |
| 9 | Clemson (Clemson) | $312 (Jan) | $478 (Oct) | $990 | 1.53x | 3.2x |
| 10 | College Station (Texas A&M) | $228 (Jan) | $387 (Oct) | $720 | 1.70x | 3.2x |
| 11 | Norman (Oklahoma) | $207 (Jan) | $338 (Nov) | $638 | 1.63x | 3.1x |
| 12 | Starkville (Miss State) | $188 (Jan) | $311 (Nov) | $572 | 1.65x | 3.0x |
| 13 | Baton Rouge (LSU) | $170 (Jan) | $255 (Oct) | $467 | 1.50x | 2.8x |
| 14 | Knoxville (Tennessee) | $196 (Jan) | $271 (Oct) | $533 | 1.38x | 2.7x |
| 15 | Eugene (Oregon) | $216 (Jan) | $280 (Oct) | $559 | 1.30x | 2.6x |
| 16 | Columbus (Ohio State) | $174 (Jan) | $210 (Oct) | $397 | 1.21x | 2.3x |
Notice the gap between the two right-hand columns. The seasonal ratio — peak-month average over off-season — tops out near 2.1x, because monthly averages blend soft weekdays and cupcake games into the six Saturdays that matter. The p90 premium runs far higher because it isolates the rate a listing commands on the actual game weekend. In Ann Arbor, the off-season floor is $263 and the peak-month 90th-percentile rate is $1,331: that is the 5.1x.
Premium multiple vs. absolute dollars
The premium multiple rewards a low off-season baseline. A market can post a high multiple simply because its January floor is cheap, which is why some SEC towns with modest baselines rank near the top. Absolute dollars tell a different story, and the town that wins on dollars is State College.
Penn State's State College posts the highest trailing-12-month RevPAR in the set at $222, the highest ADR at $584, and $46,798 in revenue per active listing — on just 238 active listings against Beaver Stadium's 106,304 seats. That is the payoff of the thinnest supply among blue-blood programs meeting enormous, sold-out demand. Its 3.6x premium is mid-pack, but its earning yield is the best in the ranking.
| Rank by premium | Team / Town | Conf | TTM Occ | TTM ADR | TTM RevPAR | TTM Rev/listing | Booking lead (days) | Avg min-nights | Active listings |
|---|---|---|---|---|---|---|---|---|---|
| 1 | Michigan — Ann Arbor MI | Big Ten | 42% | $424 | $163.5 | $36,708 | 62 | 11.7 | 544 |
| 2 | Florida — Gainesville FL | SEC | 39% | $253 | $94.9 | $23,389 | 54 | 3.4 | 1,005 |
| 3 | Georgia — Athens GA | SEC | 39% | $366 | $128.5 | $34,271 | 75 | 3.1 | 660 |
| 4 | Alabama — Tuscaloosa AL | SEC | 25% | $499 | $115.1 | $23,846 | 86 | 2.3 | 420 |
| 5 | Ole Miss — Oxford MS | SEC | 29% | $538 | $134.9 | $26,783 | 69 | 2.3 | 1,049 |
| 6 | Penn State — State College PA | Big Ten | 37% | $584 | $222.0 | $46,798 | 76 | 3.1 | 238 |
| 7 | Wisconsin — Madison WI | Big Ten | 49% | $246 | $121.5 | $24,362 | 62 | 15.7 | 303 |
| 8 | Auburn — Auburn AL | SEC | 31% | $352 | $101.1 | $23,472 | 66 | 2.3 | 433 |
| 9 | Clemson — Clemson SC | ACC | 30% | $434 | $128.9 | $27,197 | 97 | 2.5 | 150 |
| 10 | Texas A&M — College Station TX | SEC | 32% | $320 | $94.4 | $21,861 | 53 | 4.2 | 622 |
| 11 | Oklahoma — Norman OK | SEC | 37% | $271 | $91.1 | $22,448 | 55 | 2.5 | 434 |
| 12 | Miss State — Starkville MS | SEC | 33% | $266 | $83.3 | $18,304 | 56 | 1.7 | 412 |
| 13 | LSU — Baton Rouge LA | SEC | 37% | $213 | $76.1 | $16,996 | 39 | 3.2 | 741 |
| 14 | Tennessee — Knoxville TN | SEC | 46% | $240 | $106.9 | $26,703 | 48 | 6.5 | 1,089 |
| 15 | Oregon — Eugene OR | Big Ten | 42% | $269 | $103.5 | $25,070 | 54 | 3.1 | 1,354 |
| 16 | Ohio State — Columbus OH | Big Ten | 45% | $213 | $95.1 | $22,675 | 42 | 9.6 | 2,563 |
Read the two tables together and the pattern is clear. The multiple rewards markets with cheap off-season floors; absolute RevPAR rewards thin-supply blue bloods where a huge, sold-out stadium meets very few listings. State College, Ann Arbor, Oxford, and Clemson cluster at the top on dollars. The rest of this article is about why.
Why a football Saturday out-earns a summer week (rate, not occupancy)
The single most important fact about these markets is that the premium is a rate phenomenon, not an occupancy phenomenon. Filling more nights is not the play. Capturing multiplied rates on the six Saturdays that matter is.
Tuscaloosa makes the point cleanly. Alabama's market posts a trailing-12-month ADR of $499 at just 25% occupancy — an extreme nightly rate against a thin calendar. If you assumed high rates required high occupancy, that number would look impossible. It is not: the rate spikes on a handful of Saturdays and the rest of the calendar sits soft.
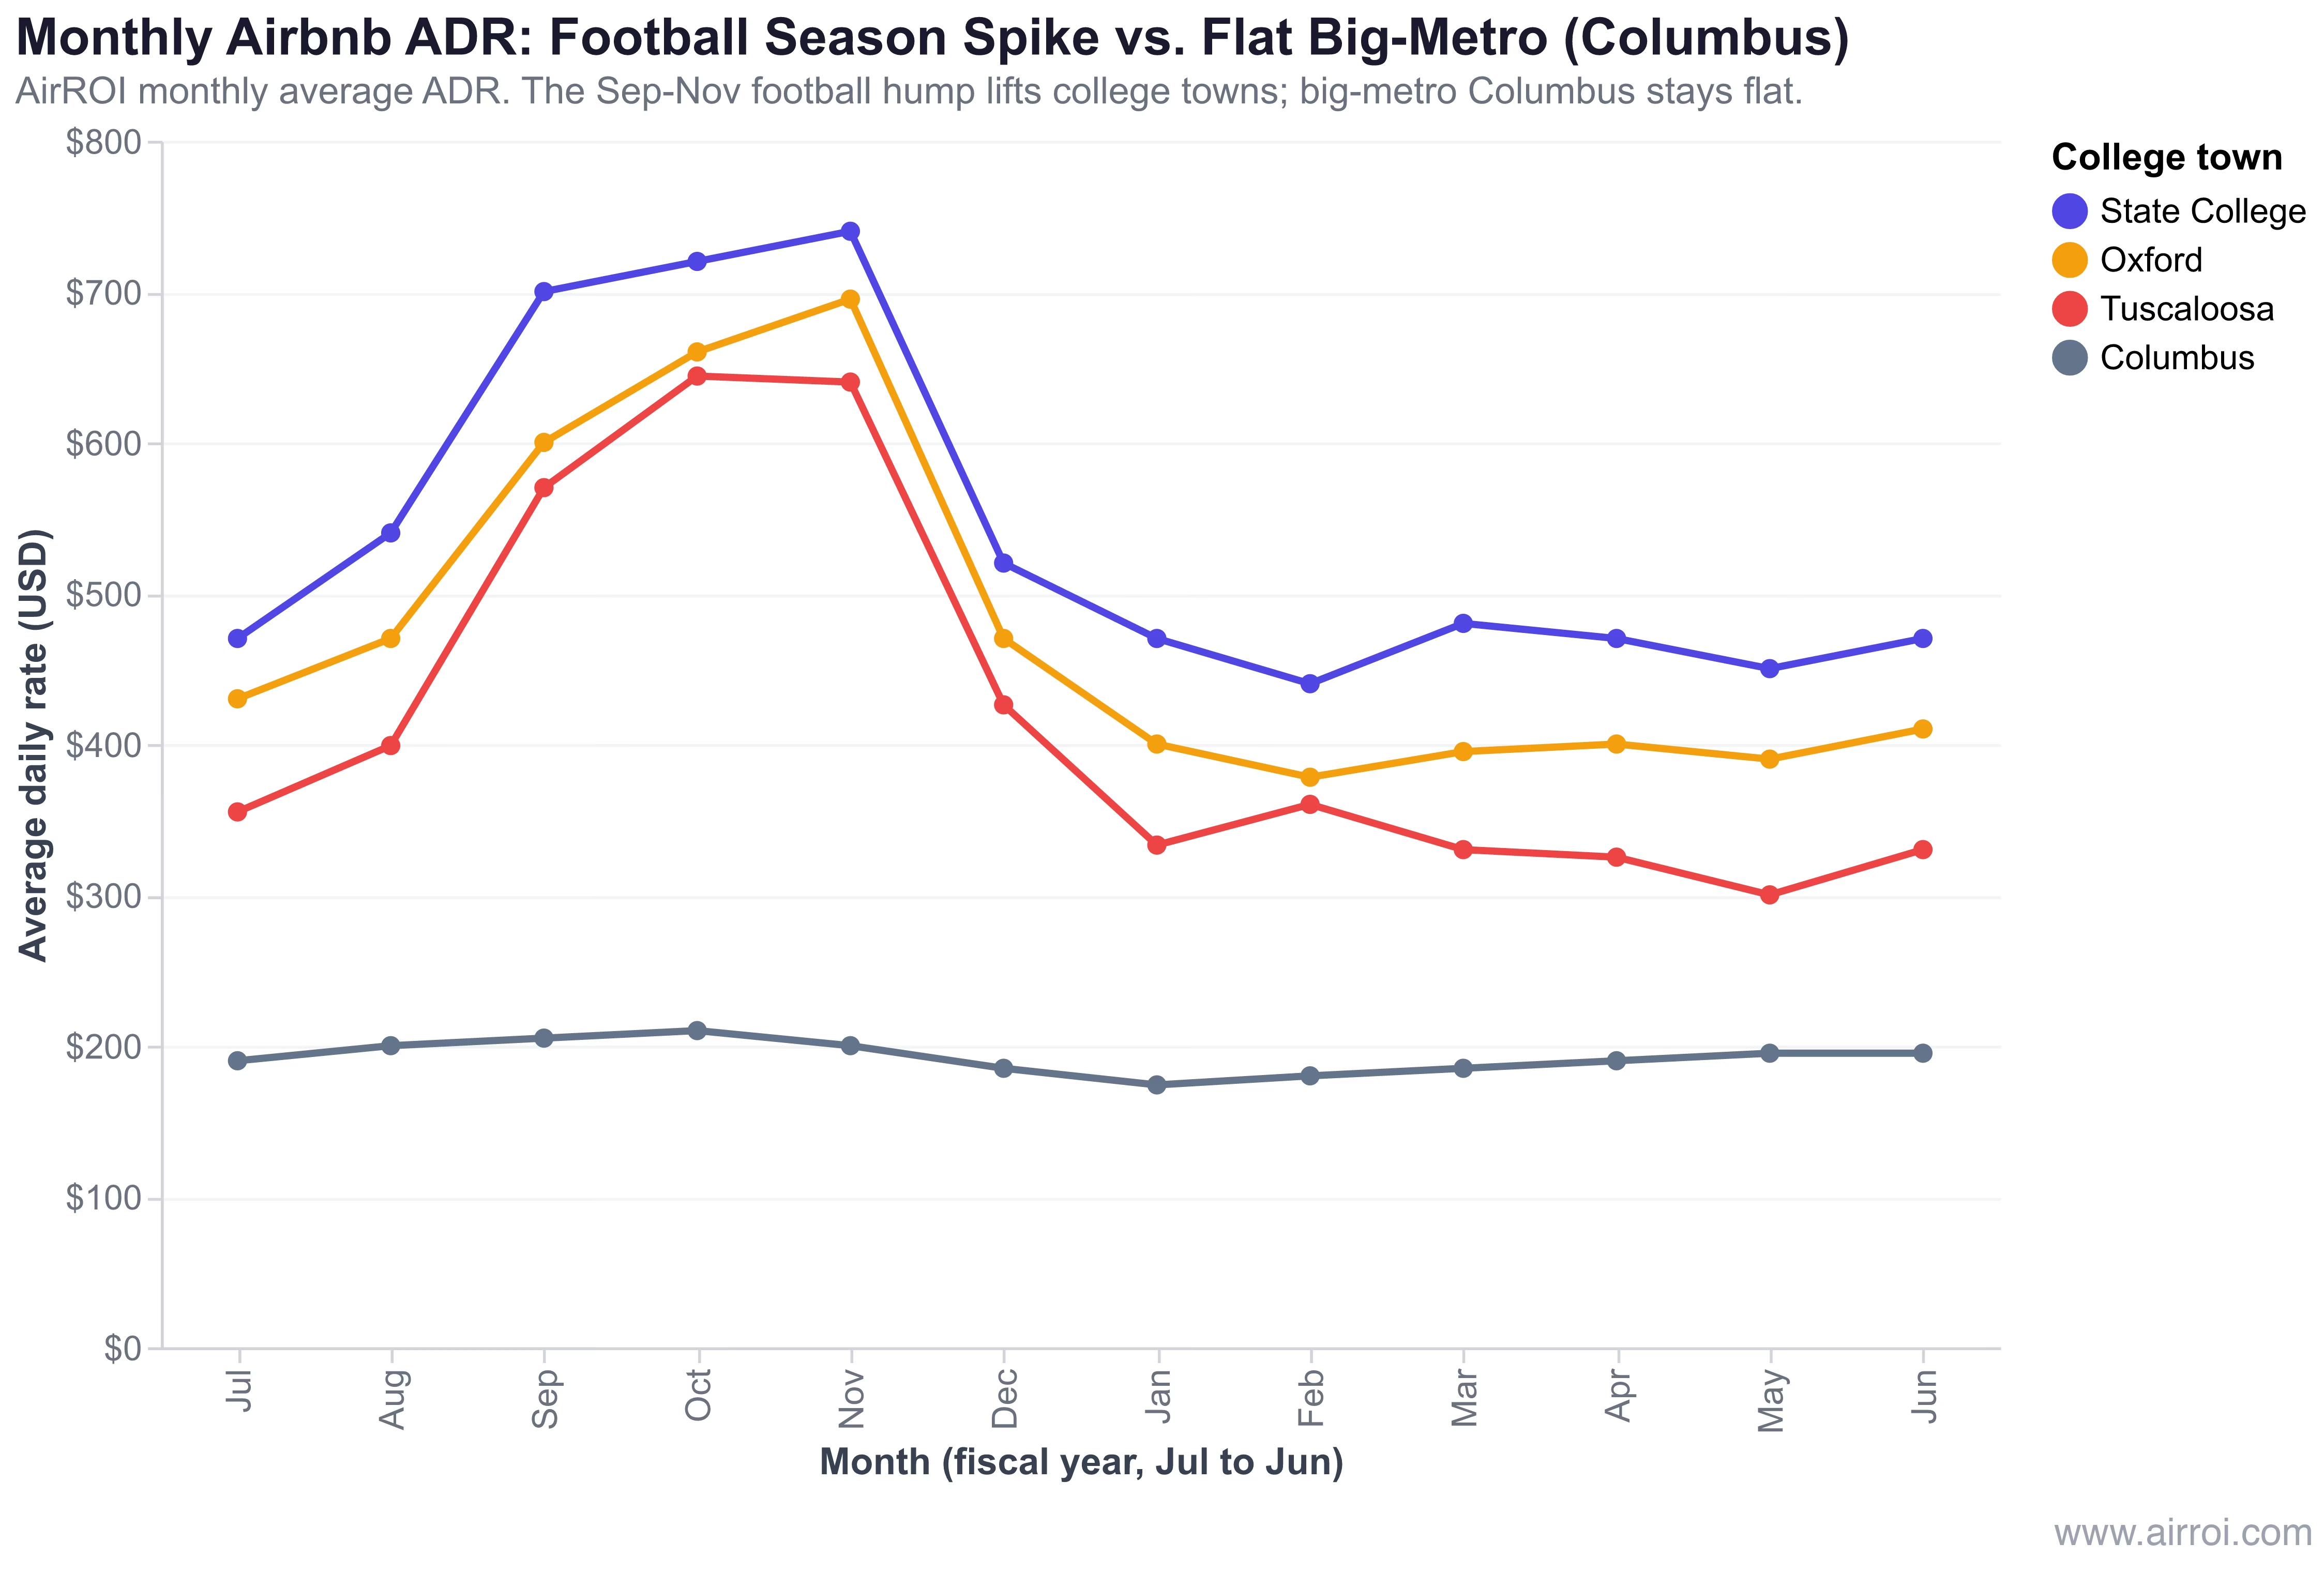
Look at what does and does not move between fall and off-season. In Tuscaloosa, monthly occupancy barely rises — 27% in fall versus 25% off-season, a two-point move. Monthly ADR, by contrast, nearly doubles: $644 in October versus $333 in January, with an October 90th-percentile rate of $1,218. The chart above traces the same Sep–Nov hump across Tuscaloosa, Oxford, and State College, while big-metro Columbus stays flat all year — the contrast that the rest of this article explains.
The mechanism is straightforward. On the six or so home-game weekends, listings run near-full at a rate multiplied three to five times over. On the thirty-odd other weekends, both rate and occupancy are ordinary. Average the two together across a month and occupancy looks unremarkable, because the six explosive Saturdays are diluted by everything around them. The money is concentrated, not spread.
Hosts on the ground describe the same math in plainer terms. One host in a viral r/CFB thread put the concentration this way:
"Rented my house out in Tuscaloosa and made 1/2 my mortgage. And I only rented it out game-day weekends."
That is not an outlier claim; it is the model working as designed. Near marquee programs the dollars scale further. A host renting near Notre Dame Stadium told Business Insider that two-night game stays gross $3,500–$3,800, and the biggest home game of the season can reach $5,000 — for a single weekend. Tie that back to the UCSD finding and the picture is complete: roughly 60% of the fall's income lands on about six weekends, and a single marquee Saturday can out-earn a peak-summer week.
What drives the game-day premium (supply, not just the SEC)
If the premium is a rate event, the next question is what makes the rate explode in some towns and stay tame in others. The answer is not conference and it is not stadium size. The biggest premiums cluster where short-term-rental supply is thinnest relative to stadium capacity. Supply thinness is the top driver.
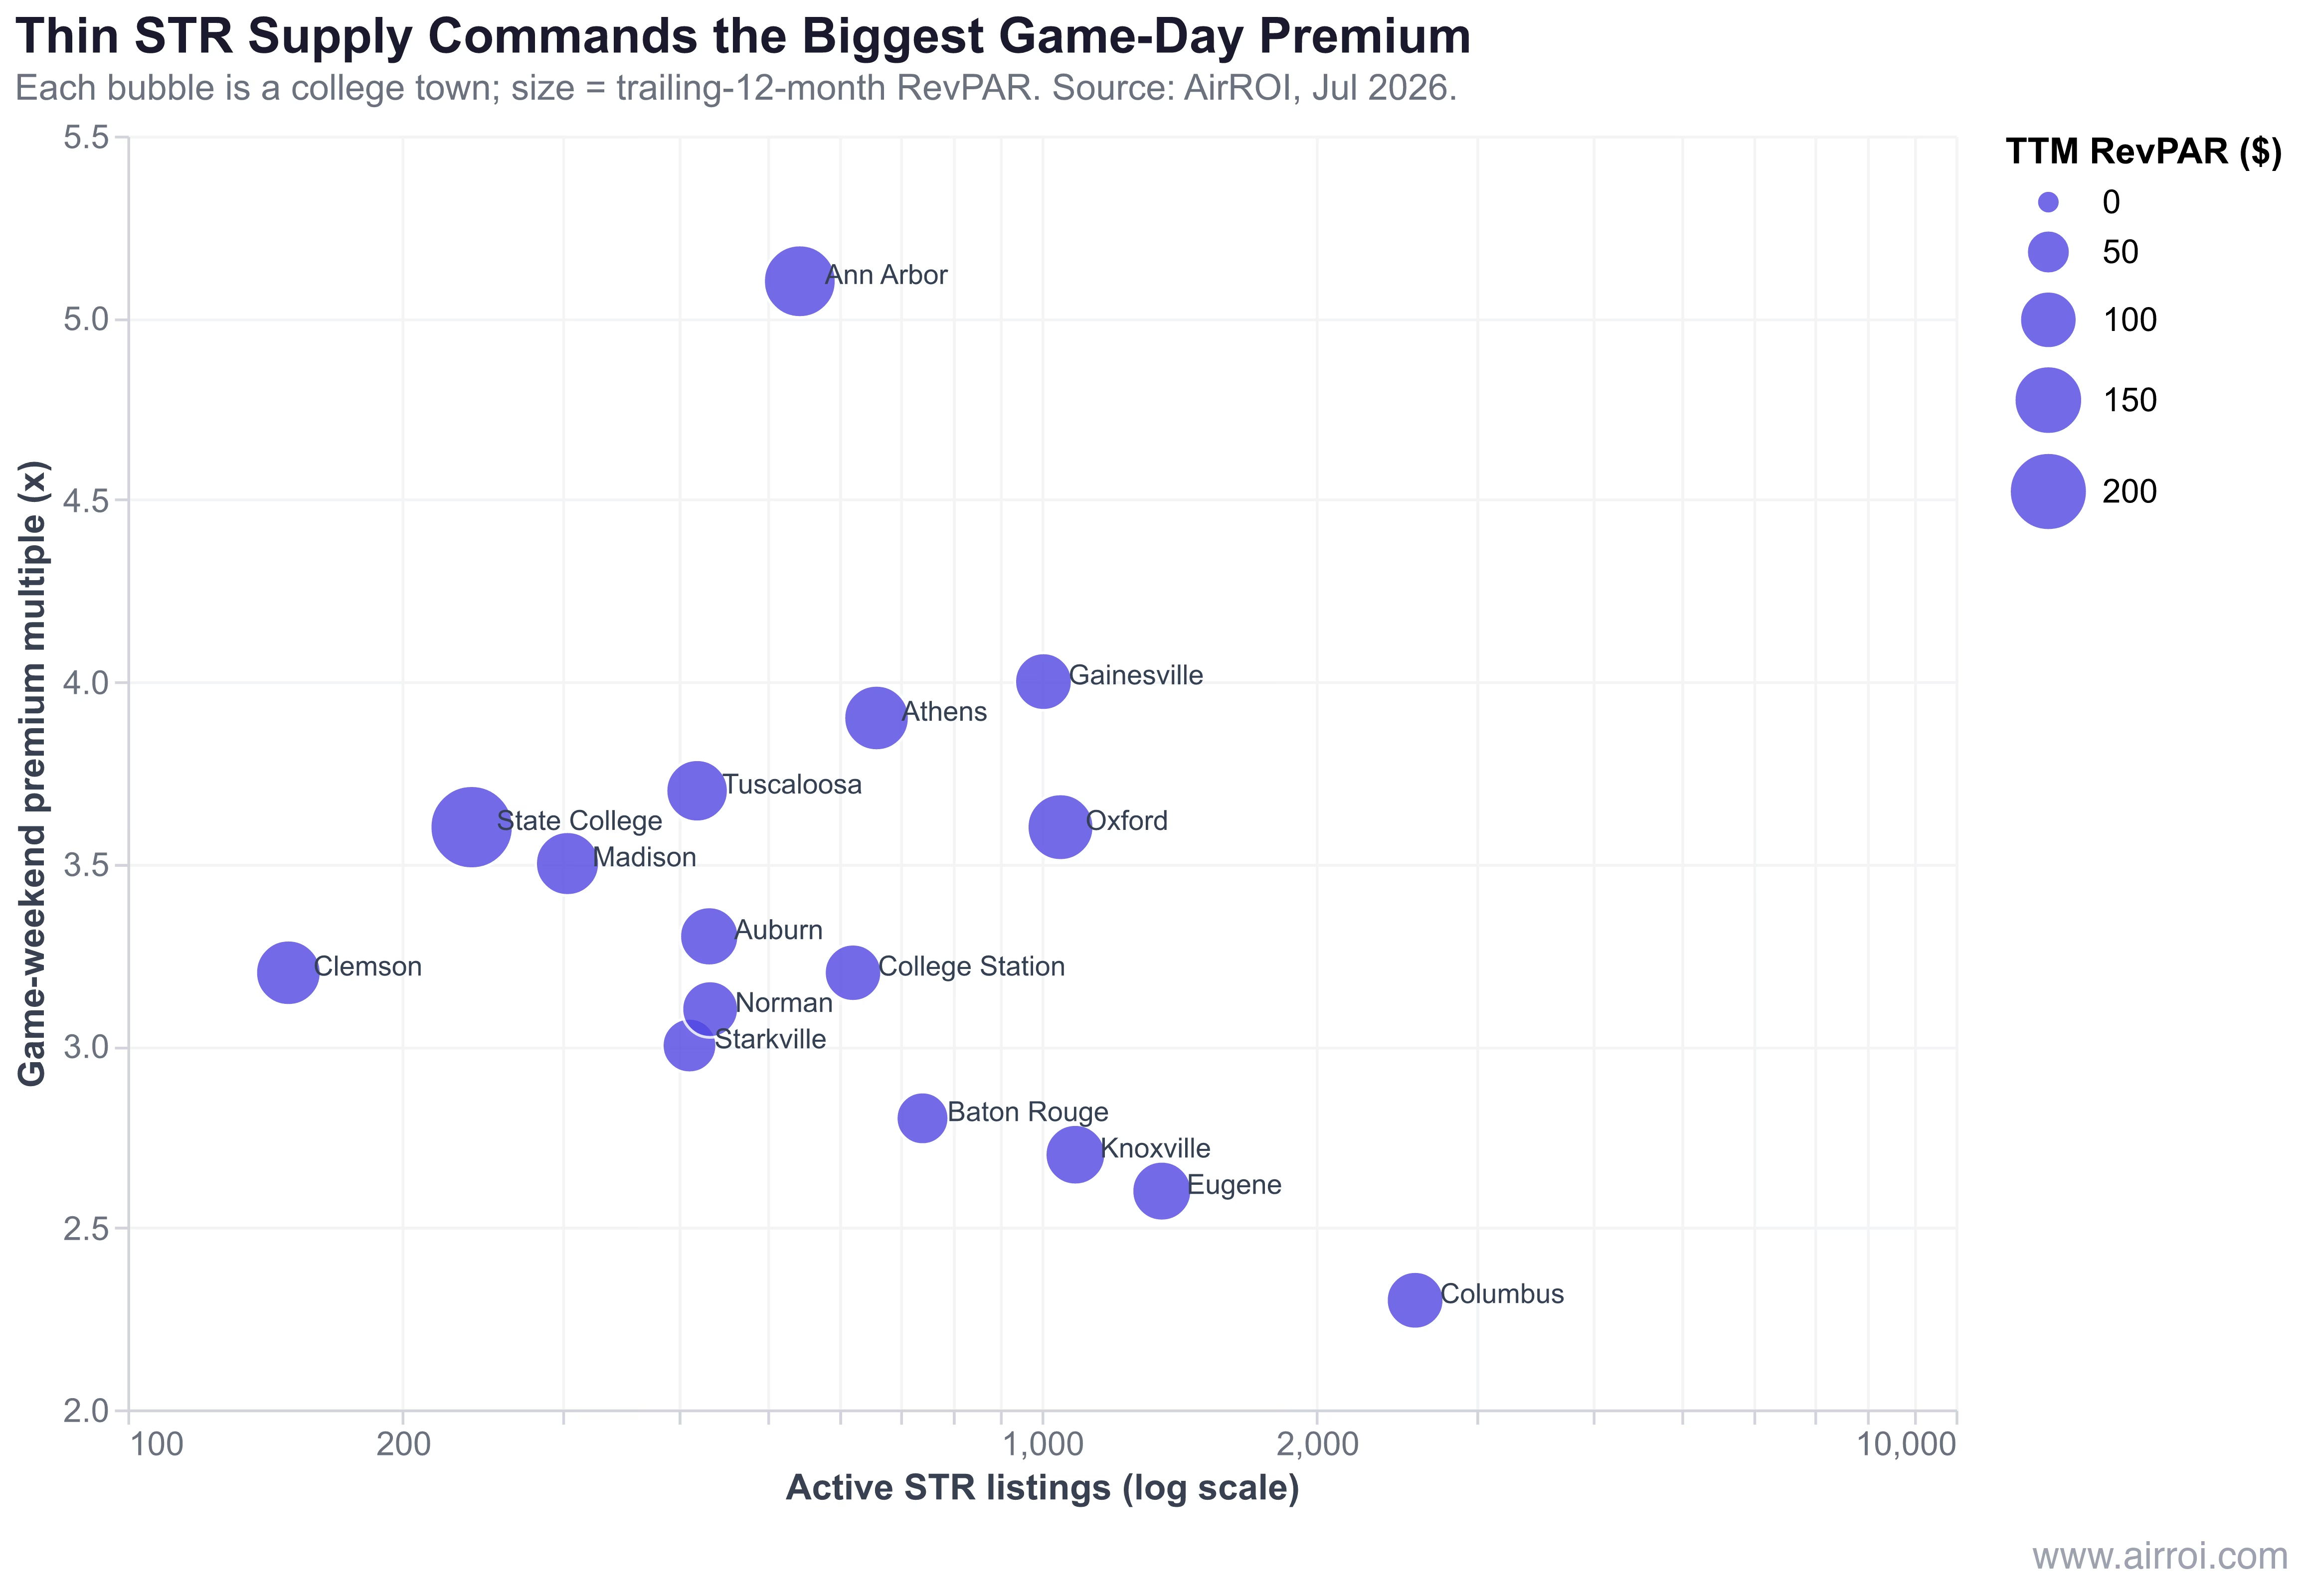
The difference is supply. Ann Arbor has 544 active listings; Columbus has 2,563. Columbus is a state capital and a full metro of nearly a million people, so game-day demand disperses across thousands of listings and the premium dilutes. Ann Arbor's demand hits a genuine college-town supply base, and the scarcity multiplies the rate. Stadium size is nearly identical; the STR inventory is not, and the inventory is what moves the premium.
The extremes reinforce it. Clemson carries the thinnest supply overall — just 150 active listings — and, unsurprisingly, the longest booking lead time in the set at 97 days: guests reserve nearly three and a half months out because there is so little to go around. State College's 238 listings against a 106,304-seat Beaver Stadium is the same story that produces the highest RevPAR in the ranking. Thin supply plus huge, sold-out demand is the formula.
Schedule effects: not all Saturdays are equal
Team-performance sensitivity: winning sets the ceiling
The premium has one uncomfortable dependency: it is tied to winning. Marquee matchups and ranked opponents pull the biggest rates, and both require a team worth traveling to see. A down year deflates pricing power — the same house that clears a top-decile rate in a playoff season commands far less when the team is 4-and-8 and the marquee home game is a blowout no one drives in for. It is the core risk in the model, and Section 5 comes back to how to underwrite around it.
How to price the schedule: a game-day pricing framework
The mistake that leaves the most money on the table is a single flat game rate. The data says price the schedule, not one blanket number — because the schedule itself is tiered, and the demand is already in motion. Four moves, grounded in the numbers above, turn that principle into a fall 2026 pricing plan.
Tier by opponent. Build three rate tiers off the home slate. Rivalry and ranked games sit at the top, other-conference games in the middle, and non-conference cupcakes on the floor. A practical anchor: on the biggest weekends, a walkable whole-home listing near a top-six market's stadium is priced toward the top-decile fall rate — think roughly $1,000 a night for a marquee game, $800 for a solid conference matchup, and $250 to $600 for a low-draw non-conference Saturday. The premium multiples in the ranking table are your ceiling; the off-season baseline is your floor; the specific opponent decides where on that ladder each Saturday belongs.
Set 2-to-3-night minimums. Game-town minimum stays cluster at 2.3 to 3.2 nights across the market data, and AirROI's forward pricing shows nearly every fall 2026 Saturday already carrying a 2-night minimum. A two-night floor captures the full Friday-through-Sunday window fans actually travel for and avoids surrendering a marquee Saturday to a single low-value one-night booking. On the biggest weekends, a three-night minimum is defensible where demand supports it.
Open the booking window early. These guests book far ahead — 97 days out in Clemson, 86 in Tuscaloosa, 76 in State College. Hosts who wait are pricing into games that have already sold. Todd Knobel, who rents rooms in Lincoln, Nebraska, told KLKN-TV that "the Colorado game is already booked" and that he learned to "make units available nearly six months in advance — that's when football season tickets go on sale." The lesson is concrete: list your fall Saturdays roughly six months out, when tickets drop, and expect the marquee games to sell first.
"Airbnb hosts in college towns are individuals, not corporations, and are more susceptible to biases that lead to sub-optimal pricing. In this case, we found that the strong emotions involved in college football rivalries confounded listing prices set by households."
The investment lens: underwriting a market whose upside is six Saturdays
Buying in a college town means underwriting an event-driven, seasonally concentrated revenue profile — not twelve months of demand. The tables above are a buy-side warning as much as a ranking. A market can post a headline $499 ADR and still be a thin-calendar bet if you do not know that only six weekends are doing the work.
Start with seasonality risk. Roughly 60% of fall income lands on about six home-game weekends, per the UCSD study, and the off-season floor is exactly that — a floor. Tuscaloosa's January ADR is $333 against an October peak of $644; State College's off-season baseline is $440 against a fall p90 of $1,560. Underwrite the base case on the six Saturdays you can actually count on, then treat everything else as upside rather than assumption.
A note on risk: college-town short-term rentals are an event-driven, seasonally concentrated asset with real team-performance risk. Past market performance does not guarantee future results, and nothing here is investment advice.
The off-season play
The durable operators do not leave eight months idle. They layer non-football demand onto the fall spine: graduation weekends, fall and winter move-in, parents' weekend, and campus concerts and festivals all pull rate outside the home slate. For the deep winter and spring, the strongest lever is length of stay — mid-term rentals for the off-season, the 30-plus-night bookings that fill the quiet months with visiting faculty, traveling professionals, and relocating families.
The market data already flags where this is happening. Madison's 15.7-night average minimum stay, Ann Arbor's 11.7, and Columbus's 9.6 are not game-day numbers — they are the fingerprint of a heavy monthly-rental mix underneath the football spike. Those markets are running a two-engine model: game weekends for the rate, mid-term stays for the base.
Which brings the analysis back to where it started — the six-Saturday math. In these towns, a season's return is not spread across a calendar; it is compressed into a handful of afternoons when a hundred thousand people converge and a few hundred listings absorb them. That compression is the opportunity and the risk in the same number. The 5.1x in Ann Arbor and the $46,798 per listing in State College are real, but they are built on scarcity meeting a schedule, and both halves have to hold. Price the schedule with discipline, underwrite the six Saturdays honestly, and the concentration works for you instead of against you.
Frequently Asked Questions
It depends on the town, opponent, and stadium proximity, but game weekends routinely command several times the normal nightly rate. AirROI data shows top-decile fall Saturday rates running 2.3x–5.1x the off-season baseline across major college towns, and whole-home listings near marquee programs gross $3,500–$5,000 for a two-night stay. In many college towns, roughly 60% of a host's fall income is earned across just the ~6 home-game weekends.
The strongest game-day markets pair a huge, sold-out stadium with thin STR supply. By AirROI's game-weekend premium multiple, Ann Arbor (5.1x), Gainesville (4.0x), Athens (3.9x), Tuscaloosa (3.7x), and Oxford and State College (3.6x) lead; State College posts the highest absolute RevPAR ($222) on just 238 listings. Big metros like Columbus dilute the premium to 2.3x because supply spreads across a whole city.
Often months ahead. AirROI shows booking lead times of 97 days in Clemson, 86 in Tuscaloosa, and 76 in State College, and hosts commonly open game weekends around six months out, when season tickets go on sale. Marquee and rivalry games sell out first, so fall 2026 rates should be set and live by mid-summer.
Yes — two-to-three-night minimums are the market standard on game weekends. AirROI game-town data clusters average minimum stays around 2.3–3.2 nights, and forward pricing shows nearly every fall Saturday carrying a 2-night minimum. It captures the full Friday–Sunday window fans travel for and avoids a single low-value Saturday booking.
Team-performance risk is the core vulnerability, because demand is tied to winning and marquee matchups. A down year deflates game-weekend pricing power, so durable operators diversify into graduation, move-in, parents' weekend, and mid-term demand. Underwrite the property on a realistic six-Saturday base case, not a playoff run.