Best Fall Foliage Airbnb Markets in 2026, Ranked by Data

In Bar Harbor, Maine, the two weeks around Columbus Day book at a 50% premium over the market's off-season rate — and they fill at 65% occupancy. In Stowe, Vermont, October now out-earns July. Across the top fall foliage Airbnb markets, a two-to-three-week leaf-peeping window is not a pleasant shoulder-season afterthought; it is the sharpest, most predictable demand spike of the year, and in the right markets it packs a second summer into three weeks of color.
That predictability is exactly why mid-July matters. Hosts set their fall rates now, months before the first maple turns. To find the best Airbnb markets for fall foliage — and to price them correctly — AirROI analyzed entire-home listings across 18 leaf-peeping markets spanning New England, the Blue Ridge and Smokies, the Rockies, the Upper Midwest, and the Mid-Atlantic, using booked nightly rates, occupancy, and RevPAR from the peak-color window of 2025 plus forward pricing for fall 2026 (data as of June 30, 2026). The pattern is consistent, quantifiable, and — for hosts who understand it — highly bookable.
The stakes are real money. Fall foliage tourism generates roughly $8 billion a year in New England alone, according to the U.S. Forest Service, and Michigan's fall-color season adds another $1 billion-plus. Short-term rental hosts in the right towns capture a concentrated slice of that spending in a window barely wider than a long weekend times three.
The fall foliage premium, ranked
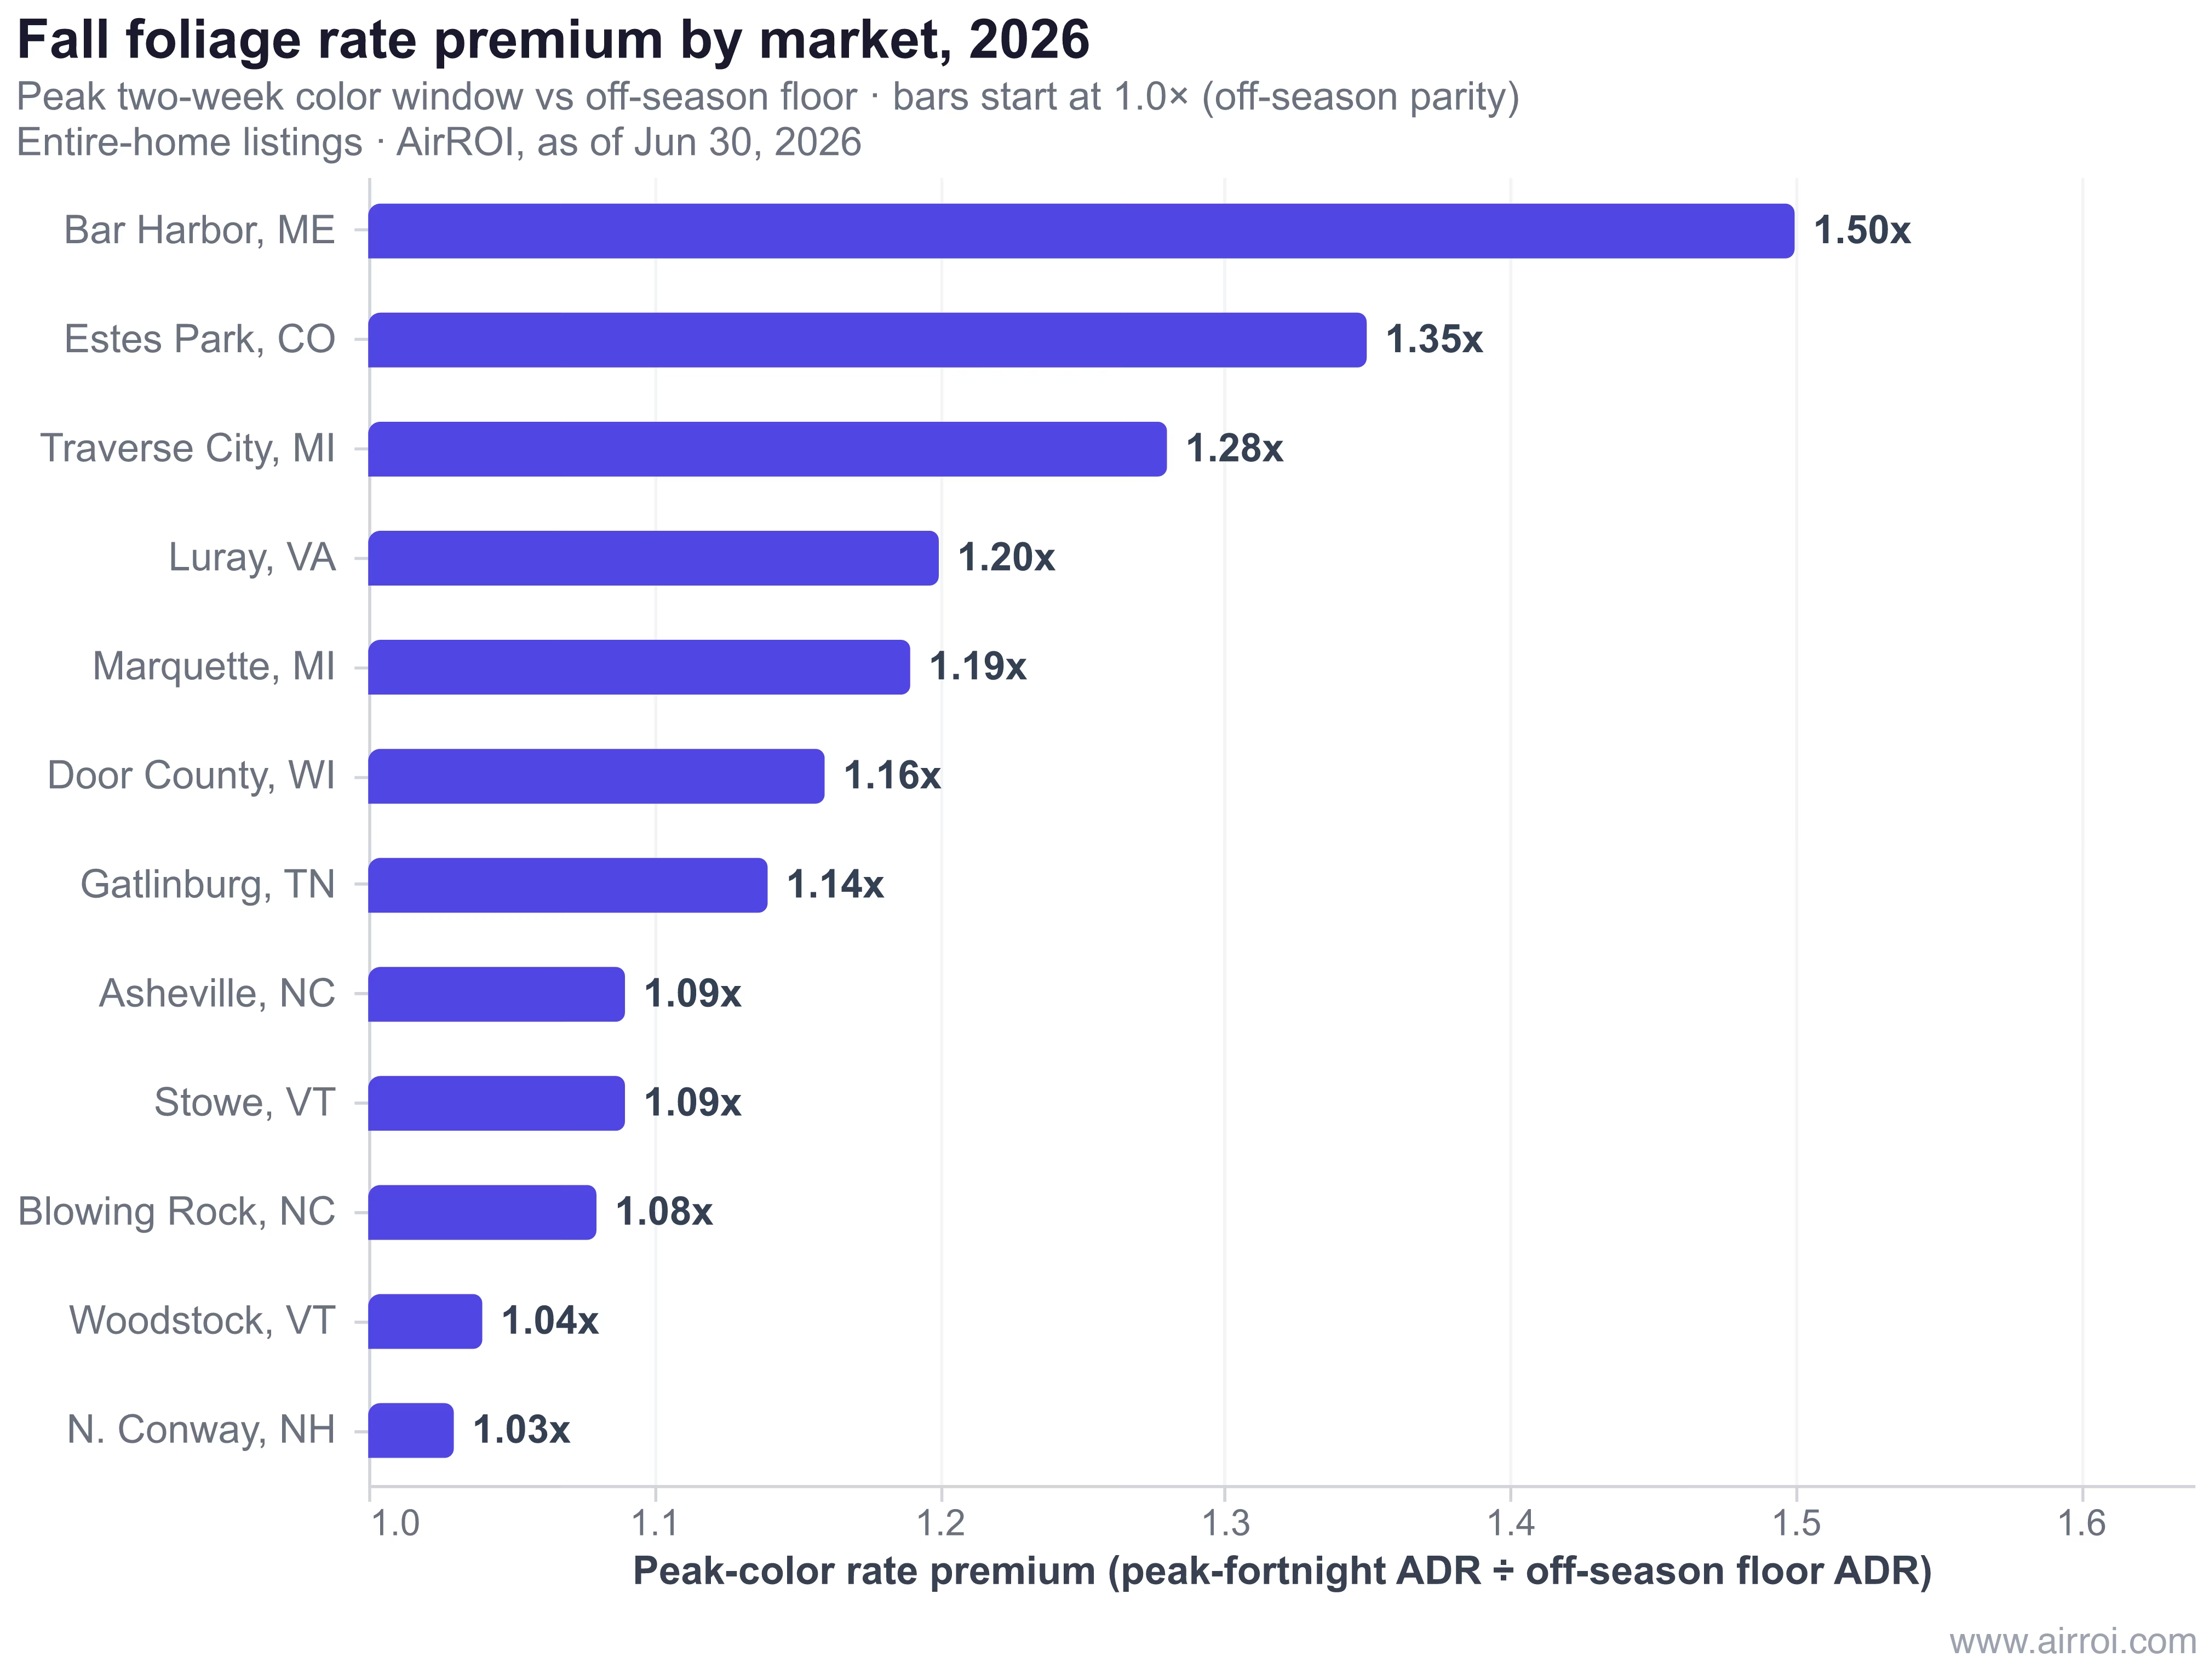
Bar Harbor leads the 2026 fall foliage markets with a 1.50x peak-color rate premium, followed by Estes Park, Colorado (1.35x) and Traverse City, Michigan (1.28x). The table below ranks 12 markets by their premium multiple — the peak-color fortnight's booked average daily rate (ADR) divided by the market's off-season floor ADR (the average of its three lowest-rate months). Occupancy and the October-versus-summer comparison are included because, as the next section shows, the rate premium tells only half the story.
| Rank | Market | Anchor | Peak color window (2025) | Peak ADR | Peak occ | Off-season floor ADR | Rate premium | Oct RevPAR vs summer |
|---|---|---|---|---|---|---|---|---|
| 1 | Bar Harbor, ME | Acadia NP | Sep 29–Oct 12 | $471 | 65% | $314 | 1.50x | 61% |
| 2 | Estes Park, CO | Rocky Mtn NP | Sep 15–28 | $457 | 56% | $340 | 1.35x | 51% |
| 3 | Traverse City, MI | Sleeping Bear | Sep 8–21 | $325 | 39% | $254 | 1.28x | 36% |
| 4 | Luray, VA | Shenandoah | Oct 6–19 | $334 | 50% | $278 | 1.20x | 109% |
| 5 | Marquette, MI | Upper Peninsula | Sep 15–28 | $265 | 55% | $222 | 1.19x | 64% |
| 6 | Door County, WI | Door Peninsula | Oct 6–19 | $396 | 47% | $341 | 1.16x | 52% |
| 7 | Gatlinburg, TN | Great Smokies | Oct 6–19 | $397 | 50% | $347 | 1.14x | 95% |
| 8 | Asheville, NC | Blue Ridge | Oct 6–19 | $287 | 47% | $263 | 1.09x | 120% |
| 9 | Stowe, VT | Green Mtns | Sep 29–Oct 12 | $516 | 51% | $475 | 1.09x | 126% |
| 10 | Blowing Rock, NC | High Country | Oct 6–19 | $373 | 42% | $347 | 1.08x | 107% |
| 11 | Woodstock, VT | Green Mtns | Sep 29–Oct 12 | $510 | 58% | $489 | 1.04x | 97% |
| 12 | N. Conway, NH | White Mtns | Sep 29–Oct 12 | $409 | 44% | $399 | 1.03x | 64% |
Two things stand out immediately. First, the raw rate premium is modest — most markets land between 1.03x and 1.20x, and only Bar Harbor, Estes Park, and Traverse City push past 1.25x. Nightly rates simply do not swing as violently as the crowds do. Second, the "Oct RevPAR vs summer" column swings wildly, from 36% in Traverse City to 126% in Stowe. That column, not the rate premium, is where the leaf-peeping money actually lives — and it splits these markets into two very different kinds of opportunity.
A quick note on Asheville: the Blue Ridge's marquee market is still rebuilding tourism infrastructure after Hurricane Helene struck western North Carolina in September 2024. The 2025 figures above reflect a recovering market, and its trajectory into 2026 is worth watching closely rather than extrapolating.
The two kinds of fall foliage premium
The foliage premium is a demand event, not a rate event — and understanding which type of market you own changes how you price it. Across the 12 featured markets, peak-color occupancy averages about 49%, roughly triple the 12% to 20% these same listings post in their off-season months. Nightly rates, by contrast, rise far less. The color window fills the calendar; it does not necessarily let you charge double.
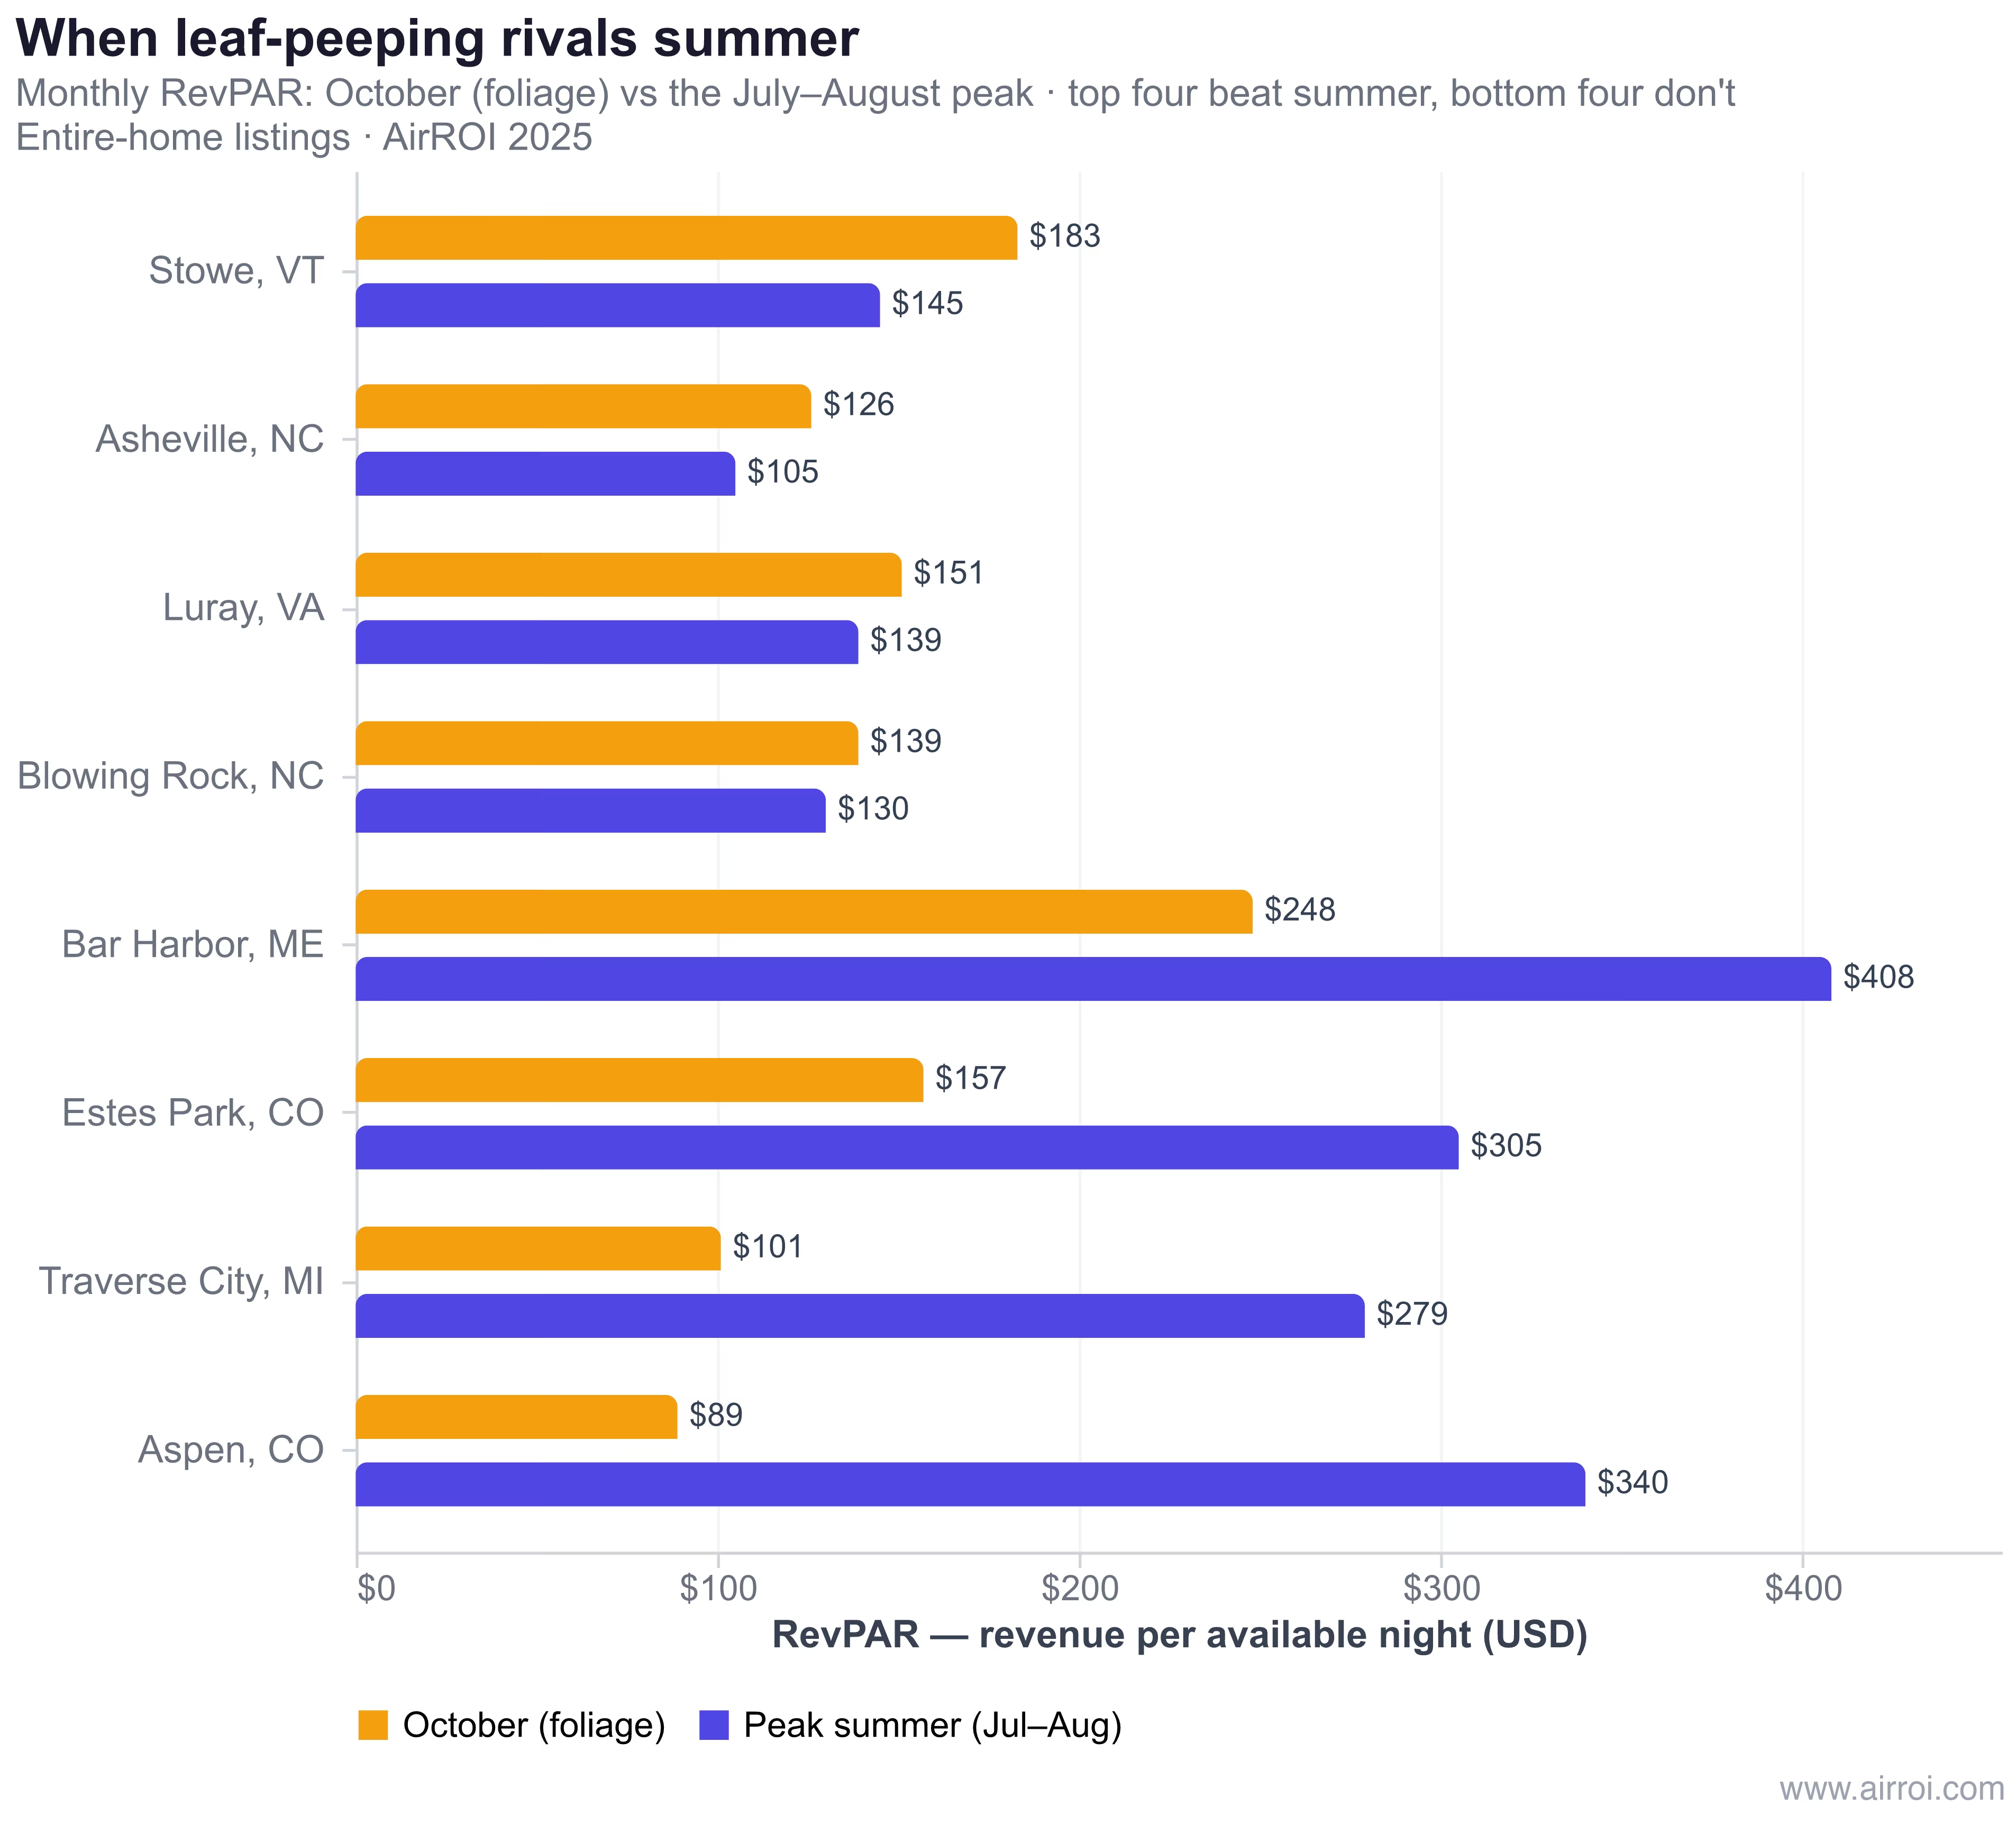
That split produces two archetypes, and the chart below makes the divide obvious by comparing each market's October RevPAR against its July–August summer peak.
Rate-spike markets: thin supply meets a hard demand pulse
In Bar Harbor, Estes Park, Traverse City, and Marquette, the nightly rate itself jumps — 19% to 50% over the off-season floor. These are national-park gateways and lake-country towns with tight rental supply and a hard, weather-gated demand pulse. Bar Harbor's Acadia window books at $471 a night and 65% occupancy; Estes Park, the doorstep to Rocky Mountain National Park, hits $457 at 56% during its mid-September aspen-and-elk-rut peak. Yet in all four, summer still wins the year: Bar Harbor's October RevPAR is only 61% of its July–August figure, and Traverse City's is 36%. Foliage is the highest-rate stretch of these markets' fall, but the beach-and-lake summer remains the main event. For these hosts, the play is to push rate aggressively on the peak color weekends, because the demand is inelastic and the supply is scarce.
October-is-the-peak markets: occupancy carries it
In Stowe, Asheville, Shenandoah's Luray, and the Blue Ridge High Country, the rate barely moves — premiums of 1.01x to 1.20x — but October RevPAR ties or beats the summer peak. Stowe's October RevPAR reaches 126% of its summer, Asheville 120%, Luray 109%, and Blowing Rock 107%. In seven of the 18 markets AirROI studied, October RevPAR equals or exceeds peak summer. The reason differs by geography: Vermont ski towns have a soft warm-season summer, so foliage is simply their warm-weather high; the Smokies and Blue Ridge draw their single biggest crowds of the year for fall color. Either way, the lesson is the same.
"The foliage premium doesn't show up in a market's average ADR — it shows up in three weeks of near-full calendars. Price the window on RevPAR, not the headline rate."
For October-is-the-peak markets, chasing a fat nightly rate is a trap. The revenue comes from filling the calendar at a fair rate, then protecting that occupancy with disciplined minimum stays.
The cautionary tale: Aspen
When the color peaks: the fall foliage timing gradient
Fall foliage peaks north-to-south and high-to-low in elevation, sliding across roughly five weeks — and the AirROI booking data tracks that gradient almost perfectly. Knowing your market's window to the week is the foundation of pricing it, because the premium is compressed into a fortnight and misfiring by even seven days leaves money on the table.
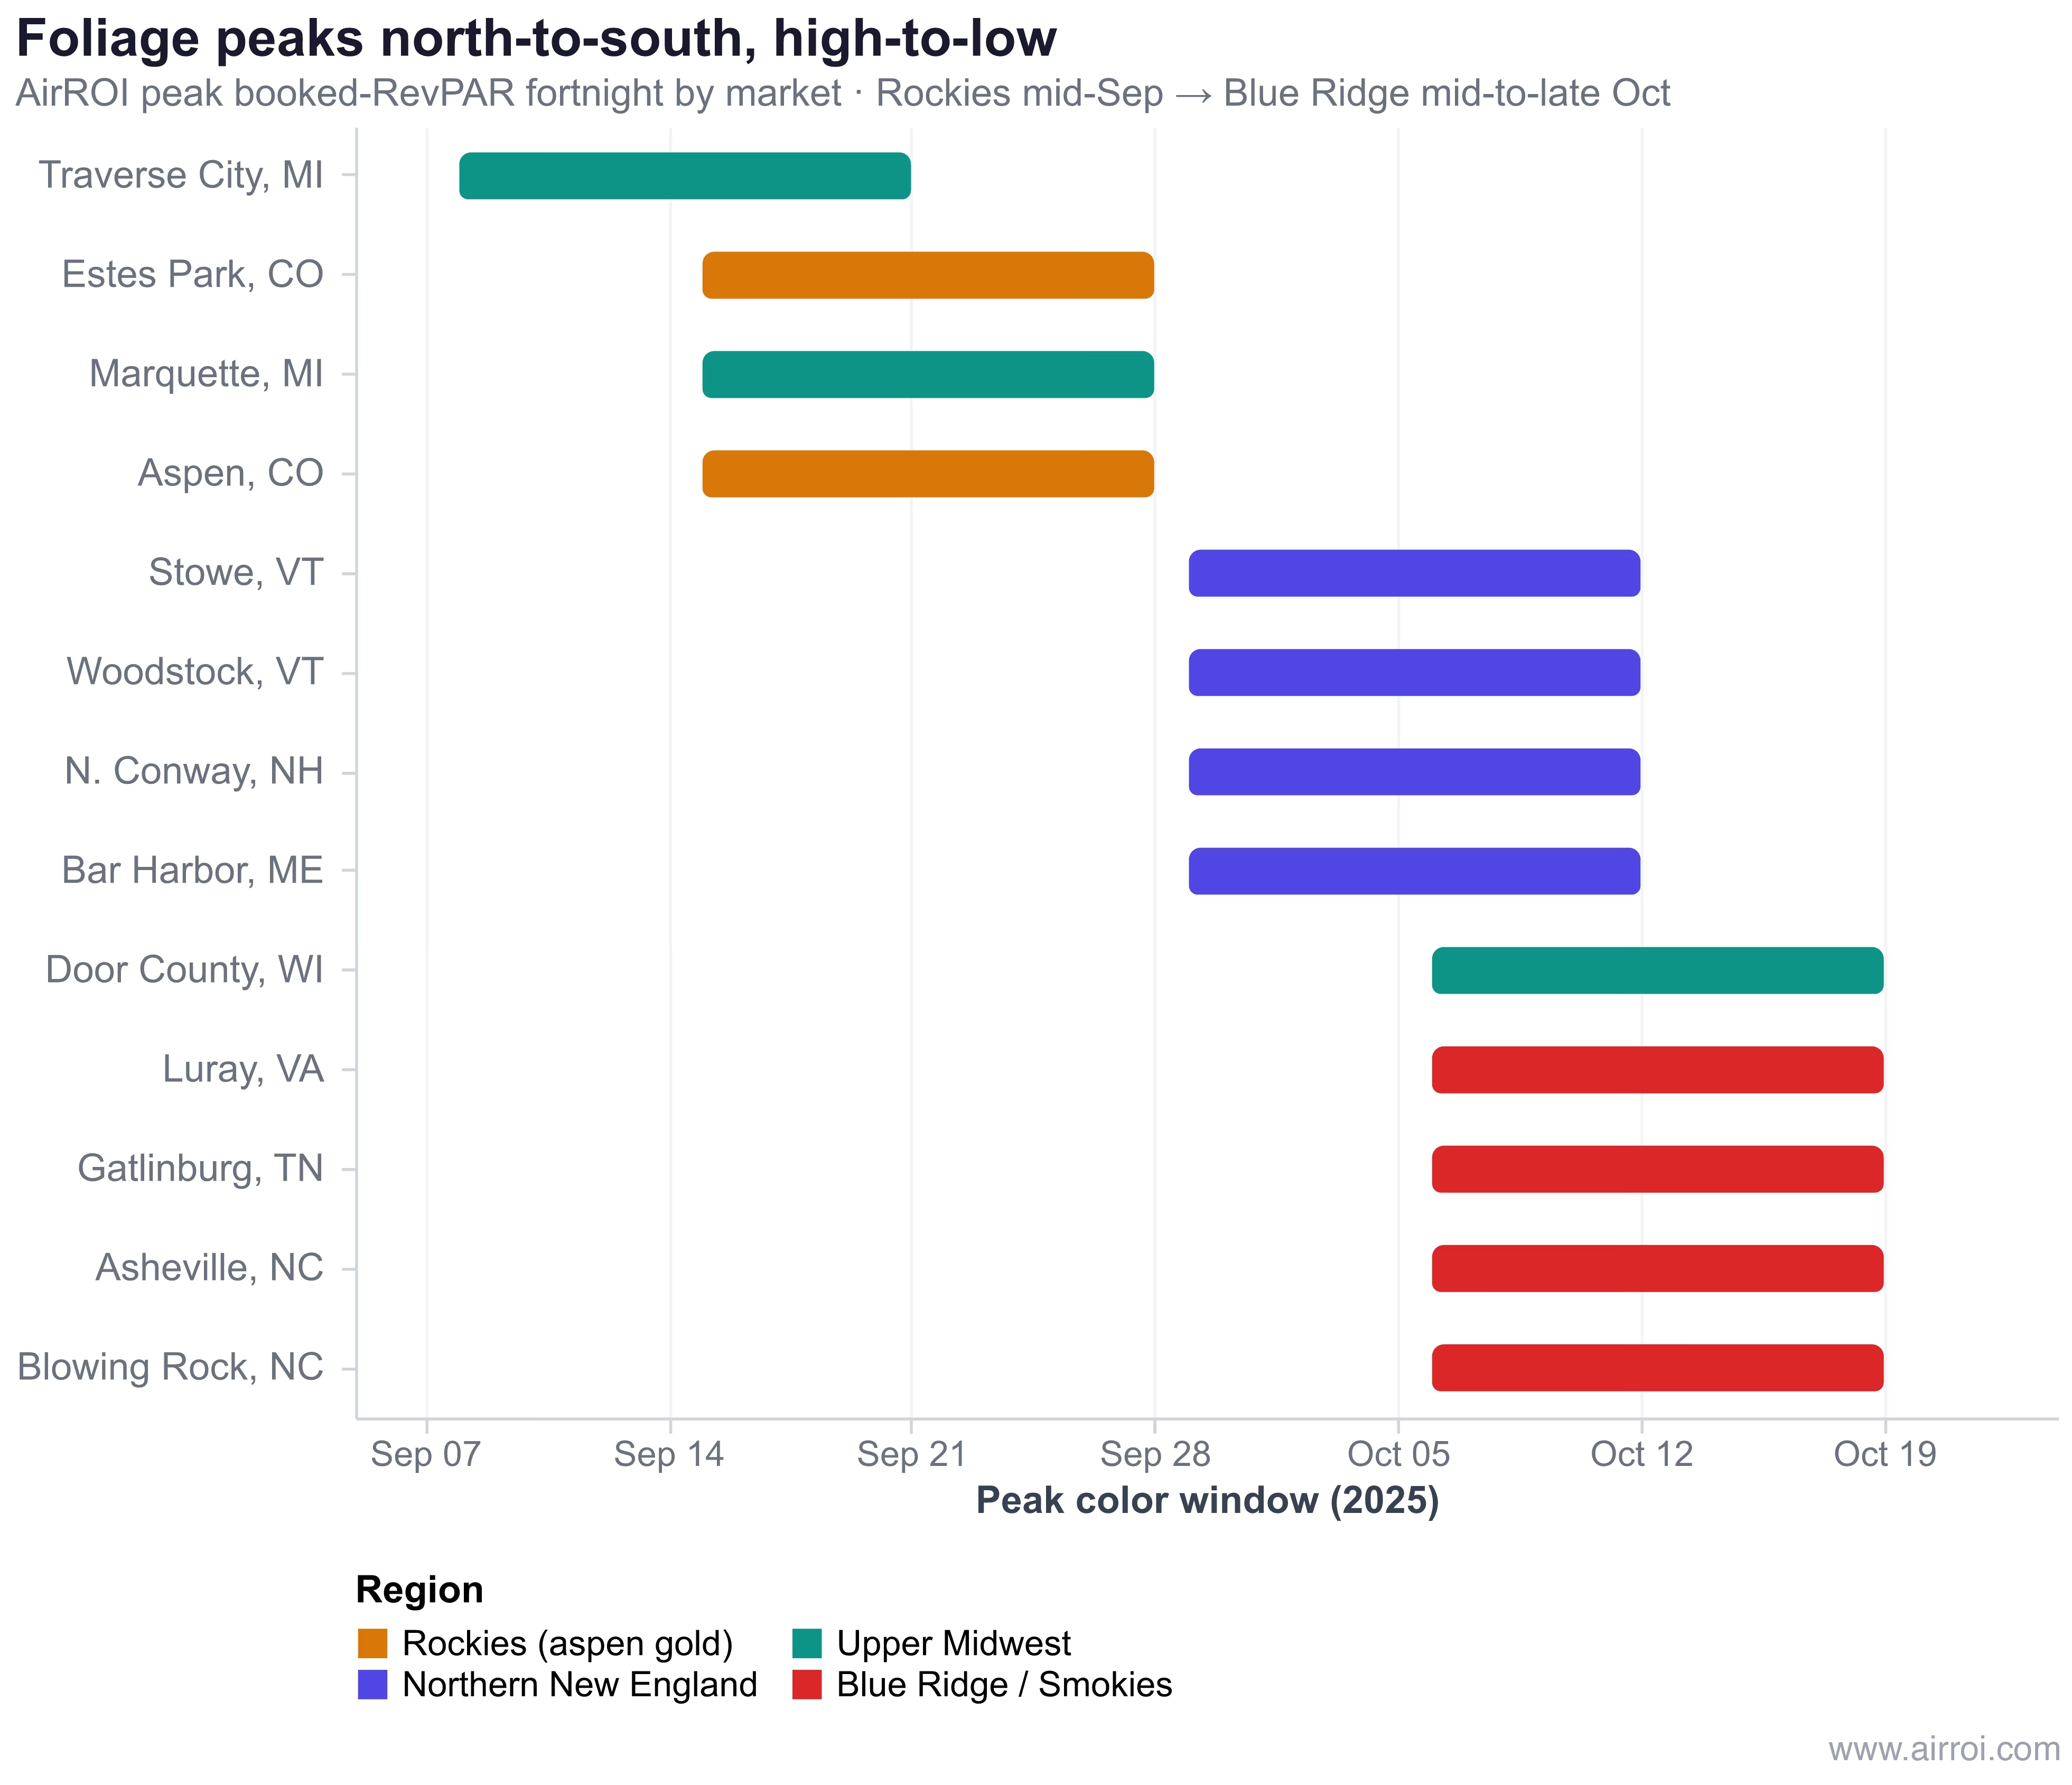
The 2025 booking peaks fall into three clean bands:
- Mid-September — the high Rockies. Estes Park and Aspen peaked September 15–28, when golden aspens overlap the elk rut. Traverse City's northern-Michigan window ran even earlier, September 8–21.
- Late September to early October — northern New England's high country and the Upper Midwest. Stowe, Woodstock, North Conway, and Bar Harbor all peaked the fortnight of September 29–October 12; Marquette in Michigan's Upper Peninsula and Door County, Wisconsin followed close behind.
- Mid-to-late October — the Blue Ridge, Smokies, and Shenandoah. Gatlinburg, Asheville, Boone, Blowing Rock, Banner Elk, and Luray all peaked October 6–19, as color descended from the ridgelines into the valleys.
"There is the concern that with continued climate change, we not only have an increasingly later fall foliage season, but that it might become less vibrant." — Dr. Alexandra Kosiba, forest ecophysiologist, University of Vermont
The window is not only narrow; it is a moving target. That reality shapes both how you price and how you underwrite, as we cover below.
Why large cabins win the fall foliage window
The foliage premium concentrates in large group cabins and lodges — and the citywide average ADR washes it out completely. This is the single most common way hosts and investors misread a foliage market. When a listing benchmarks itself against a market's blended average — which mixes studios, one-bedroom condos, and six-bedroom lodges into one number — it systematically under-prices the exact inventory leaf-peepers want: a big cabin that sleeps two or three couples on a fall getaway.
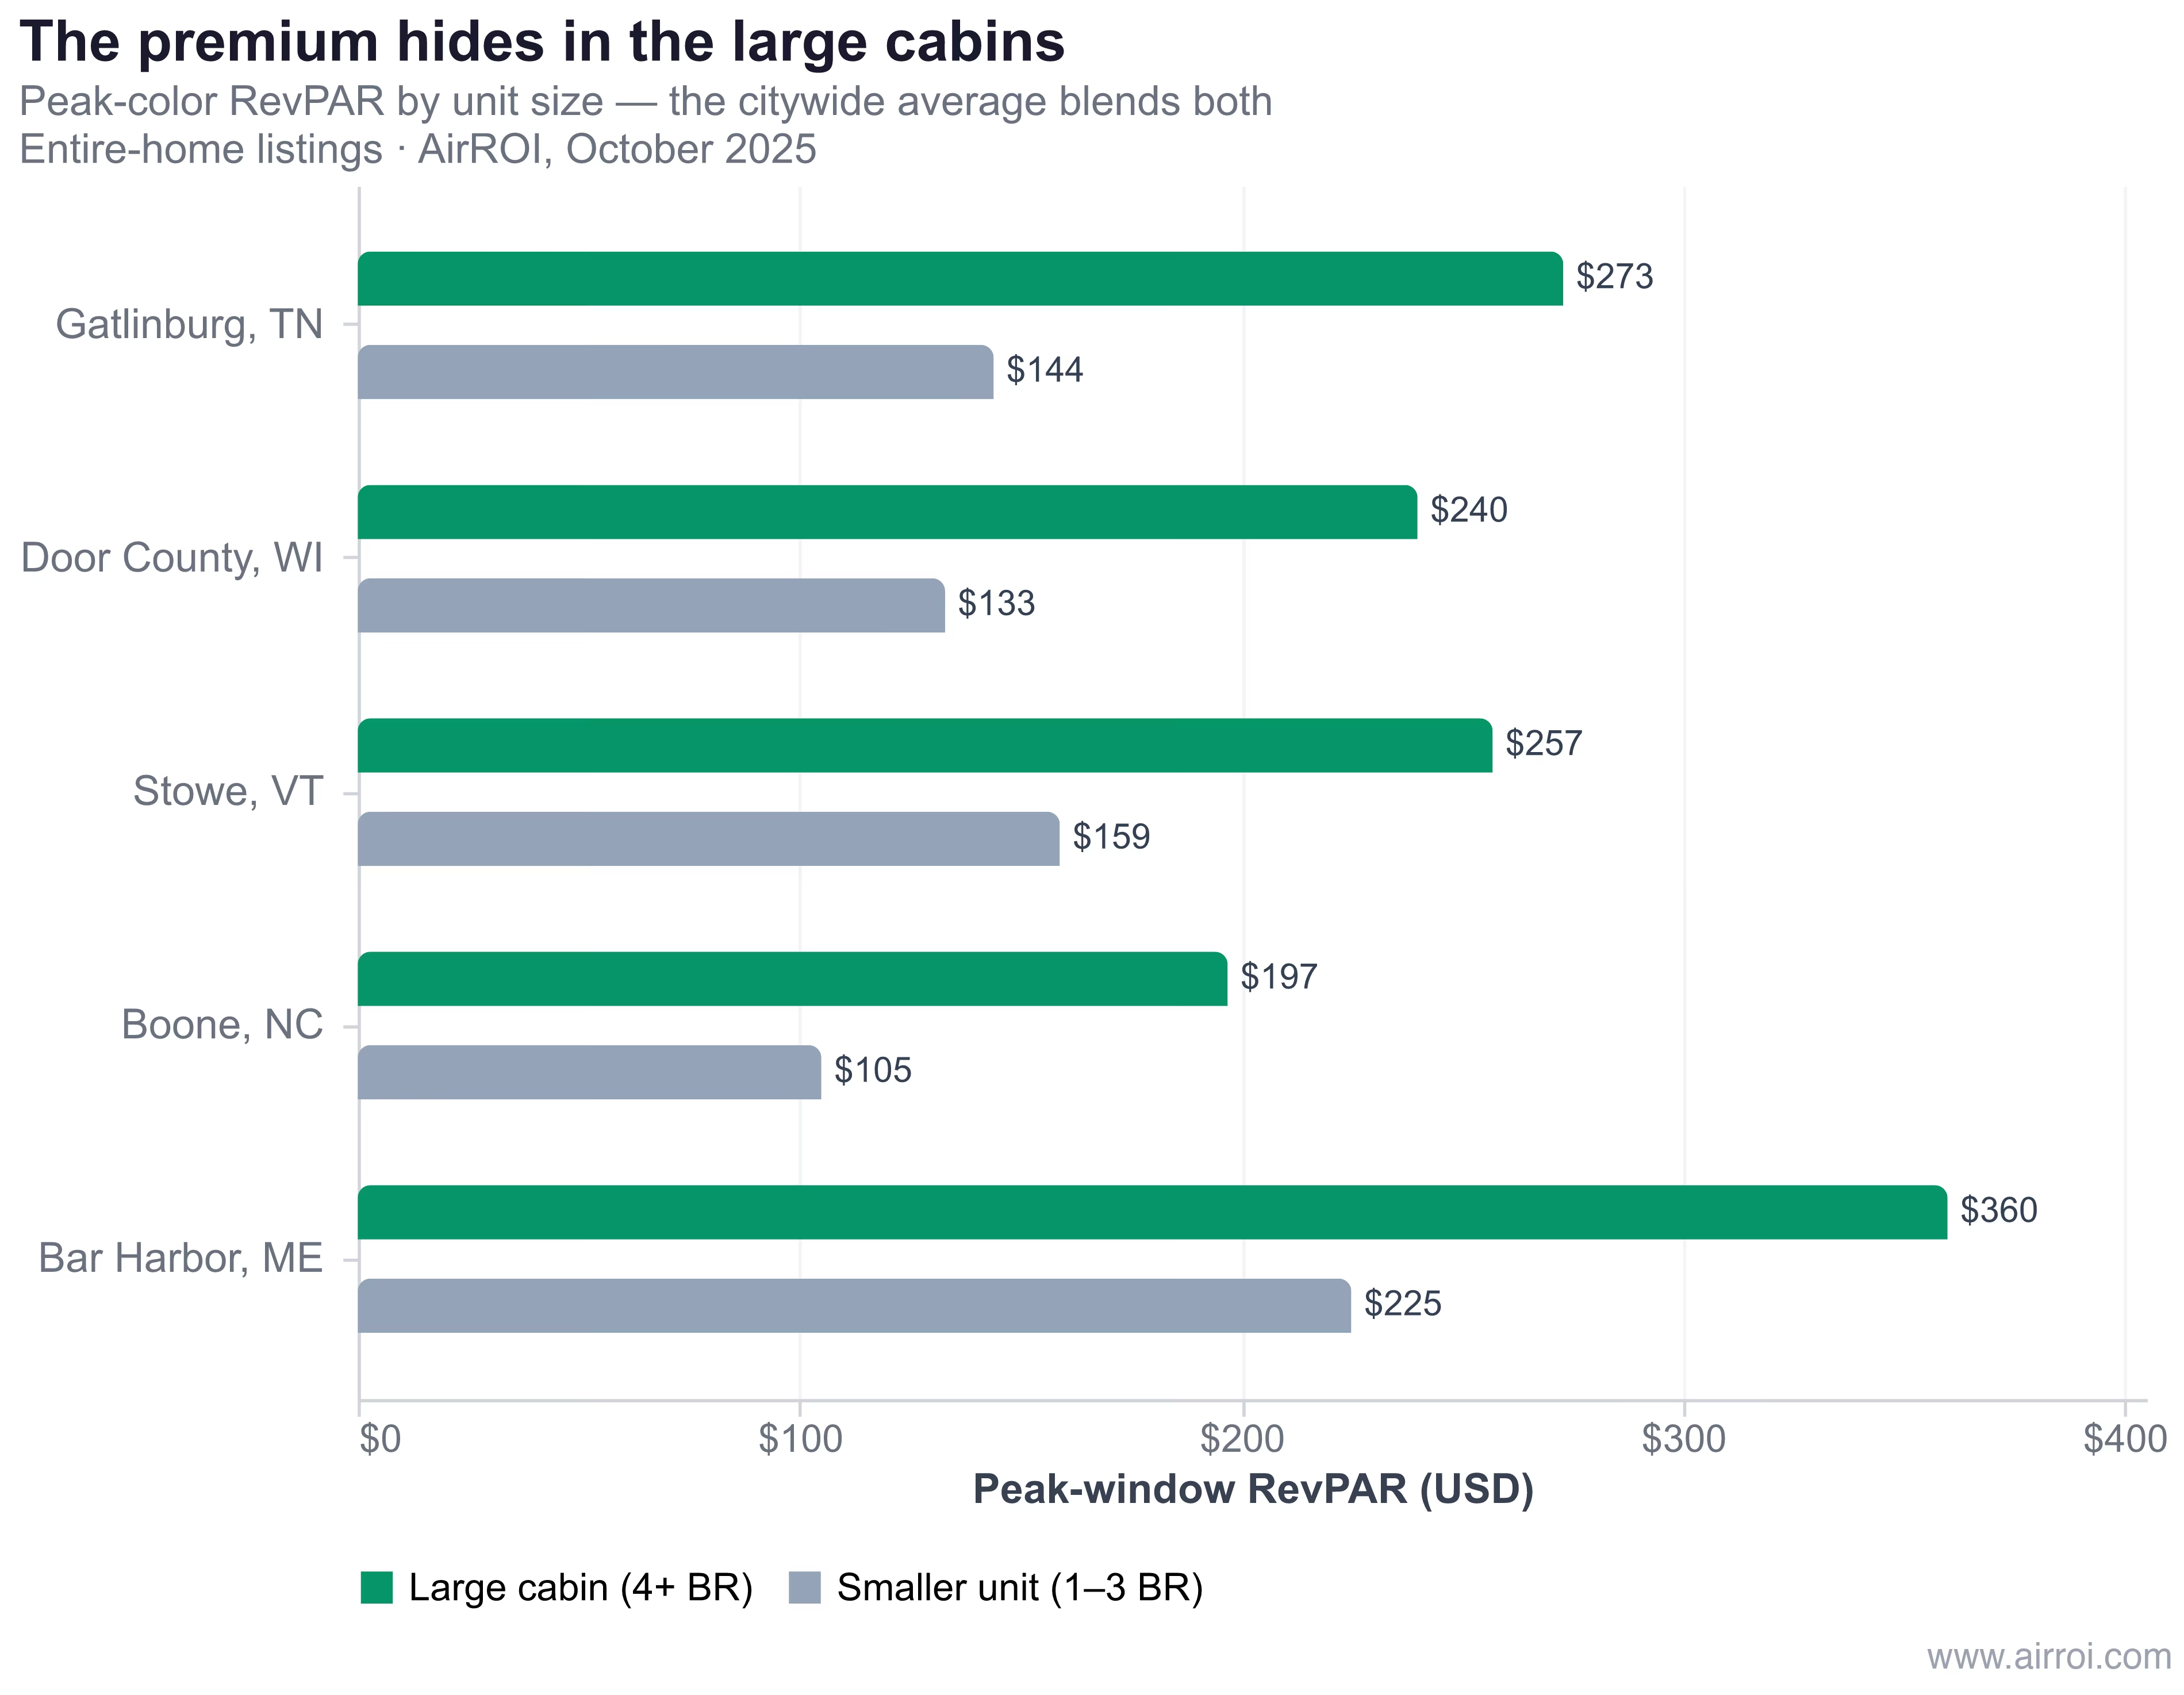
The segmentation is stark. In Gatlinburg, four-plus-bedroom cabins book the October peak at $668 a night while smaller units average $310 — and the large cabins earn 1.9x the RevPAR ($273 versus $144 per available night). The pattern repeats across cabin country: Boone's large cabins earn 1.9x their smaller counterparts, Door County's 1.8x, Stowe's 1.6x, and Bar Harbor's 1.6x. Stowe's four-plus-bedroom homes command $907 a night in the peak fortnight against a citywide figure of $516.
Crucially, the seasonal multiple is similar across unit sizes — a big cabin does not see a sharper premium over its own off-season than a studio does. What differs is the absolute dollars. The foliage window is fundamentally group-travel demand, and group demand pays for space. A host benchmarking a large mountain cabin against the market average is leaving hundreds of dollars a night on the table during precisely the weeks when the correct comp set — other large cabins — is nearly sold out.
How to price the narrow fall foliage window
Pricing foliage well comes down to five disciplines: map the peak, open early, gate with minimum stays, price on RevPAR, and hedge the weather. An autumn Airbnb pricing strategy that treats October as generic shoulder season leaves the entire premium unclaimed.
Map your market's peak to the week. Use the timing gradient above and a live forecast to pin your two-week window, then build a rate calendar around it — a steep peak, tapering shoulders on either side, and off-season floors outside. A Rockies host prices mid-September; a Smokies host prices mid-to-late October. Getting the window wrong by a week is the most common and most expensive foliage pricing error.
Open the calendar early and price it now. Leaf-peepers book far ahead. Peak-window booking lead times run 90 to 103 days in the top markets — 103 in Bar Harbor, 97 in Woodstock, 92 in Door County — so by mid-July the fall demand is already shopping. The forward data confirms it: as of June 30, 2026, 14% to 46% of peak-window nights were already booked for this fall (46% in Bar Harbor, 43% in Woodstock, 40% in Estes Park), and hosts have listed the 2026 window 20% to 40% above what booked in 2025. A calendar that opens in September has already missed the highest-intent bookers.
Gate with minimum stays. The window rewards two- and three-night minimums over peak weekends. Average length of stay in the foliage fortnight runs three to four nights in the cabin markets, and minimum-stay gating prevents a single Saturday booking from stranding the Friday and Sunday around it.
Hedge the weather. Foliage is weather-gated, and the timing is uncertain even within a season.
"You need a 'Goldilocks zone' of rain. Too little rain and too much rain — bad for trees, bad for fall foliage colors." — Dr. Stephanie Spera, professor of geography, University of Richmond
Flexible date pricing — pricing a broader three-week band rather than betting everything on one weekend — hedges the risk that peak color arrives early or late. It also captures the overflow when a single social-media-famous overlook draws crowds that spill into the surrounding towns, an increasingly common dynamic that Dr. Lisa Chase of the University of Vermont Tourism Research Center notes is pushing travelers to "explore the incredible back roads" beyond the marquee spots.
The investment lens: underwriting a three-week upside
A foliage-concentrated revenue profile is a specific investment thesis, and it should be underwritten on the full year — not the three best weeks. The markets on this list share a demanding shape: a sharp, narrow autumn spike, a strong or dominant summer, and long off-season troughs where occupancy sinks into the teens. That shape is investable, but only with eyes open.
Finally, price the climate risk into the model. Peak timing is drifting later and the color's vibrancy is not guaranteed year to year.
"Pests love wet and warm. And that's where we're heading climatically." — Jim Salge, foliage forecaster, Yankee Magazine
A property whose entire thesis rests on a predictable third week of October is exposed to a variable that is becoming less predictable. The markets that hold up are the ones where foliage is a high-margin bonus on top of a durable year-round profile — not the whole business case. The data rewards hosts who treat the color window as what it is: the sharpest demand pulse of the year, worth pricing with precision, layered onto a market that can pay its way when the leaves are down.
Frequently Asked Questions
By AirROI's peak-color rate premium, Bar Harbor, Maine (Acadia) leads at a 1.50x nightly-rate premium and 65% occupancy in the leaf-peeping fortnight, followed by Estes Park, Colorado (1.35x) and Traverse City, Michigan (1.28x). For markets where the fall window actually rivals summer, Stowe, Vermont and the Blue Ridge and Smokies stand out — October RevPAR there matches or beats the July–August peak.
Peak color moves north-to-south and high-to-low in elevation. The high Rockies (Estes Park, Aspen) peak in mid-September; northern New England (Stowe, North Conway) and the Upper Midwest (Marquette, Door County) around the first week of October; and the Blue Ridge, Smokies, and Shenandoah in mid-to-late October. Weather can shift any region by a week.
In seven of the 18 markets AirROI analyzed, October RevPAR equals or exceeds the peak-summer RevPAR — Stowe reaches 126%, Asheville 120%, and Shenandoah's Luray 109%. In coastal and lake markets like Bar Harbor and Traverse City summer still wins, but the foliage fortnight commands the highest nightly rates of any high-occupancy stretch of their year.
Peak-foliage booking lead times run 90 to 103 days in the top markets — Bar Harbor averages 103 days, Woodstock 97, and Door County 92 — meaning travelers commit two to three months out. As of June 30, 2026, 14% to 46% of peak-window nights were already booked for fall 2026, which is why hosts should open and price the calendar in July.
Large group cabins and lodges capture the sharpest dollar opportunity. In Gatlinburg, four-plus-bedroom cabins book the October peak at $668 a night versus $310 for smaller units and earn roughly 1.9x the RevPAR — a premium the citywide average ADR hides because it blends studios with six-bedroom lodges.