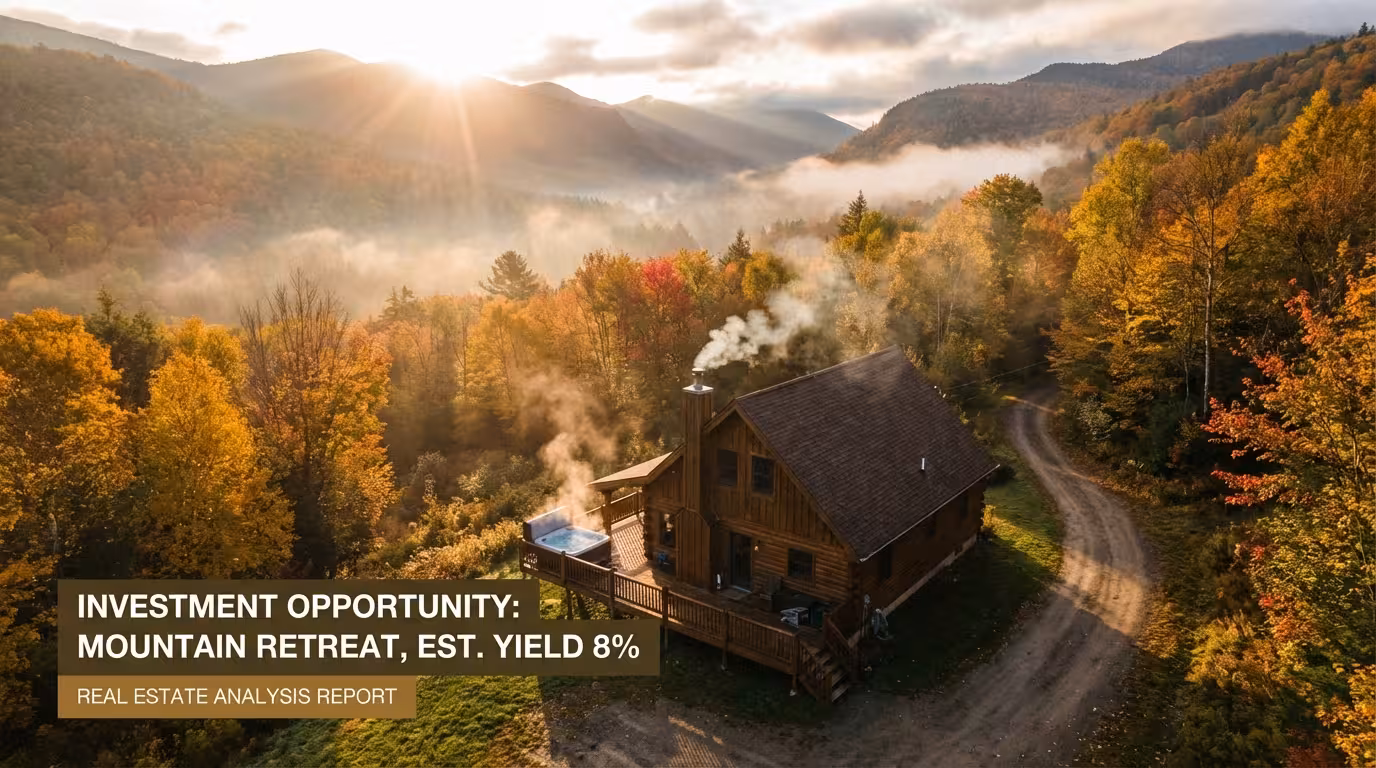
Cabin Rental Revenue 2026: AirROI Data Across 10 Mountain Markets Reveals Where Cabins Pay
A 6-bedroom cabin in Gatlinburg earns $138,630 per year. A 2-bedroom cabin in the same market earns $36,187. That 3.8x gap -- in the same zip code, on the same platform -- is the kind of data that should inform every cabin rental revenue decision in 2026. Yet it doesn't, because it hasn't existed until now.
AirROI analyzed 21,000+ active cabin listings across 10 mountain markets to produce the first systematic airbnb cabin investment analysis. Here is what the data reveals.
10 Mountain Markets, 21,000 Cabins: The Revenue Breakdown
Mountain cabin revenue ranges from $30,051 to $62,011 annually across the 10 markets in this analysis. The spread is driven by a fundamental tension between average daily rate and occupancy rate -- the markets charging the most per night don't always fill the most nights.
| Market | Active Listings | ADR | Occupancy | RevPAR | TTM Revenue |
|---|---|---|---|---|---|
| Big Sky, MT | 1,034 | $818 | 35% | $277 | $62,011 |
| Shenandoah, VA | 103 | $375 | 48% | $183 | $57,196 |
| Hocking Hills, OH | 702 | $411 | 45% | $183 | $55,615 |
| Broken Bow, OK | 2,878 | $469 | 38% | $179 | $52,009 |
| Gatlinburg, TN | 3,618 | $378 | 48% | $180 | $51,030 |
| S. Lake Tahoe, CA | 1,668 | $554 | 38% | $217 | $48,722 |
| Pigeon Forge, TN | 2,998 | $364 | 47% | $170 | $48,018 |
| Blue Ridge, GA | 1,352 | $374 | 43% | $161 | $45,893 |
| Big Bear Lake, CA | 2,973 | $478 | 30% | $145 | $35,711 |
| Asheville, NC | 1,891 | $260 | 45% | $114 | $30,051 |
Source: AirROI market data, trailing twelve months ending April 2026
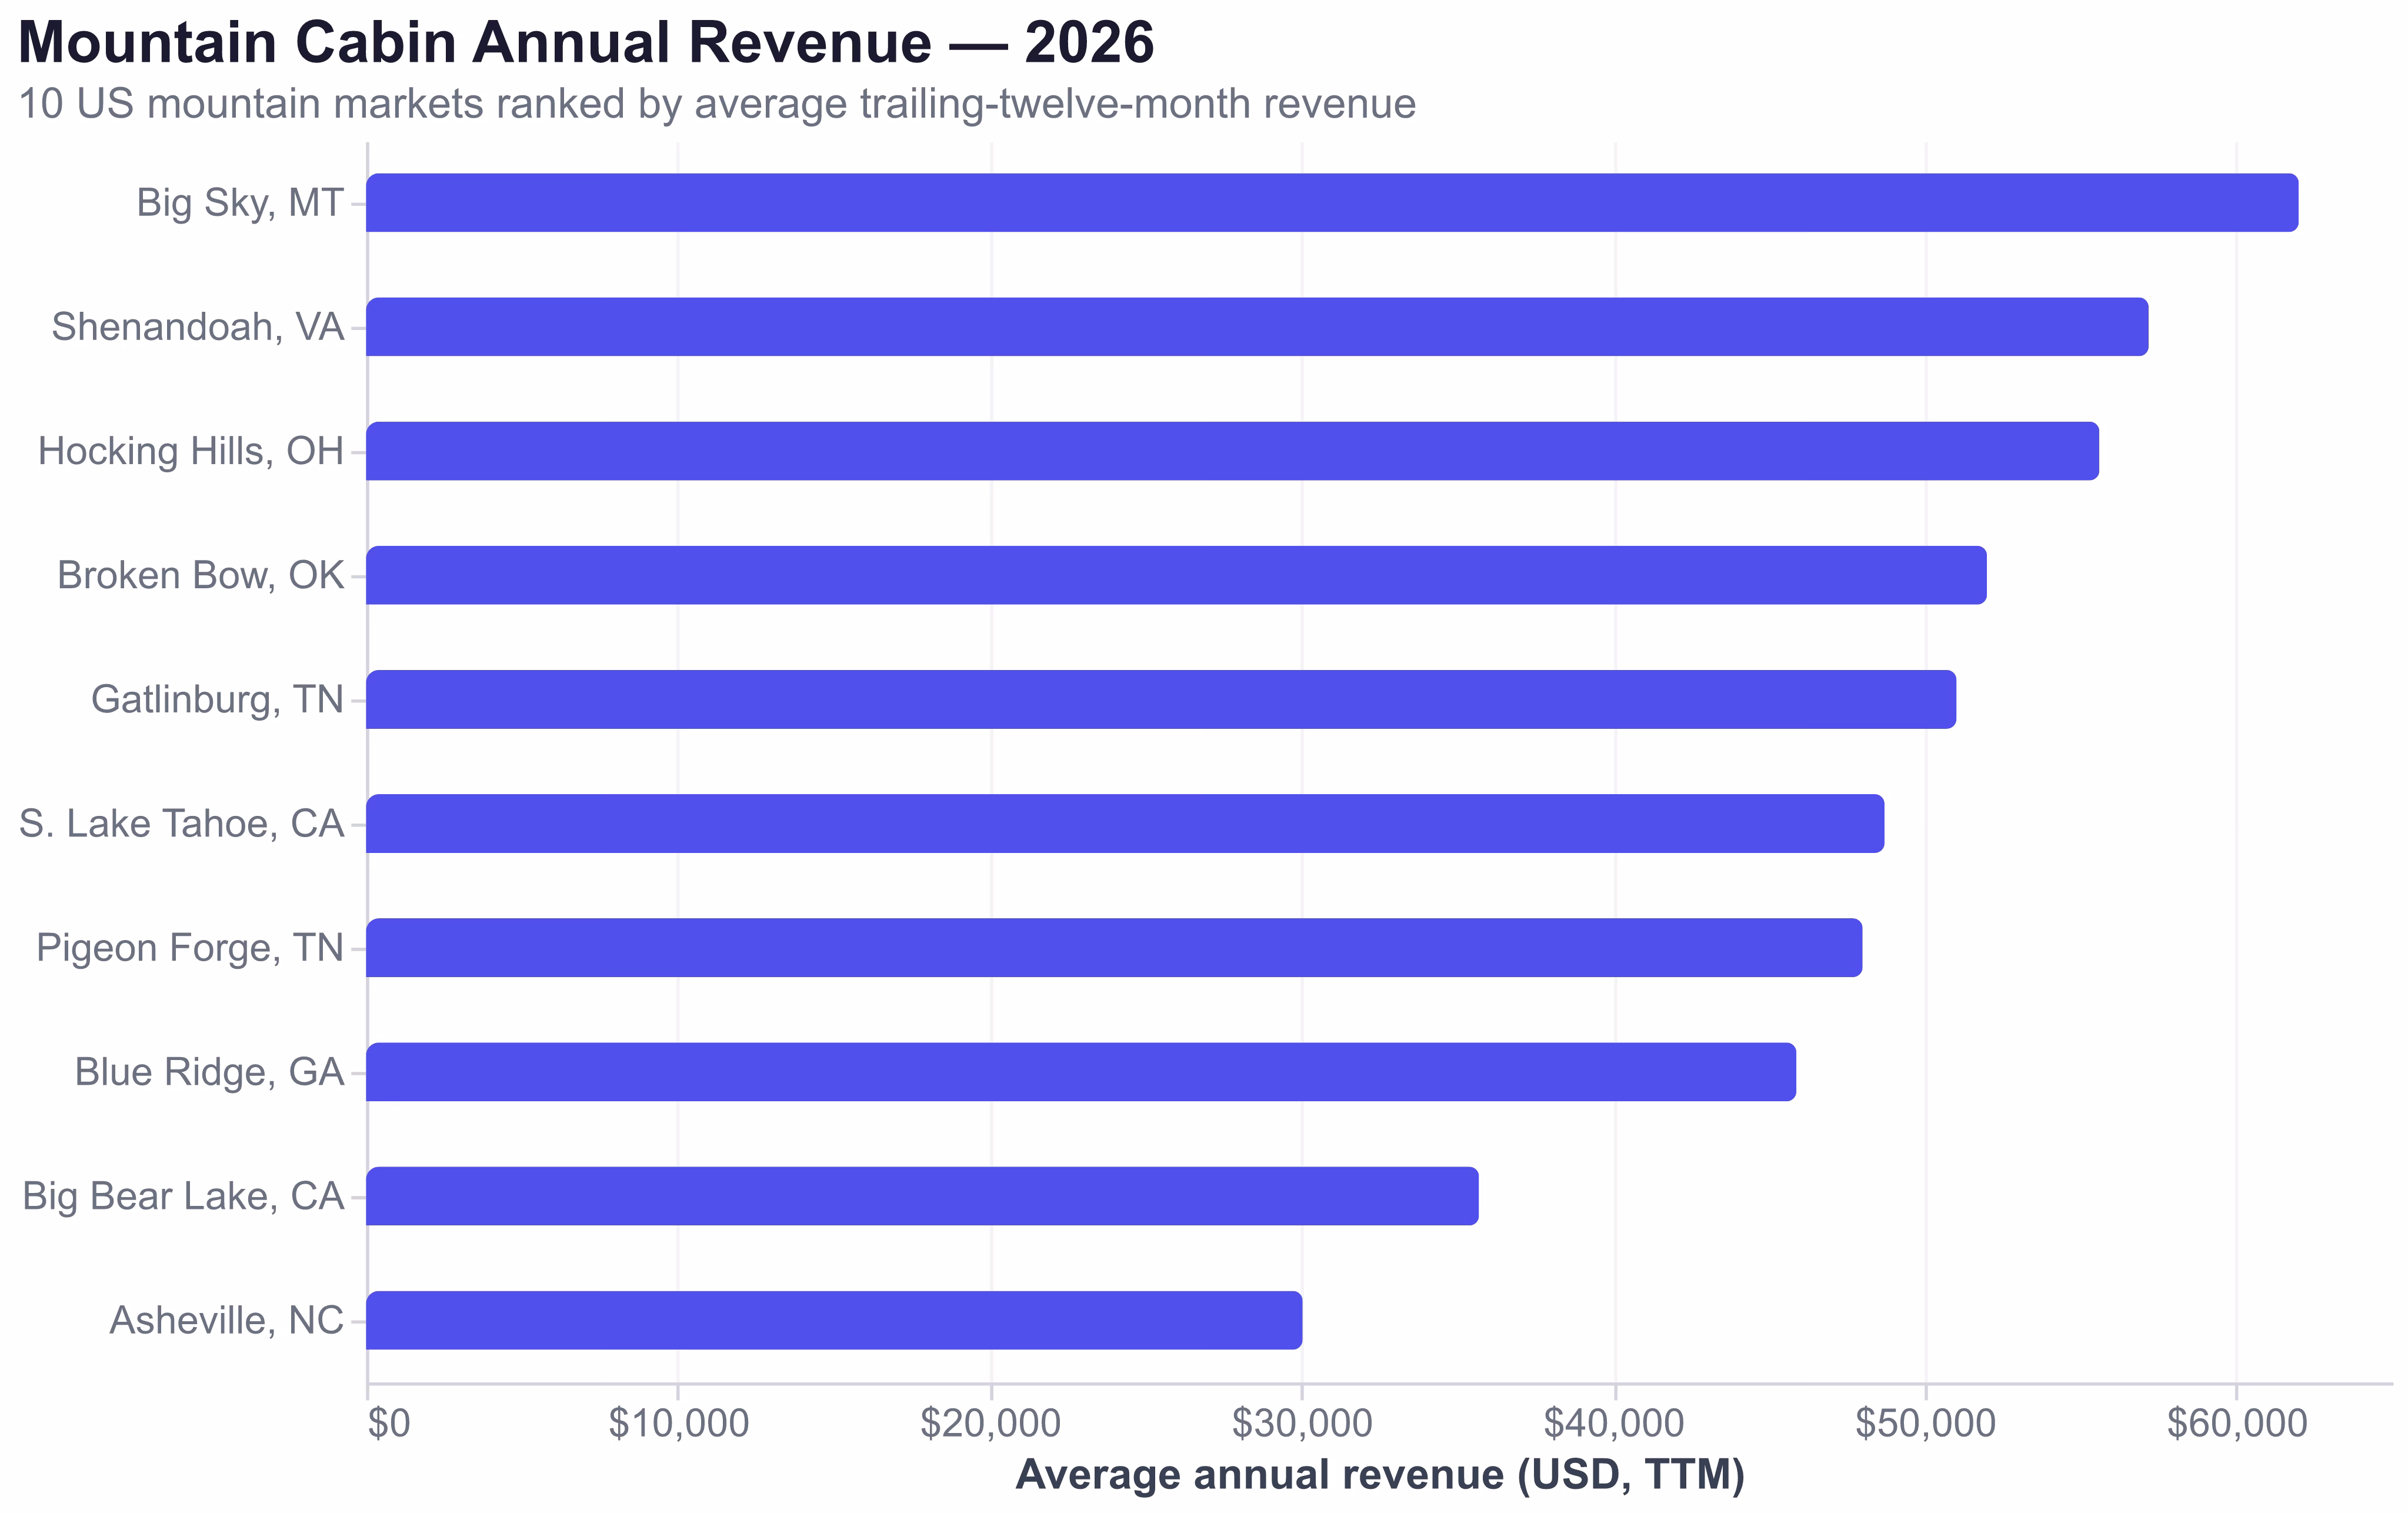
Big Sky, Montana commands the highest revenue at $62,011 TTM, driven by an extraordinary $818 ADR -- more than double most cabin markets. But that headline number masks a 35% occupancy rate, meaning the property sits empty nearly two-thirds of the year. The revenue is concentrated in a brutal ski-season window.
Shenandoah, Virginia and Hocking Hills, Ohio present the most intriguing value proposition. Both deliver $55K-$57K annual revenue with far fewer competing listings -- 103 and 702 respectively, compared to 2,800+ in Gatlinburg or Broken Bow. These are undersupplied cabin markets where new inventory can still capture above-average returns.
Asheville, North Carolina sits at the bottom despite strong tourism fundamentals. At $260 ADR and $30,051 TTM revenue, Asheville's 1,891 listings compete for a demand pool that favors urban experiences over cabin stays. The market's strength is in boutique homes and downtown condos rather than traditional mountain cabins. Post-Hurricane Helene rebuilding in late 2024 also disrupted the market's trajectory.
South Lake Tahoe delivers the second-highest RevPAR at $217, but regulatory constraints limit its investment appeal. A mandatory 8.4-night minimum stay average reflects local ordinances designed to curb short-term rental activity. Tahoe's $554 ADR rewards the hosts who remain, but the regulatory ceiling means new entrants face permitting uncertainty.
The Bedroom Count Sweet Spot: Why Bigger Cabins Earn Exponentially More
Cabin revenue doesn't scale linearly with bedroom count -- it accelerates. AirROI data filtered by bedroom count in Gatlinburg and Broken Bow reveals that adding bedrooms compounds revenue at a rate that far exceeds the incremental cost of extra square footage.
Gatlinburg, Tennessee
| Bedrooms | ADR | Occupancy | TTM Revenue | Active Listings |
|---|---|---|---|---|
| 2BR | $276 | 48% | $36,187 | 1,092 |
| 4BR | $507 | 46% | $68,381 | 442 |
| 6BR+ | $1,016 | 43% | $138,630 | 174 |
Broken Bow, Oklahoma
| Bedrooms | ADR | Occupancy | TTM Revenue | Active Listings |
|---|---|---|---|---|
| 2BR | $323 | 38% | $35,834 | 611 |
| 4BR | $575 | 37% | $63,481 | 429 |
| 6BR+ | $1,118 | 38% | $131,810 | 194 |
Source: AirROI bedroom-filtered market data, April 2026
The pattern is consistent across both markets. A 6BR+ cabin in Gatlinburg generates $138,630 annually -- 3.8x what a 2BR cabin earns. In Broken Bow, the ratio is 3.7x. Crucially, occupancy barely declines as bedroom count rises. The revenue gap is almost entirely driven by ADR: groups and families willingly pay $1,000+ per night for large cabins that sleep 12-16 guests because the per-person cost ($65-$85/person/night) remains reasonable.
The competition dynamics reinforce this advantage. Gatlinburg has 1,092 two-bedroom cabins competing for bookings but only 174 six-bedroom-plus cabins. Fewer competitors, higher rates, comparable occupancy -- the math favors going big.
The Hot Tub Premium Is Real: $3,800-$9,700 Per Year by Market
"Properties with hot tubs command a 20-25% higher average daily rate compared to similar properties without them. In mountain markets specifically, that premium can hit 34% on RevPAR." -- SkyRun Vacation Rentals
AirROI data quantifies the hot tub revenue premium across seven mountain markets by comparing all listings against hot tub-filtered listings in each market.
| Market | Revenue (All) | Revenue (Hot Tub) | Premium | % Lift |
|---|---|---|---|---|
| Big Bear Lake, CA | $35,711 | $45,426 | +$9,715 | +27.2% |
| Big Sky, MT | $62,011 | $69,199 | +$7,188 | +11.6% |
| S. Lake Tahoe, CA | $48,722 | $55,883 | +$7,161 | +14.7% |
| Gatlinburg, TN | $51,030 | $56,566 | +$5,536 | +10.8% |
| Pigeon Forge, TN | $48,018 | $53,154 | +$5,136 | +10.7% |
| Broken Bow, OK | $52,009 | $56,141 | +$4,132 | +7.9% |
| Blue Ridge, GA | $45,893 | $49,709 | +$3,816 | +8.3% |
Source: AirROI amenity-filtered market data, April 2026
Big Bear Lake shows the largest hot tub premium at +$9,715 per year (+27.2%). California mountain markets generally deliver outsized hot tub returns because the amenity serves as a year-round demand generator -- cold winter nights, cool mountain evenings even in July, and the "experience economy" appeal of an outdoor hot tub with mountain views.
The hot tub also functions as a search filter accelerator. "Hot tub" is among the most-used filters on both Airbnb and Vrbo. Listings without one are filtered out of searches before a guest ever sees the property, making the revenue premium understated -- it doesn't capture the bookings that never had a chance to happen.
Seasonality: The Mountain Market Risk Factor Nobody Talks About
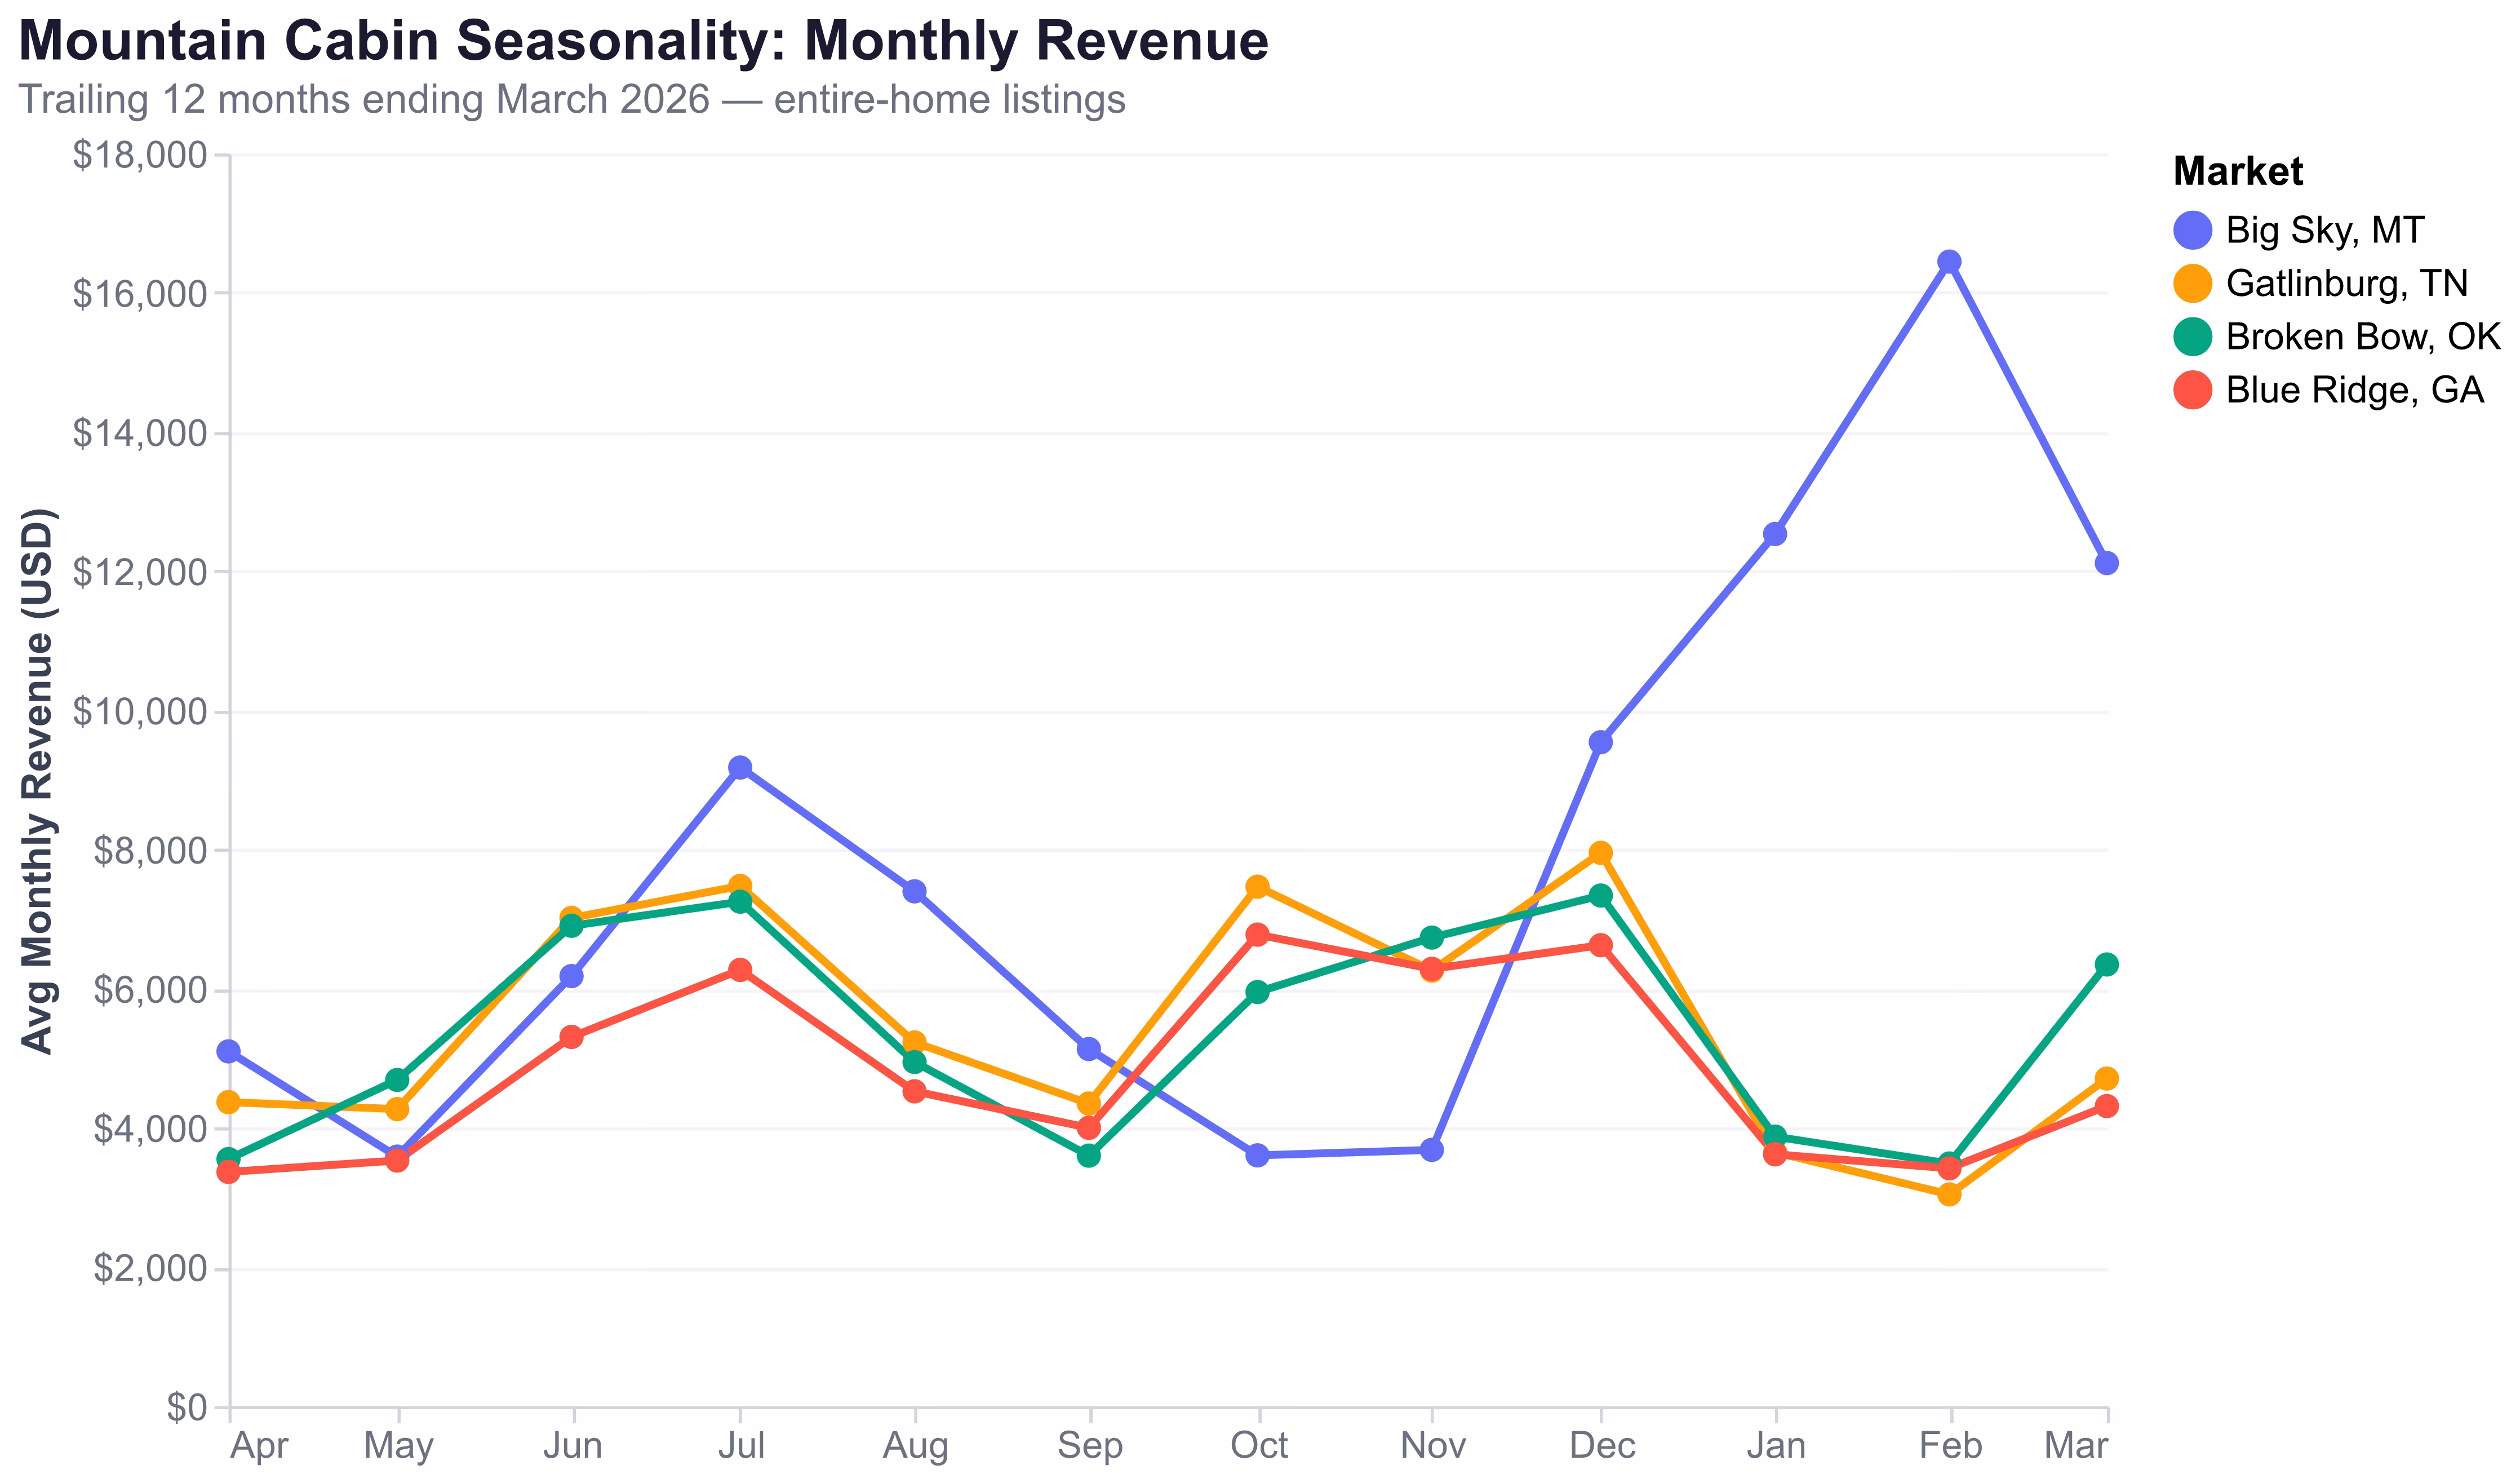
Revenue timing matters as much as revenue magnitude. A cabin generating $50,000 annually with steady monthly income operates very differently from one that earns $16,000 in February and $3,000 in October. The peak-to-trough ratio measures this risk, and it varies dramatically across mountain markets.
Big Sky: Ski-Season Concentration (4.6x ratio)
Big Sky's average monthly revenue swings from $16,410 in February (peak ski season) to $3,591 in October -- a 4.6x peak-to-trough ratio. December through March accounts for roughly 54% of annual revenue. Investors who carry a mortgage on a Big Sky cabin need sufficient reserves to cover eight months of reduced income. The $818 ADR is exceptional, but it functionally exists only four months per year.
Hocking Hills: The Steadiest Cabin Market (2.7x ratio)
Logan, Ohio (the Hocking Hills area) delivers the flattest revenue curve in this analysis. Monthly revenue ranges from $2,992 (February) to $7,944 (July) -- a 2.7x ratio. There is no single dominant season; instead, demand distributes across summer hiking, fall foliage, and winter cabin getaway weekends. At $55,615 annual revenue with only 702 competing listings, Hocking Hills merits serious attention from risk-conscious cabin investors.
Gatlinburg: Dual-Peak Advantage (2.6x ratio)
Gatlinburg benefits from dual revenue peaks -- October fall foliage ($7,385 average) and July summer tourism ($7,372 average) -- with a December holiday spike ($7,797) creating a third peak. The trough sits at $3,030 in February, producing a 2.6x ratio. This multi-season demand profile makes Gatlinburg one of the more predictable cabin revenue markets despite its massive supply of 3,618 listings.
Broken Bow: Three-Season Strength (2.1x ratio)
Broken Bow exhibits the lowest peak-to-trough ratio in this analysis at 2.1x ($7,391 December peak vs $3,514 February trough). The market benefits from fall foliage (October-November), summer lake season (June-July), and a strong spring break shoulder (March). This three-season demand profile, combined with minimal winter weakness, makes Broken Bow's revenue among the most consistent for cabin investors.
International Perspective: Mountain Cabins Beyond the US
While this analysis focuses on US mountain markets, international cabin destinations provide useful context. The Swiss Alps, Canadian Rockies (Canmore and Banff), and Japanese ski towns (Niseko, Hakuba) represent mature mountain rental markets with distinct characteristics.
Canadian Rockies -- Canmore, Alberta hosts 756+ Airbnb listings catering to Banff National Park visitors. Canadian mountain markets generally achieve lower ADR in USD terms but benefit from favorable exchange rates for US-based investors and year-round demand from both ski season and summer hiking.
Japanese ski towns -- Niseko has emerged as a major international cabin destination with Australian and Asian demand driving development. ADRs during ski season rival Big Sky at $600-$1,000+ per night, but the off-season drops more steeply. The market demonstrates that cabin investing is a global phenomenon with similar dynamics -- seasonality risk, amenity premiums, and bedroom count scaling -- regardless of geography.
The core lesson from international markets: multi-season demand is the single best predictor of sustainable cabin returns, whether the cabin sits in the Smokies, the Ouachitas, or the Alps.
The Breakout Market: Broken Bow, Oklahoma
Broken Bow has gone from a virtually unknown southeastern Oklahoma town to one of the largest cabin rental markets in the United States, with 2,878 active listings generating $52,009 average annual revenue. The transformation took roughly a decade.
"Luxury cabins in Broken Bow perform well, with 75% occupancy rates and ADRs of $250-$450 depending on size and amenities. Properties with hot tubs, game rooms, and lake access command the highest rates." -- GoWithSurge Oklahoma market analysis
Three structural advantages drive the Broken Bow cabin investment thesis:
Drive-to demand from four metros. Dallas (3 hours), Oklahoma City (3.5 hours), Tulsa (3 hours), and Little Rock (3.5 hours) collectively represent 10+ million residents within a half-day drive. This built-in audience seeks weekend cabin escapes, and Broken Bow has positioned itself as the primary destination for the DFW market in particular.
Booking lead times in Broken Bow average 47 days -- shorter than Gatlinburg's 57 days or Big Sky's 79 days -- reflecting the market's drive-to, weekend-getaway character. Guests book impulsively for Friday-Sunday cabin trips rather than planning months-ahead ski vacations. This shorter lead time means dynamic pricing responsiveness matters more here than in markets with longer planning horizons.
What This Means for Cabin Investors in 2026
The data sorts mountain cabin markets into three investment tiers:
Emerging markets (highest upside, highest uncertainty): Shenandoah VA (103 listings, $57K revenue) and Hocking Hills OH (702 listings, $56K revenue) are undersupplied relative to demand. New listings here face less competition but also less proven infrastructure.
Premium markets (highest revenue, highest risk): Big Sky MT and South Lake Tahoe CA command the highest ADRs ($818 and $554) but suffer from extreme seasonality and regulatory constraints. These markets reward luxury positioning but punish undercapitalized investors who can't weather four-month revenue troughs.
Across all tiers, three tactical principles emerge from the data:
-
Install a hot tub. The $3,800-$9,700 annual premium pays back the $5-8K installation cost within about two years in every market measured. No other single amenity delivers comparable ROI.
-
Target 4 bedrooms. The 4BR configuration balances strong absolute revenue ($63K-$68K) against manageable acquisition costs. The 6BR+ segment offers higher returns but requires $600K+ capital and longer booking lead times.
-
Prioritize multi-season markets. A 2.1x peak-to-trough ratio (Broken Bow) is fundamentally different from a 4.6x ratio (Big Sky) when you're making mortgage payments twelve months a year. Dual and triple-peak markets reduce cash flow risk.
Frequently Asked Questions
AirROI data across 10 US mountain markets shows average annual cabin revenue ranges from $30,051 (Asheville NC) to $62,011 (Big Sky MT). The typical mountain cabin generates $45,000-$52,000 annually, though revenue varies significantly by market, bedroom count, and amenities like hot tubs.
Broken Bow, Oklahoma emerges as the top value play with $52,009 average revenue, $469 ADR, and minimal STR regulation. For highest absolute revenue, Big Sky MT leads at $62,011 but requires higher entry costs. Logan OH (Hocking Hills) offers $55,615 revenue with only 702 competing listings.
Yes. AirROI data shows hot tub-equipped cabins earn 8-27% more annual revenue across 7 mountain markets. The premium is largest in Big Bear Lake CA at +$9,715 per year (+27%) and smallest in Blue Ridge GA at +$3,816 per year (+8%). At $5-8K installation cost, payback ranges from roughly 6 to 25 months.
Revenue scales non-linearly with bedroom count in cabin markets. In Gatlinburg, 6BR+ cabins earn $138,630 per year -- 3.8x more than 2BR cabins at $36,187. However, 4BR cabins at $68,381 represent the best balance of revenue, purchase price, and competition for most investors.
Broken Bow has emerged as one of the strongest cabin investment markets in the US with $52,009 average annual revenue, low regulation, and drive-to demand from Dallas, OKC, and Tulsa. The market hosts 2,878 active listings, and 4BR cabins with hot tubs generate over $63K annually.