Airbnb Pet-Friendly Revenue Premium: AirROI Data Shows 14-40% More Across 6 Markets
Pet-friendly Airbnb listings in Breckenridge, Colorado earn 40% more annual revenue than the market average -- $65,378 versus $46,676. That is $18,702 in additional income per year from a single policy change: allowing dogs. Hosts assume pets equal damage. The data tells a different story. Across six major U.S. markets, AirROI data reveals a consistent airbnb pet friendly revenue premium ranging from 14% in Nashville to 40% in Breckenridge, driven by a massive supply-demand imbalance: only 27% of Airbnb listings welcome pets, while 78% of American pet owners travel with their animals. The question is not whether the premium exists -- it does, in every market we analyzed. The question is whether your specific property and market make the tradeoff worth it.
The Pet-Friendly Revenue Premium: What AirROI Data Actually Shows
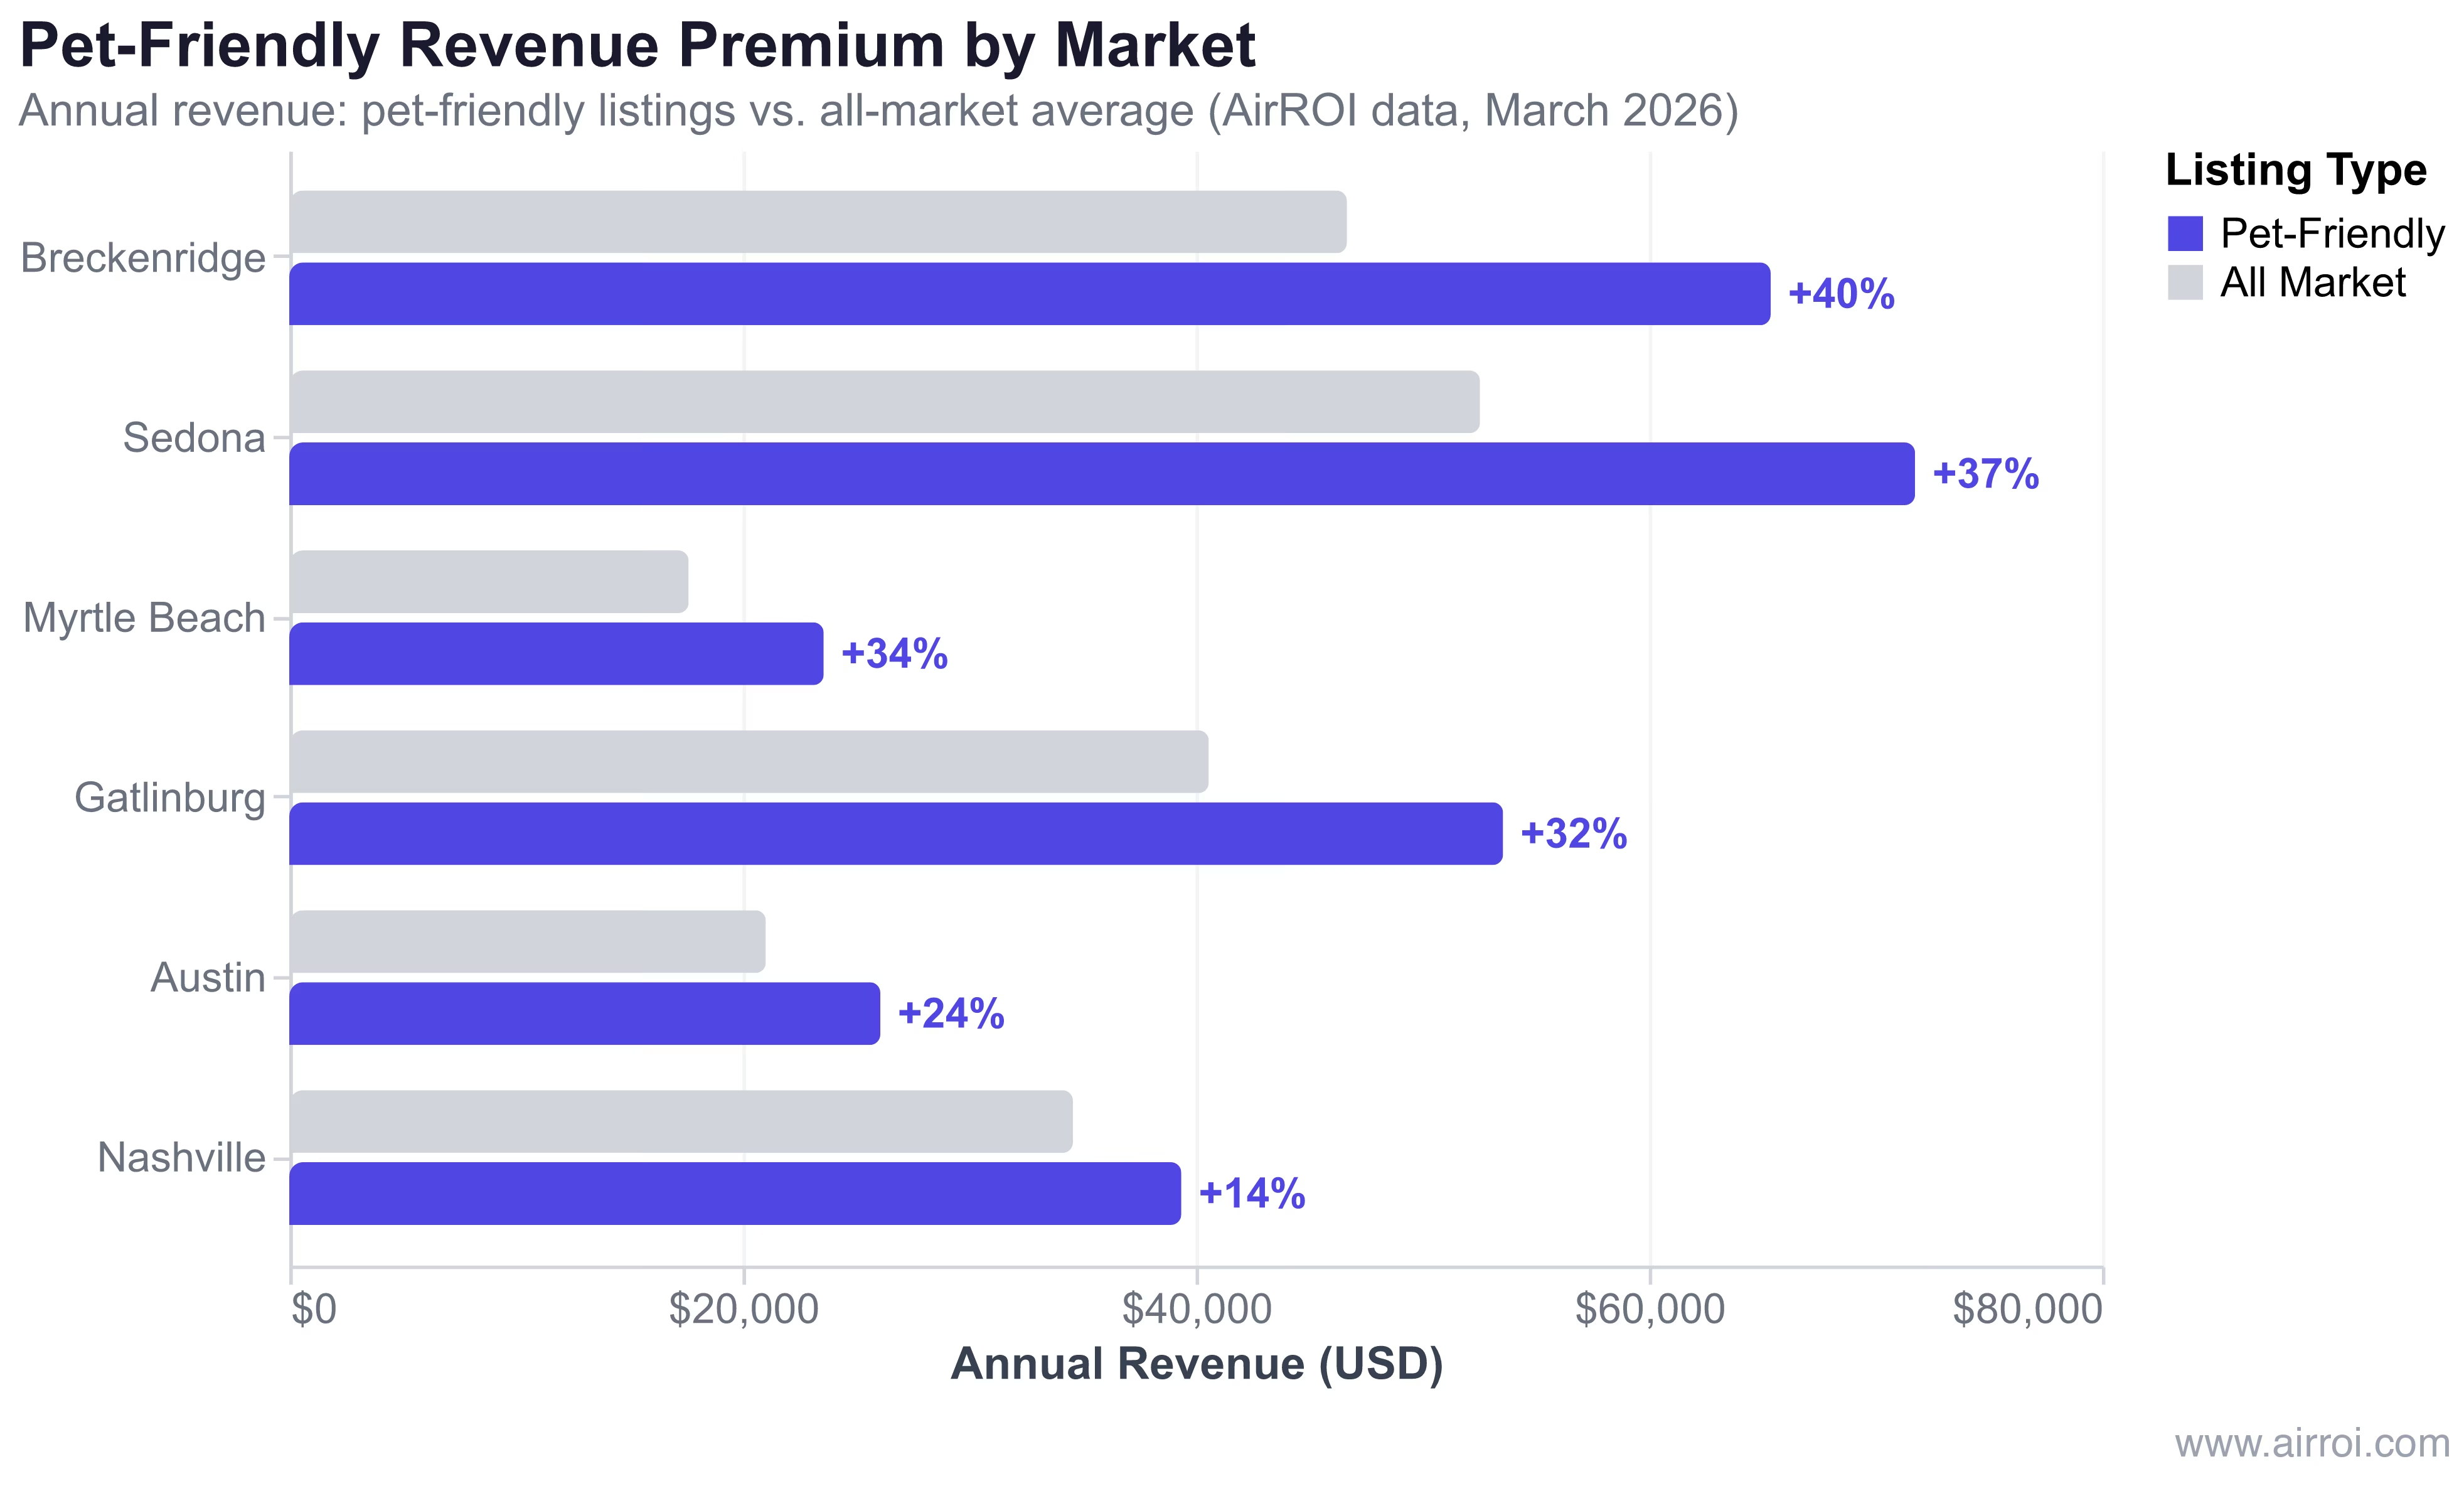
Pet-friendly listings outperform the broader market in every one of the six U.S. markets AirROI analyzed. The revenue premium ranges from $4,783 per year in Nashville to $19,198 in Sedona -- enough to replace substantial furnishings annually and still come out ahead.
Here is the complete market-by-market breakdown:
| Market | Pet-Friendly Revenue | All-Market Revenue | Premium (%) | Premium ($) |
|---|---|---|---|---|
| Breckenridge, CO | $65,378 | $46,676 | +40% | +$18,702 |
| Sedona, AZ | $71,751 | $52,553 | +37% | +$19,198 |
| Myrtle Beach, SC | $23,584 | $17,624 | +34% | +$5,960 |
| Gatlinburg, TN | $53,569 | $40,582 | +32% | +$12,987 |
| Austin, TX | $26,083 | $21,032 | +24% | +$5,051 |
| Nashville, TN | $39,366 | $34,583 | +14% | +$4,783 |
The premium is driven primarily by average daily rate (ADR), not occupancy. Pet-friendly listings command 2-7% higher nightly rates across all six markets. Occupancy gains are modest -- 1-3 percentage points -- but the combination of higher rates and slightly better occupancy compounds into significant annual revenue differences.
"Pet-friendly listings command a 15-20% higher ADR and see 10% higher occupancy, according to 2025 data." -- Gorodman, "The High-Yield Map: Where Airbnb Rental Yields Are Hitting 10% in 2026"
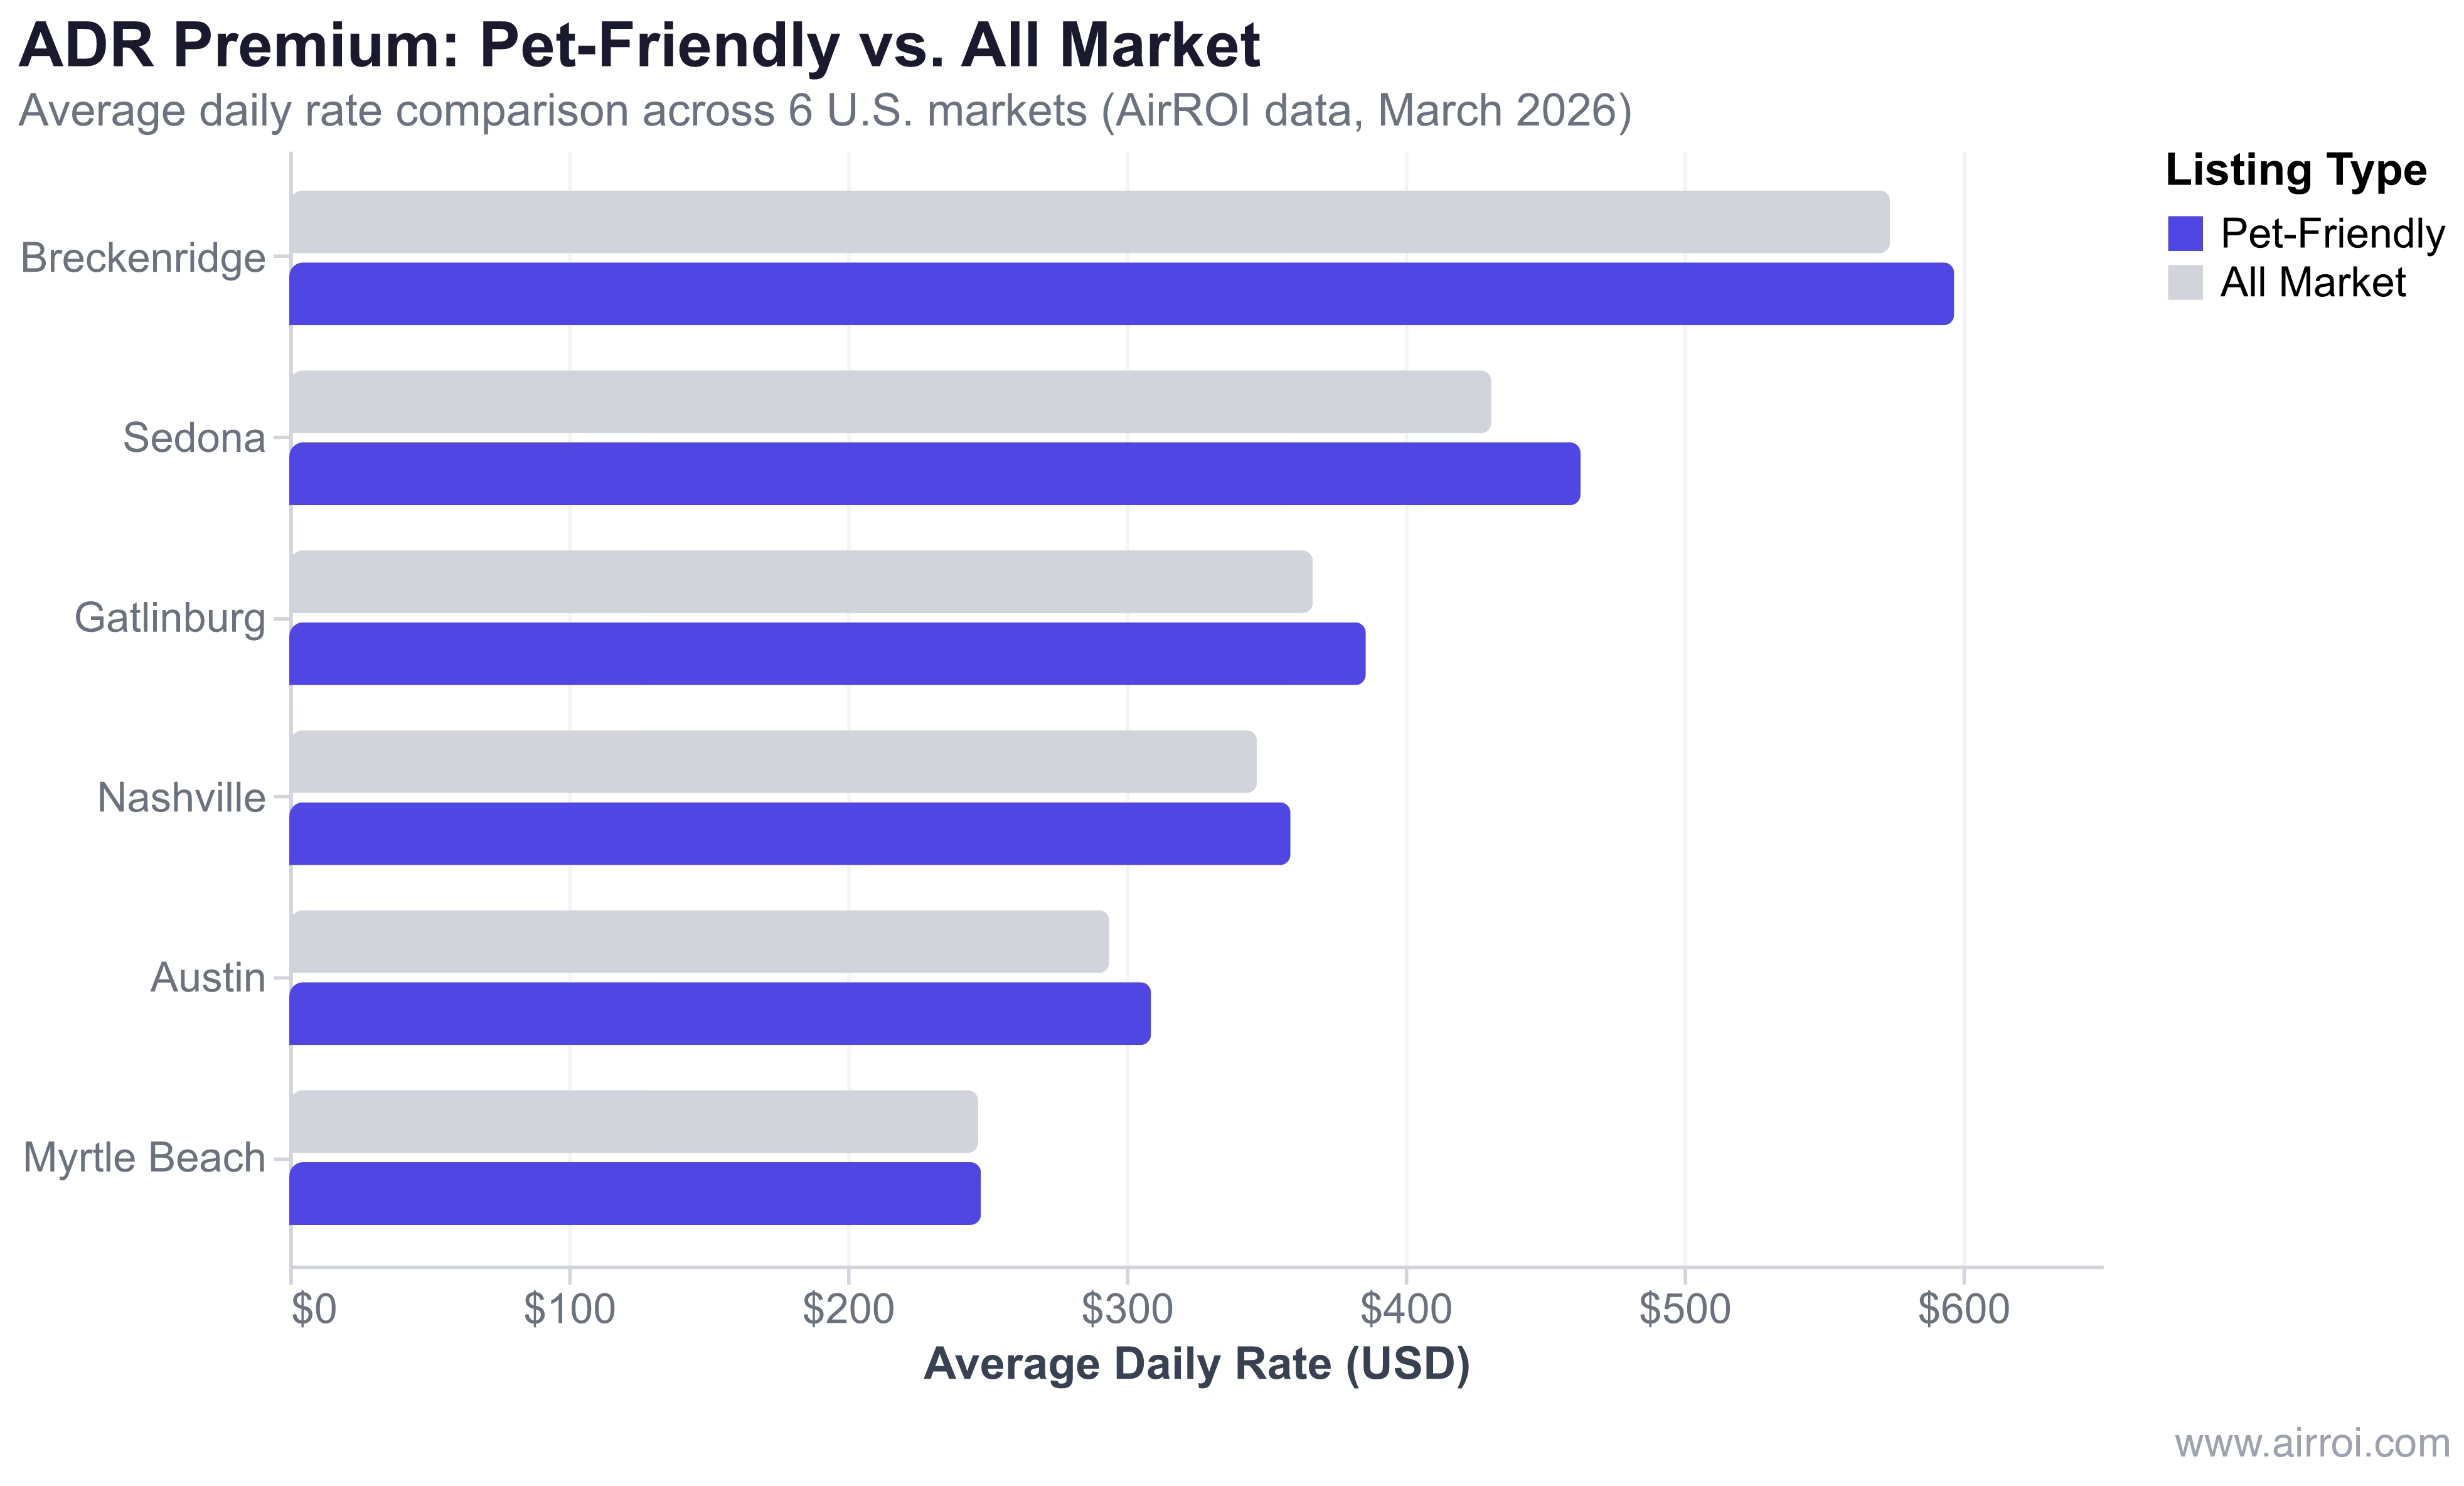
The ADR gap is clearest in high-ADR resort markets. Breckenridge pet-friendly listings average $597 per night versus $574 for the broader market. In Sedona, the gap is $463 versus $431. Even in Myrtle Beach, where the ADR difference is minimal ($248 vs $247), the occupancy lift from 42% to 45% drives a 34% revenue premium -- evidence that in high-supply beach markets, pet-friendliness functions as a booking differentiator rather than a rate multiplier.
Why the Premium Exists: Supply, Demand, and the Pet Travel Boom
The pet-friendly revenue premium is not random. It reflects a structural imbalance between the number of travelers who want pet-friendly stays and the number of hosts who offer them.
"Properties went from an average of 406 impressions per day to 521 impressions per day -- a 28% increase. Simply allowing pets can significantly boost your Airbnb visibility." -- Intellihost, analysis of 21,000 properties and 4.5 million data points
Pet owners also tend to be higher-value guests. They book further in advance to secure limited pet-friendly inventory, they stay longer on average (the leisure drive-to trips that dominate pet travel naturally skew toward multi-night stays), and they display stronger booking loyalty to hosts who welcome their animals.
The pet-friendly hotel market reflects this demand surge: The Business Research Company projects it will reach $7.29 billion by 2029, growing at a 12.2% compound annual growth rate. Airbnb reported a nearly 50% increase in nights booked with pets over recent years, confirming the trend extends beyond traditional hospitality.
Where the Pet Premium Is Strongest (and Where It Falls Flat)
Not all markets reward pet-friendliness equally. The AirROI data reveals a clear pattern: mountain, resort, and coastal drive-to markets deliver the strongest premiums, while urban markets show more modest returns.
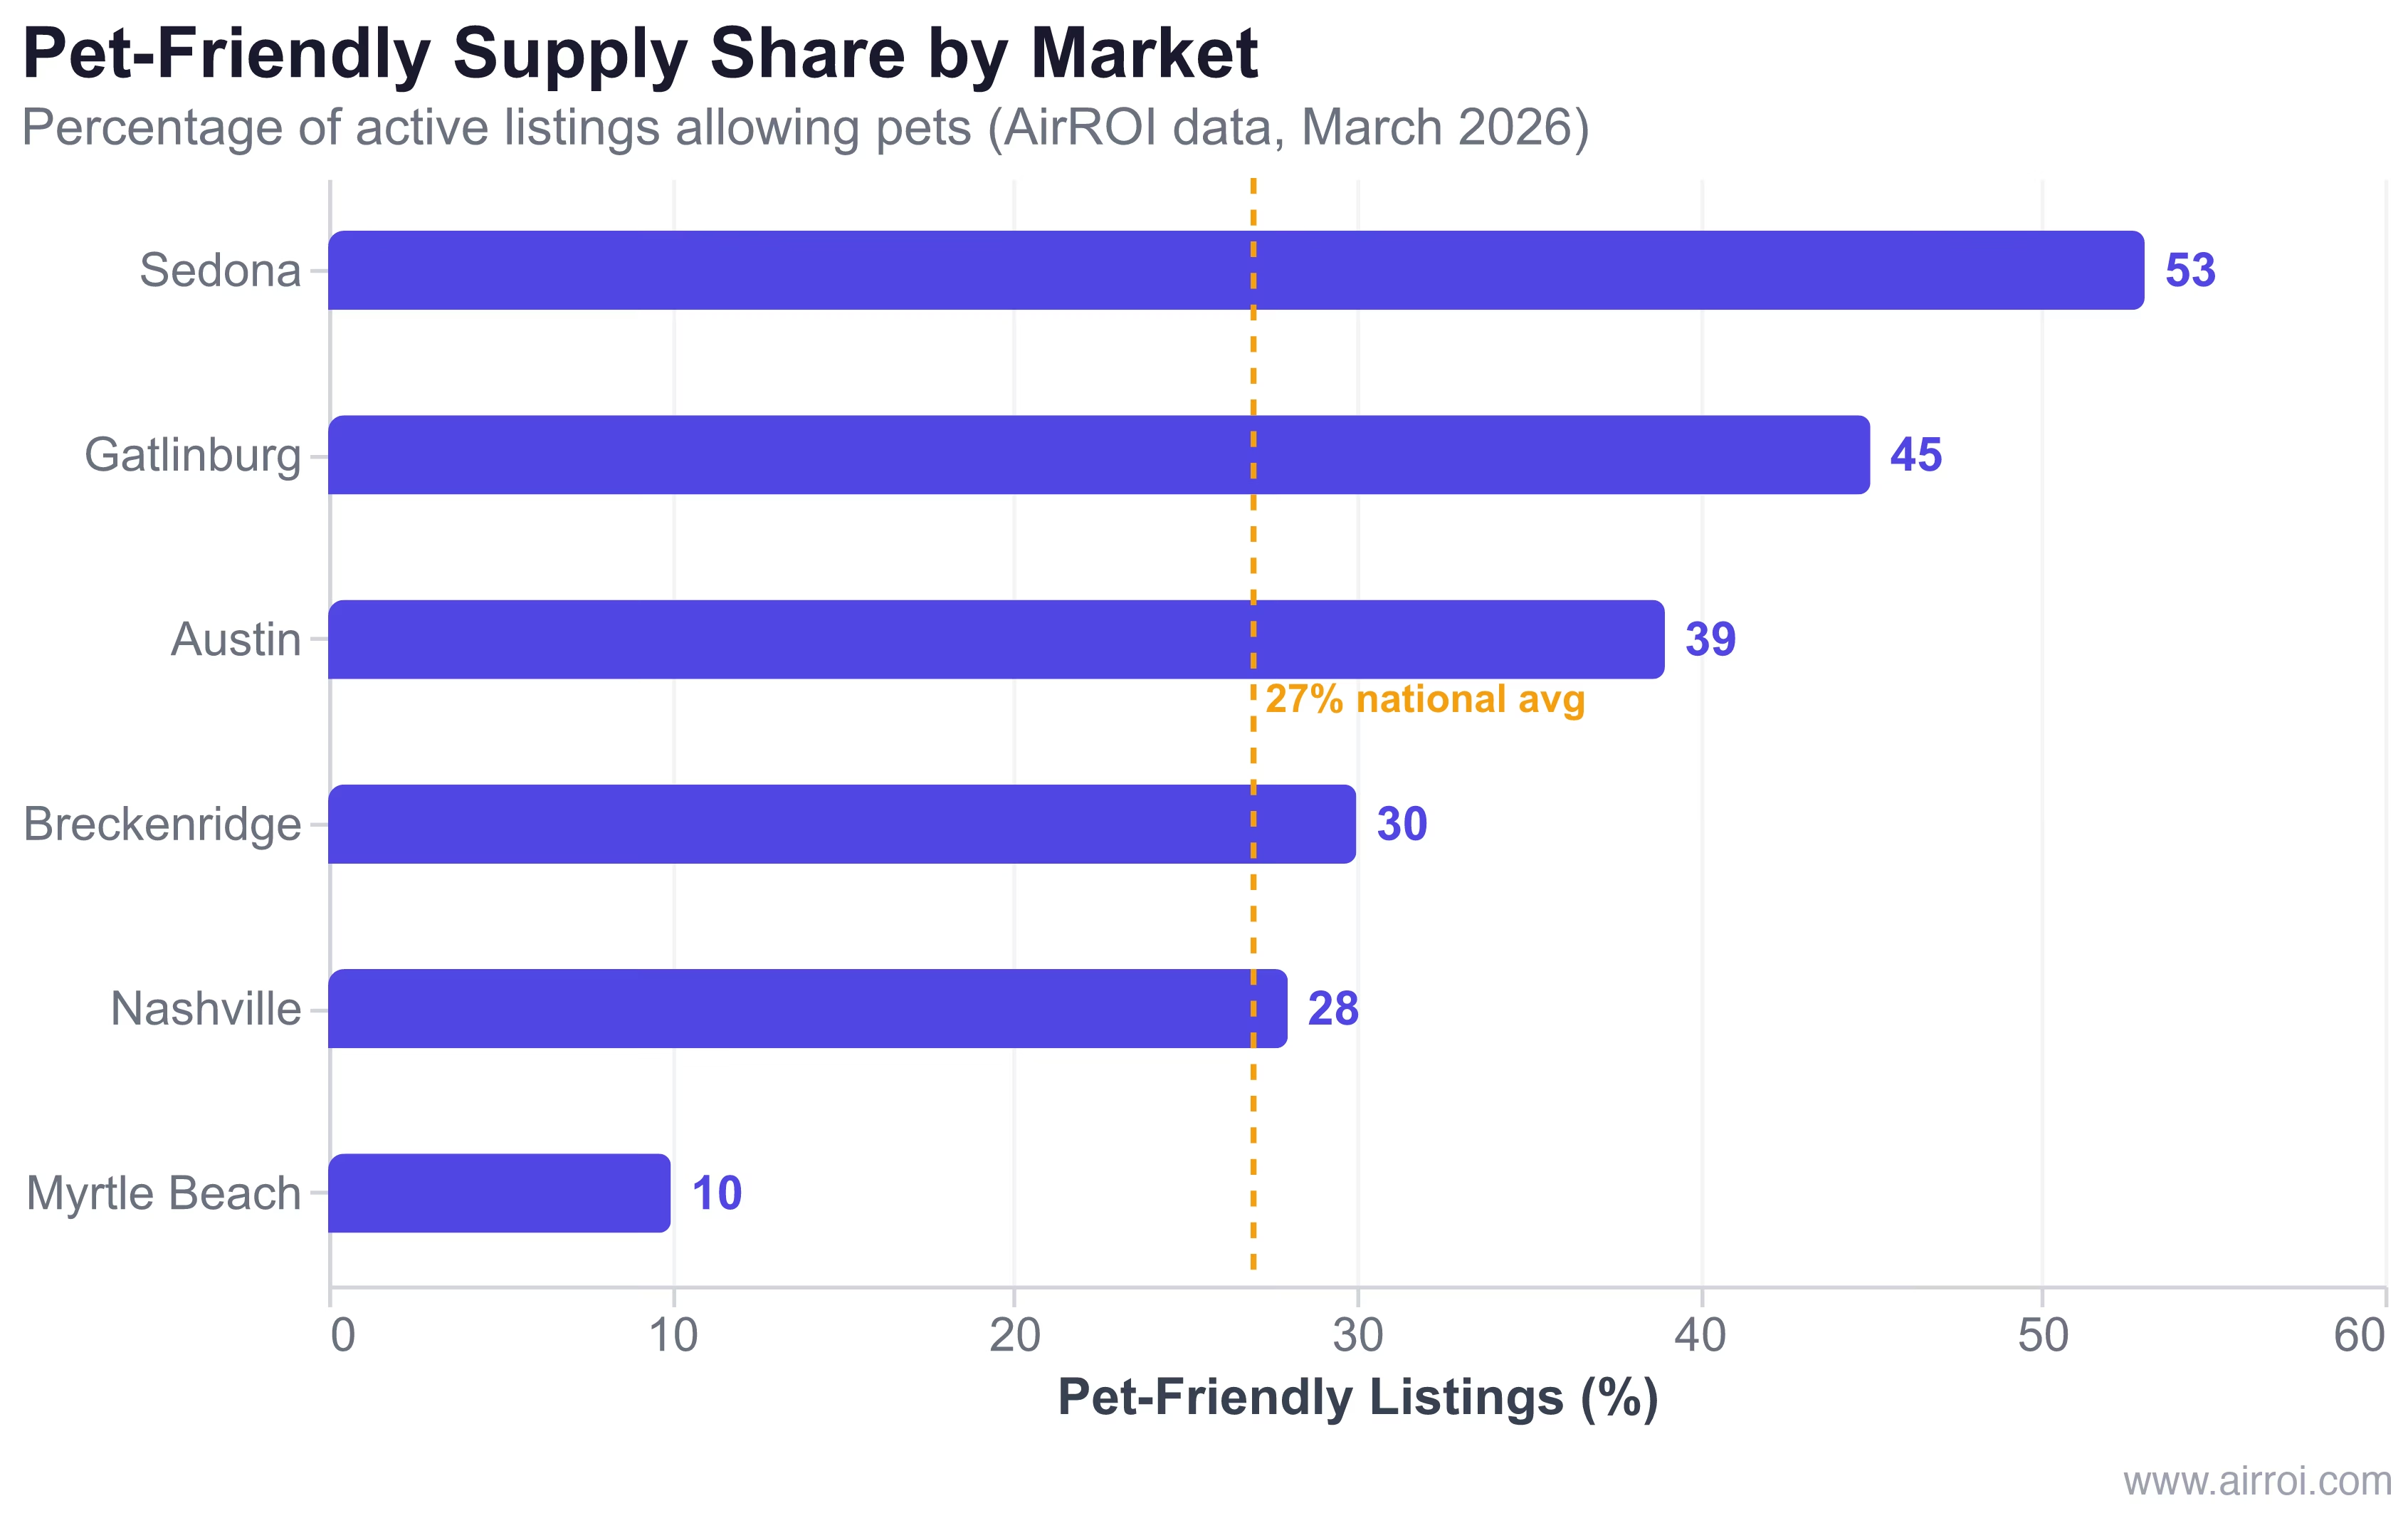
Coastal and beach markets (34% premium): Myrtle Beach delivers a 34% premium despite modest ADR differences because only 10% of its 8,146 listings allow pets. The scarcity effect is powerful: pet owners in a crowded beach market have extremely limited options, driving both occupancy and willingness to pay. Hosts with beach access and a fenced yard hold a competitive moat that most listings in the market cannot replicate.
Urban markets (14-24% premium): Austin (+24%) and Nashville (+14%) show the smallest premiums. Urban markets have higher listing density, more condos and apartments (which are harder to make pet-friendly), and less natural demand for pet travel. The Austin premium is stronger than Nashville because Austin has more house-format listings and a culture that skews dog-friendly. Nashville's 14% premium -- while still meaningful at nearly $4,800 per year -- reflects a tighter spread between pet-friendly and non-pet-friendly performance in a market with abundant options.
The takeaway: if you host in a mountain, cabin, or beach market, allowing pets is close to a no-brainer. In urban markets, the decision requires more property-specific evaluation.
Pet Fee Economics: What to Charge Without Killing Your Bookings
The revenue premium from pet-friendly listings is clear. But how should you structure pet fees to maximize that premium without deterring bookings?
According to BnB Facts' analysis of pet-friendly Airbnb listings, 77% charge no pet fee at all. These hosts absorb the incremental cleaning and wear costs into their base nightly rate, which eliminates a booking friction point. Of the 23% who do charge, the distribution is:
| Fee Structure | Typical Amount | Prevalence |
|---|---|---|
| Flat fee per stay | $50-$150 | Most common on Airbnb platform |
| Per-night fee | $10-$25/night | Common in house rules (89% charge $25 or less) |
| Per-pet fee | Varies | 41% of fee-charging hosts specify per-pet |
| No fee | $0 | 77% of pet-friendly listings |
The alternative strategy -- no visible fee, higher base rate -- has merit in competitive markets where price-sensitive guests filter by total cost. Pet owners already expect to pay more for accommodation; they are less likely to balk at a higher nightly rate than at an explicit pet surcharge that feels punitive.
The sweet spot for most hosts: A flat fee of $75-$150 per stay. This covers 2-3 turnovers' worth of extra cleaning, remains below the threshold that deters bookings, and is simple to implement through Airbnb's native fee tool. For hosts in high-premium markets like Breckenridge or Sedona, the revenue premium alone ($18,000-$19,000/year) dwarfs any fee structure optimization -- the priority is simply being listed as pet-friendly.
The Service Animal Catch: What ADA Rules Mean for Your Pet-Fee Revenue
The pet-friendly revenue premium comes with a caveat that frustrates hosts across the country: service animals bypass your pet policy entirely, and there is no reliable way to verify them.
- Is this a service animal required because of a disability?
- What work or task has the animal been trained to perform?
Hosts cannot request documentation, certification, or proof of training. They cannot charge a pet fee for service animals. And they cannot deny accommodation based on a service animal claim, except in owner-occupied listings with five or fewer sleeping rooms.
"If airlines are allowed to ask for service animal documentation, why can't we? It seems that all the guest has to do is claim it's service and we have no recourse whatsoever to challenge. There is no reason for anyone to pay for pet fees with this wide open loophole." -- Host on r/airbnb_hosts (65 upvotes, 164 comments)
The frustration is widespread. Multiple viral threads on r/airbnb_hosts and r/AirBnB document hosts encountering guests whose "service animals" display no task training, cause property damage, and are functionally indistinguishable from untrained pets. One thread with 104 upvotes and 267 comments captures the economic impact:
"Guests misuse the Airbnb service animal loophole to bring in their misbehaving, untrained pets and hosts cannot charge for the excess cleaning required to get rid of pet hair and urine and poop, and we rarely are repaid for pet damage." -- Host on r/AirBnB
There is a critical distinction, however. Emotional support animals (ESAs) are not service animals. Airbnb updated its policy to treat ESAs differently from ADA-protected service animals. Hosts can charge ESA owners a pet fee and can apply their no-pets rule to ESAs, unless they are in a jurisdiction that requires ESA accommodation (parts of New York and California have stricter local rules).
The practical mitigation: If service animal claims erode your pet-fee income, the most effective response is to build pet-related costs into your base nightly rate rather than relying on a fee you cannot always collect. This way, every booking -- regardless of whether the guest claims a service animal -- contributes to covering incremental pet costs. Airbnb's AirCover provides up to $3 million in damage protection for unexpected pet damage, including damage from service animals, through the Resolution Center.
The Pet-Friendly Decision Framework
Whether you should allow pets on Airbnb depends on three factors: your market type, your property characteristics, and your risk tolerance. Here is a data-driven framework for the decision.
Allow pets (strong yes): You host in a mountain, cabin, beach, or resort market (Gatlinburg, Sedona, Breckenridge, Myrtle Beach). Your property has durable flooring (tile, LVP, sealed hardwood), outdoor space or a fenced yard, and a property type that suits pet travel (house, cabin, cottage). The 32-40% revenue premium in these markets means even a major annual damage incident ($1,500-$2,000) leaves you $10,000+ ahead.
Consider a Gatlinburg cabin earning $40,582 annually. Switching to pet-friendly could lift revenue to approximately $53,569 -- a $12,987 increase. Invest under $500 in pet-proofing (washable couch covers, area rugs, enzymatic cleaners, pet bowls), charge a $100 flat pet fee, and the math works overwhelmingly in your favor.
Allow pets (conditional): You host in an urban market (Austin, Nashville, similar metros). Your property has durable flooring and some outdoor access, even a small patio. The 14-24% premium translates to $4,800-$5,000 per year -- meaningful but tighter. Evaluate whether your flooring can handle pet traffic. If you have carpet, consider upgrading to LVP ($2,500 for a 1-bedroom) before allowing pets. The flooring investment pays for itself within the first year through the revenue premium.
Consider not allowing pets: Your property has wall-to-wall carpet, no outdoor space, shared common areas (duplex or condo complex with pet-averse neighbors), or fragile furnishings you cannot easily replace. The urban premium of 14% may not justify the risk if one carpet replacement ($3,000-$5,000) can wipe out the annual gain.
Pet-proofing checklist for hosts allowing pets:
- Washable couch covers and throw blankets: $100-$200
- Rubber-backed area rugs for high-traffic zones: $100-$300
- Enzymatic pet stain and odor cleaner: $20-$30
- Pet bowls, waste bags, and welcome treats: $30-$50
- Clear house rules specifying pet size limits, restricted areas, and leash requirements
- Pre- and post-stay photo documentation for AirCover claims
Frequently Asked Questions
AirROI data across six U.S. markets shows pet-friendly listings earn 14-40% more annual revenue. The premium is highest in mountain and resort markets: Breckenridge (+40%, $18,702 more per year), Sedona (+37%, $19,198 more), and Gatlinburg (+32%, $12,987 more). Urban markets like Nashville see a smaller but still meaningful 14% premium.
Most hosts charging pet fees set them at $25 or less per night or under $150 flat per stay. However, 77% of pet-friendly Airbnb listings charge no fee at all, instead building the cost into a higher base nightly rate. BnB Facts data shows 89% of per-night fees are $25 or less. The optimal approach is a flat fee of $75-$150 to cover expected cleaning while remaining competitive.
No. Under ADA rules and Airbnb's accessibility policy, hosts cannot charge pet fees for service animals. Hosts may only ask two questions: whether the animal is required because of a disability and what task it has been trained to perform. There is no documentation or verification mechanism. Emotional support animals are treated differently -- hosts can charge ESA owners a pet fee or apply a no-pets rule unless local law requires otherwise.
Yes, modestly. AirROI data shows pet-friendly listings have 1-3 percentage points higher occupancy across most markets. The bigger revenue driver is ADR: pet-friendly listings command 2-7% higher nightly rates. Intellihost found that allowing pets increases daily listing impressions by 28%, translating to more bookings and fewer vacant nights.
Mountain and resort markets deliver the strongest pet premiums. AirROI data shows Breckenridge, CO (+40%), Sedona, AZ (+37%), Myrtle Beach, SC (+34%), and Gatlinburg, TN (+32%) as the top performers. These are drive-to vacation markets where guests frequently travel with dogs. Urban markets like Austin (+24%) and Nashville (+14%) show smaller but still positive premiums.