
Was 2026 a Better Year to Own an Airbnb? We Tracked 83,892

We followed 83,892 individual Airbnb listings across 20 US markets from one year to the next -- the same properties, compared against themselves. The median listing raised its nightly rate 12.0%, lost 18.3% of its booked nights, and finished the year 6.8% ahead on revenue. Nearly half of them, 47%, earned less than they had the year before.
This piece also comes with an unusual admission. We set out to test the supply claim at market level, and we could not. AirROI's own listing-count series failed our verification, and rather than publish numbers we do not trust, we are explaining why and withholding them. That failure is directly relevant to a short term rental supply slowdown 2026 narrative built on listing counts, including our own coverage of it in March.
What We Could Not Verify, and Why We Are Telling You
We planned to open this article with a market-by-market breakdown of airbnb supply growth 2026 market saturation -- which markets shed listings, which kept adding. We are not publishing those numbers, because they did not survive testing.
AirROI's listing counts are partitioned by city. Comparing our July 2025 and June 2026 snapshots on that basis, active listings appeared to grow in every single one of the 21 markets we tested, by between 9.5% and 35.1%. That uniformity was the first warning. Real markets do not all move the same direction by similar amounts.
Filtering the identical snapshots by county instead of city changed the picture completely:
| Market | City basis | County basis | Listings with no county value |
|---|---|---|---|
| Las Vegas, NV | +35.1% | -1.0% | 1,879 to 4,398 |
| Myrtle Beach, SC | +22.5% | -0.3% | 2,626 to 5,638 |
| Miami, FL | +20.3% | -0.5% | 1,441 to 5,102 |
| Dallas, TX | +17.5% | -1.4% | 448 to 2,379 |
| Austin, TX | +11.3% | -1.0% | 1,155 to 3,478 |
| Phoenix, AZ | +10.1% | -0.7% | 277 to 1,664 |
Source: AirROI listing snapshots, July 2025 vs June 2026
On a county basis the median market moved -0.5%, with every market between -3.3% and +2.3%. The apparent growth sits almost entirely in listings that acquired a city label without a county one -- a geocoding and coverage change, not new supply. Our separate market-level API series disagreed with the county figures too, correlating at just r = 0.20, which is to say barely at all.
Two independent bases that disagree this comprehensively cannot both be right, and we cannot currently tell which is closer to the truth. So we are not publishing supply-growth percentages, we are not ranking markets by them, and we are not claiming to have independently confirmed or refuted AirDNA's national +2.7% supply figure. That remains their finding, from their data.
This matters beyond one article. It is the same class of error that inflates a compelling story into a wrong one, and the honest response is to say so before someone else finds it.
We Argued a Version of This in March. Here Is What Changed.
The supply figures in that piece came from the same series we have just described. The March article reported year-over-year listing growth of 32.2% for Austin, 34.4% for Dallas and 45.3% for Gatlinburg. We are no longer confident in numbers of that construction. We are not withdrawing the article, but readers should treat its supply-growth percentages as unverified, and we would rather say so here than quietly leave them standing.
The deeper error was analytical. March treated supply growth as the primary driver of per-listing revenue. The panel evidence in this article points somewhere else: rate and demand moved per-listing outcomes far more than supply balance did, and they moved in opposite directions at once. A framework that reads "supply up, therefore revenue down" cannot describe a year in which the typical host raised price 12.0%, lost 18.3% of volume, and still finished ahead on revenue.
What held. The winner-take-all finding survived and strengthened. We argued in March that the gap between strong and weak listings was widening; measured on per-listing trailing-twelve-month RevPAR, the top-quartile-to-median spread widened in 19 of 20 markets, with the median ratio moving from 2.10x to 2.45x. Phoenix went from 2.38x to 3.02x, Denver from 2.32x to 2.89x, Austin from 2.40x to 2.93x. Market selection still dominates individual outcomes. That part we would write again.
The Method: Same Listings, Compared to Themselves
The fix for unstable listing counts is to stop counting listings and start following them.
We took every listing in 20 US markets that appeared in both our July 2025 and June 2026 snapshots with a full twelve months of trailing data in each -- 83,892 properties -- and compared each one against itself. The July 2025 snapshot covers the twelve months to July 2025; the June 2026 snapshot covers the twelve months to June 2026. The windows do not overlap.
This construction is immune to the problem described above. It does not matter how many listings entered or left a market, how they were geocoded, or whether coverage expanded, because the comparison never leaves the set of properties observed both times. If a market's average rises because better listings joined the sample, a matched panel will not show it.
One bias remains, and it runs in a known direction. A listing must survive into 2026 to be in the panel, so operators who quit are excluded. Survivors outperform quitters. Every figure below therefore understates the difficulty.
What Happened to the Typical Host
Rate went up almost universally. Volume went down almost as universally.
Across the panel, 81% of hosts raised their nightly rate, and the median increase was 12.0%. Average daily rate rose in all 20 markets. That is real pricing power, and it is the strongest confirmation of AirDNA's thesis in our data.
Then the other side. The median listing lost 4.58 percentage points of occupancy and 18.3% of its booked nights. Occupancy fell in 19 of 20 markets and nights booked fell in 19 of 20. Across the panel, mean nights booked dropped from 142.5 to 121.9 -- almost three fewer booked weeks per property per year.
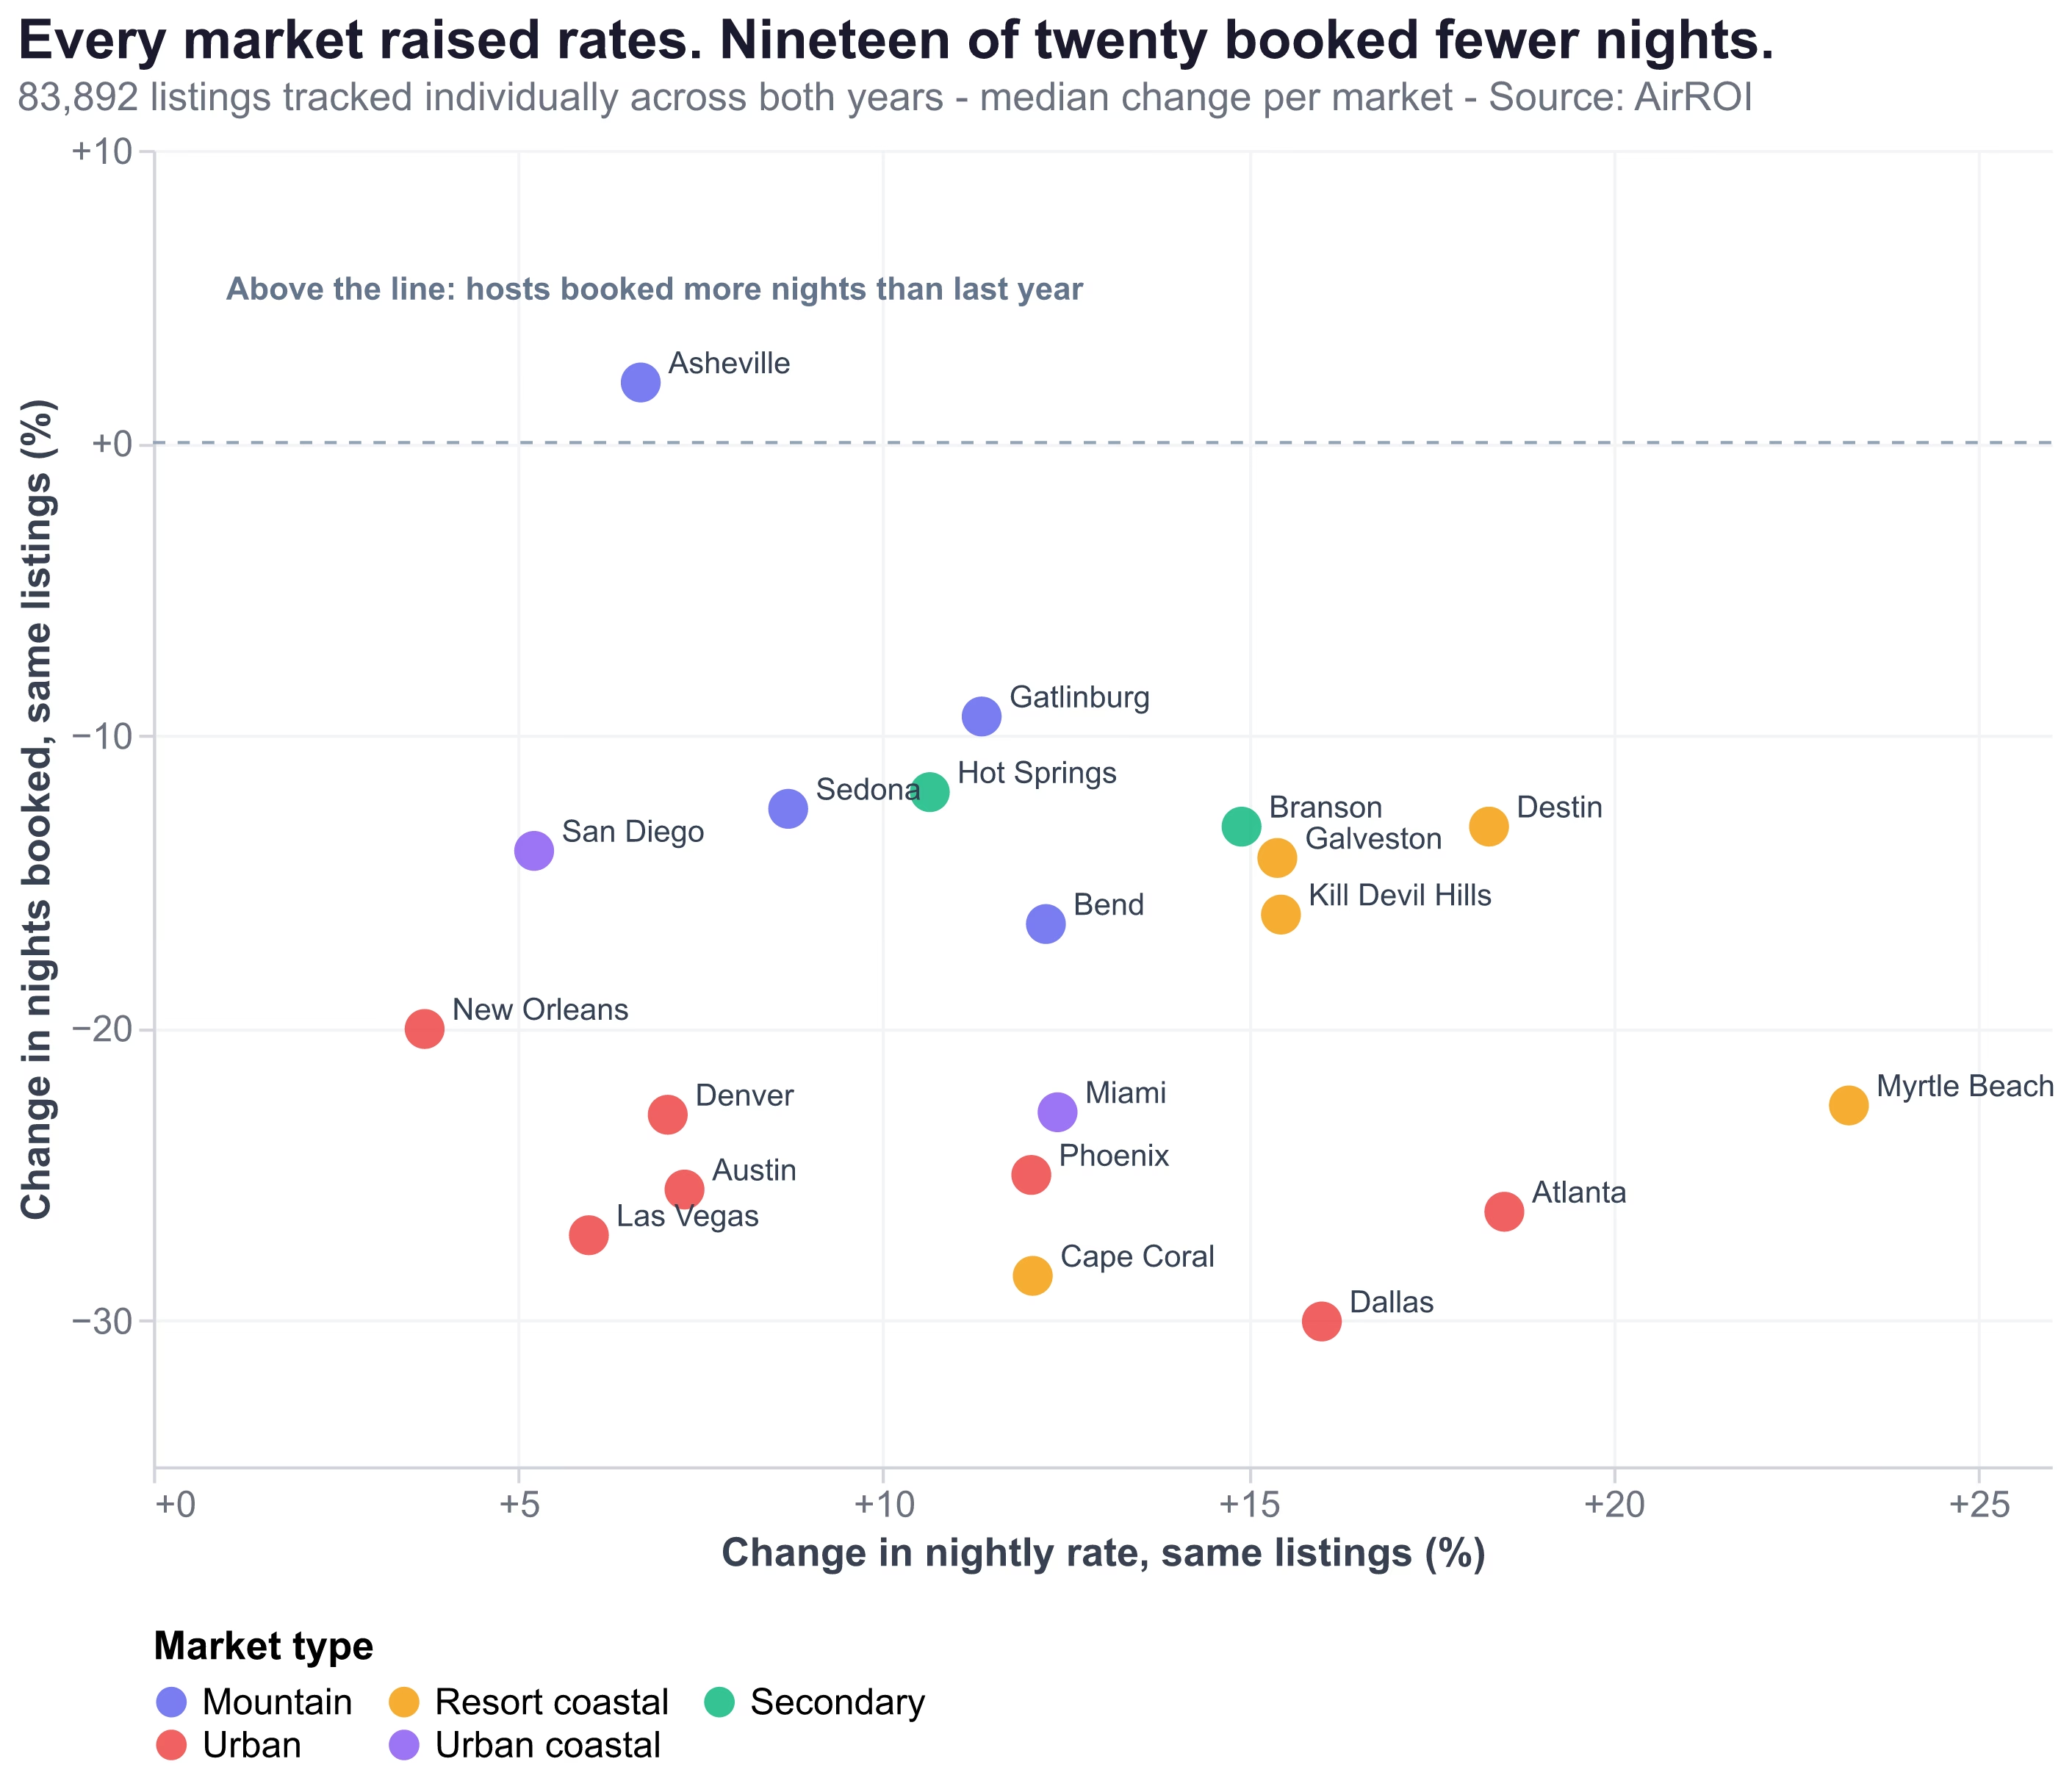
| Market | Type | Matched listings | Rate change | Occupancy change | Nights booked | Median revenue | Share earning less |
|---|---|---|---|---|---|---|---|
| Myrtle Beach, SC | Resort coastal | 6,616 | +23.2% | -5.26pp | -22.7% | +4.1% | 48% |
| Atlanta, GA | Urban | 5,381 | +18.5% | -4.73pp | -26.3% | +4.1% | 49% |
| Destin, FL | Resort coastal | 3,485 | +18.3% | -2.73pp | -13.1% | +16.6% | 40% |
| Dallas, TX | Urban | 3,681 | +16.0% | -8.65pp | -30.0% | -3.6% | 55% |
| Kill Devil Hills, NC | Resort coastal | 1,136 | +15.5% | -4.10pp | -16.1% | +7.8% | 43% |
| Galveston, TX | Resort coastal | 3,498 | +15.4% | -2.86pp | -14.2% | +14.7% | 40% |
| Branson, MO | Secondary | 2,692 | +14.9% | -3.19pp | -13.1% | +13.1% | 42% |
| Miami, FL | Urban coastal | 7,358 | +12.4% | -6.53pp | -22.9% | +5.4% | 49% |
| Bend, OR | Mountain | 1,865 | +12.2% | -4.64pp | -16.5% | +11.4% | 42% |
| Cape Coral, FL | Resort coastal | 3,853 | +12.1% | -6.31pp | -28.5% | -4.5% | 56% |
| Phoenix, AZ | Urban | 6,109 | +12.0% | -6.12pp | -25.0% | +7.1% | 50% |
| Gatlinburg, TN | Mountain | 3,319 | +11.3% | -2.62pp | -9.4% | +17.6% | 35% |
| Hot Springs, AR | Secondary | 1,287 | +10.6% | -3.00pp | -12.0% | +10.3% | 40% |
| Sedona, AZ | Mountain | 1,580 | +8.7% | -4.69pp | -12.5% | +11.7% | 40% |
| Austin, TX | Urban | 8,704 | +7.3% | -6.37pp | -25.5% | -6.0% | 57% |
| Denver, CO | Urban | 3,935 | +7.1% | -5.85pp | -23.0% | +1.3% | 52% |
| Asheville, NC | Mountain | 2,050 | +6.7% | +0.43pp | +2.1% | +28.9% | 37% |
| Las Vegas, NV | Urban | 2,799 | +6.0% | -3.06pp | -27.1% | -8.3% | 54% |
| San Diego, CA | Urban coastal | 9,447 | +5.2% | -2.84pp | -14.0% | +6.5% | 45% |
| New Orleans, LA | Urban | 5,097 | +3.7% | -4.52pp | -20.0% | +3.2% | 51% |
Source: AirROI, matched-listing panel, twelve months to July 2025 vs twelve months to June 2026. Median change per market.
Asheville is the exception in every column. It is the only market where occupancy rose, the only one where nights booked rose, and it posted the strongest revenue growth at +28.9%. Asheville is also still working through housing dislocation from Hurricane Helene's rebuilding, which plausibly removed rental stock for reasons unrelated to the STR cycle -- so we would not present it as a clean demonstration of what a supply squeeze does.
Almost Half of Established Hosts Went Backwards
Revenue growth for the median listing was +6.8%. The median share of listings losing revenue was 47%.
Those two numbers describe the same year, and the second is the more useful one. A typical-listing gain of 6.8% sounds like a decent outcome until you notice that the distribution behind it is close to a coin flip.
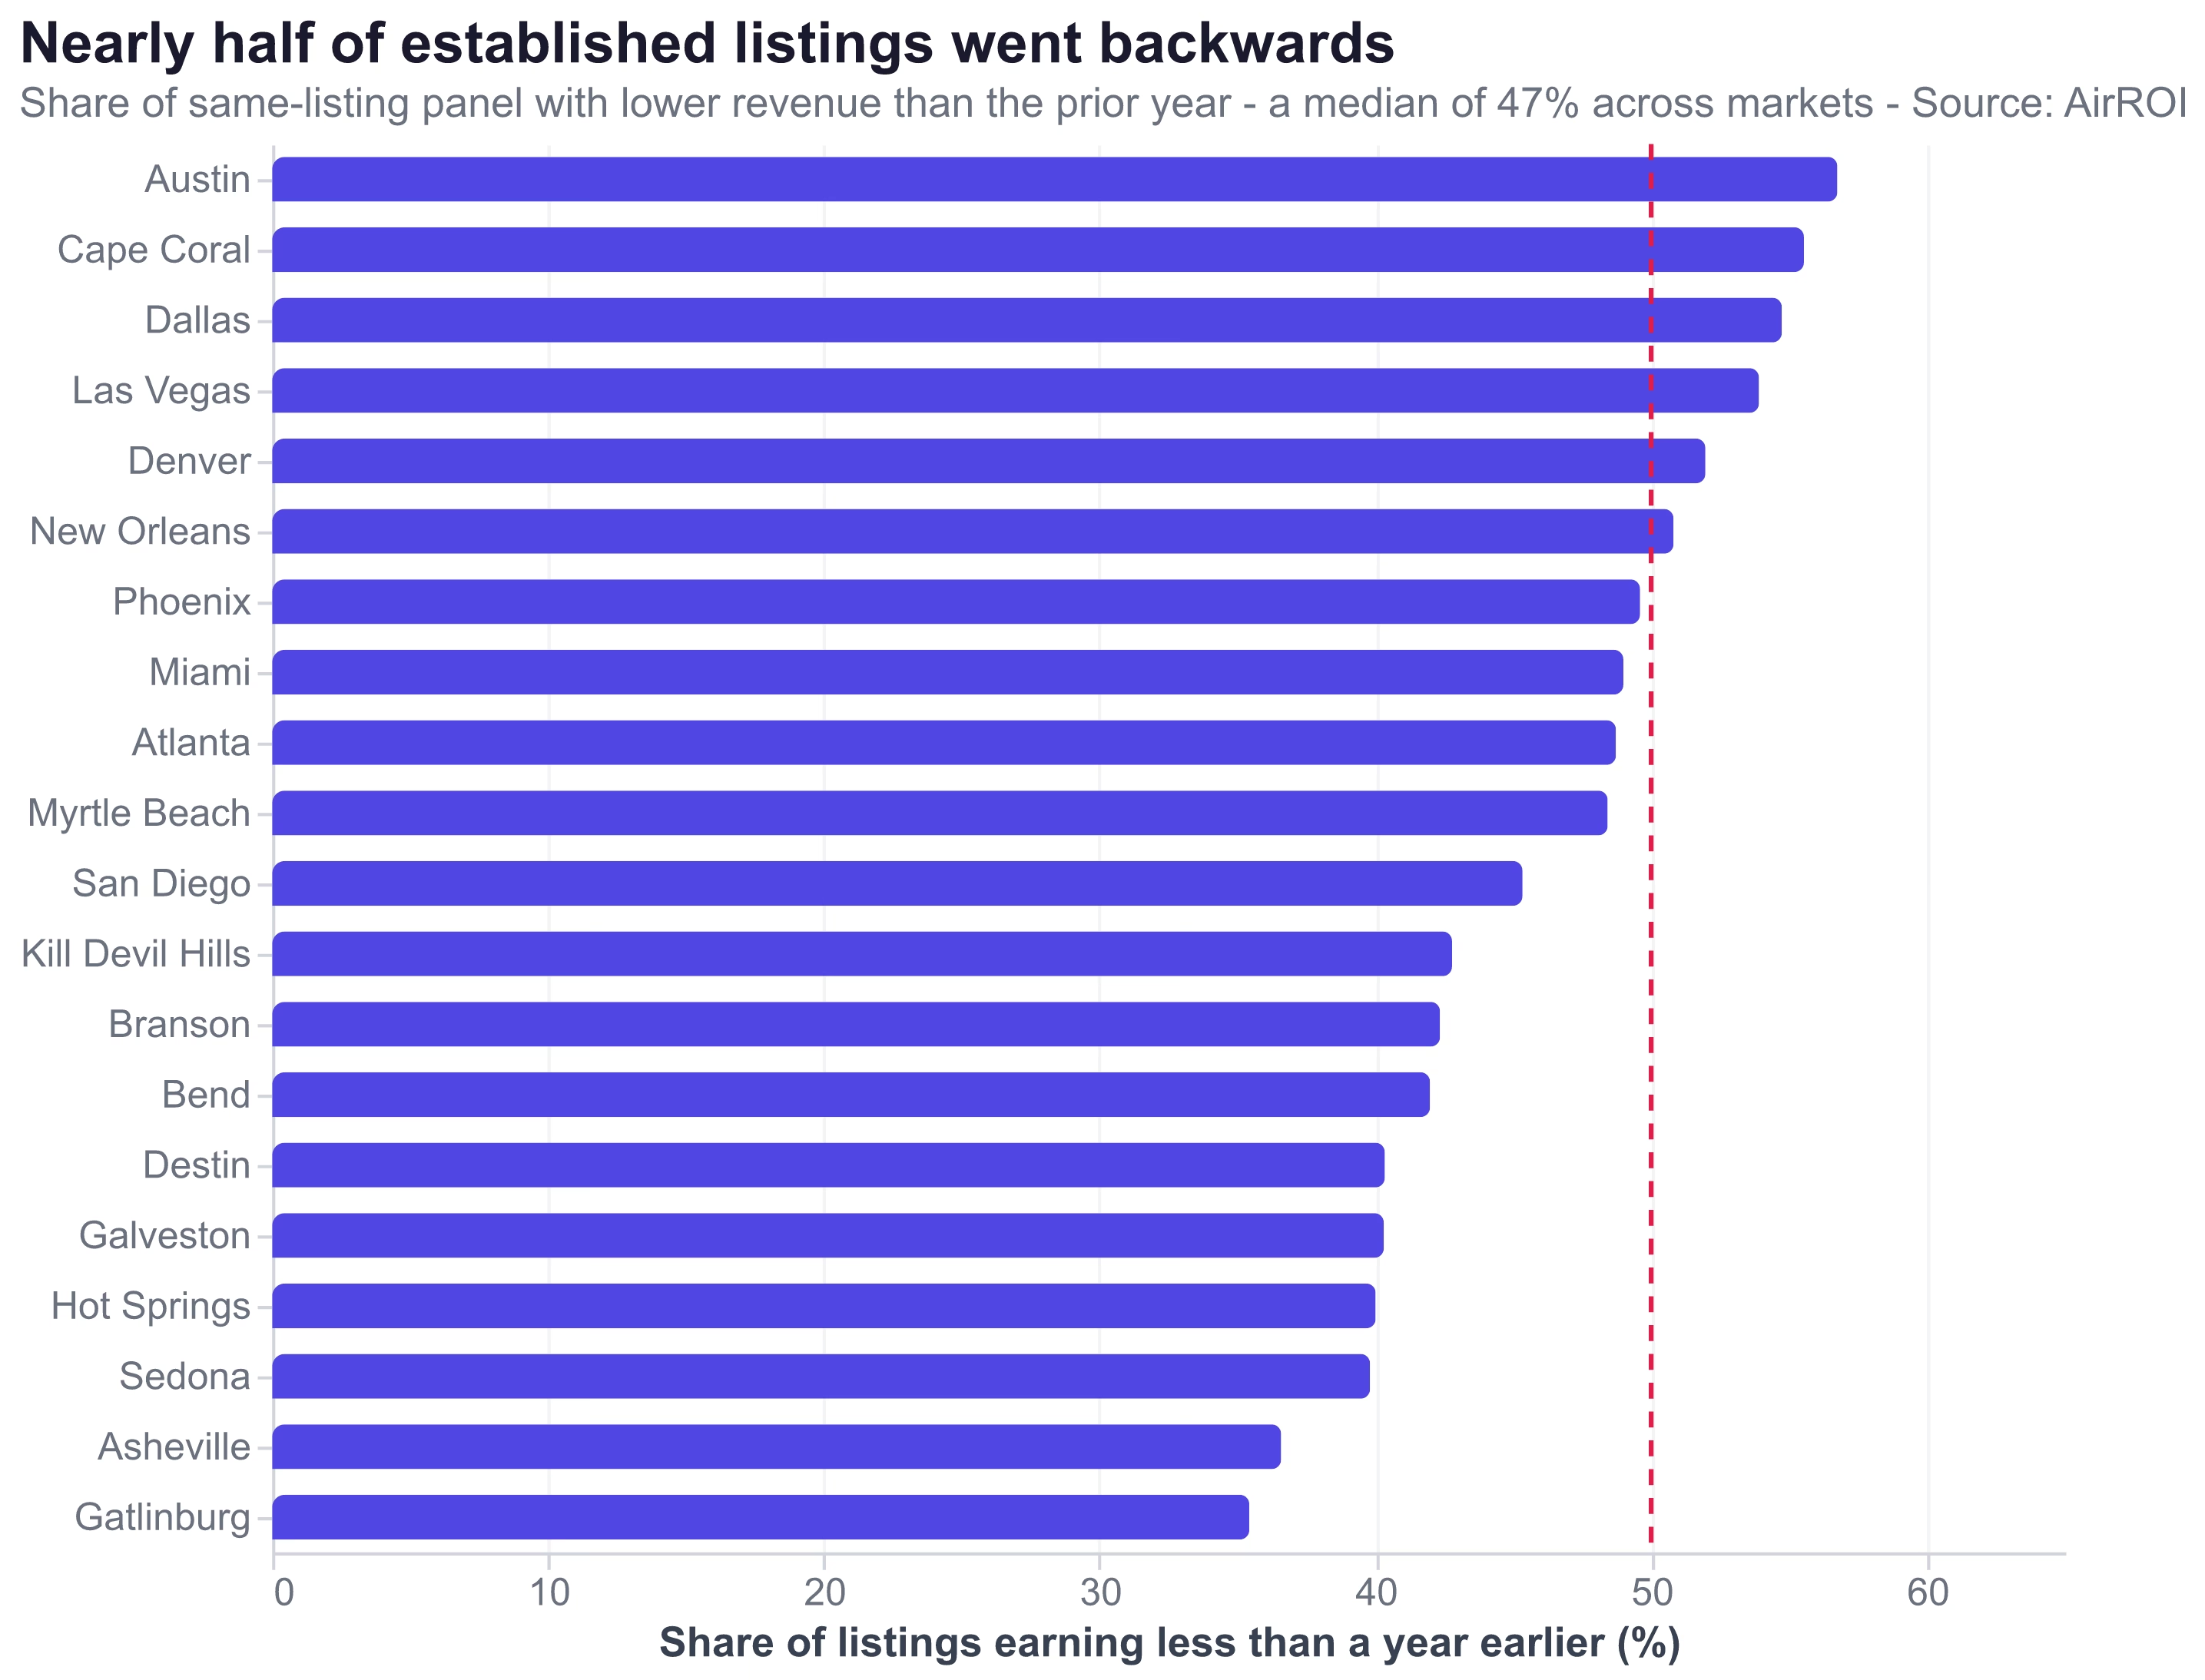
In four markets the median listing lost money year over year: Las Vegas (-8.3%), Austin (-6.0%), Cape Coral (-4.5%) and Dallas (-3.6%). In Austin, 57% of established listings earned less than the year before. In Cape Coral, 56%. In Dallas, 55%.
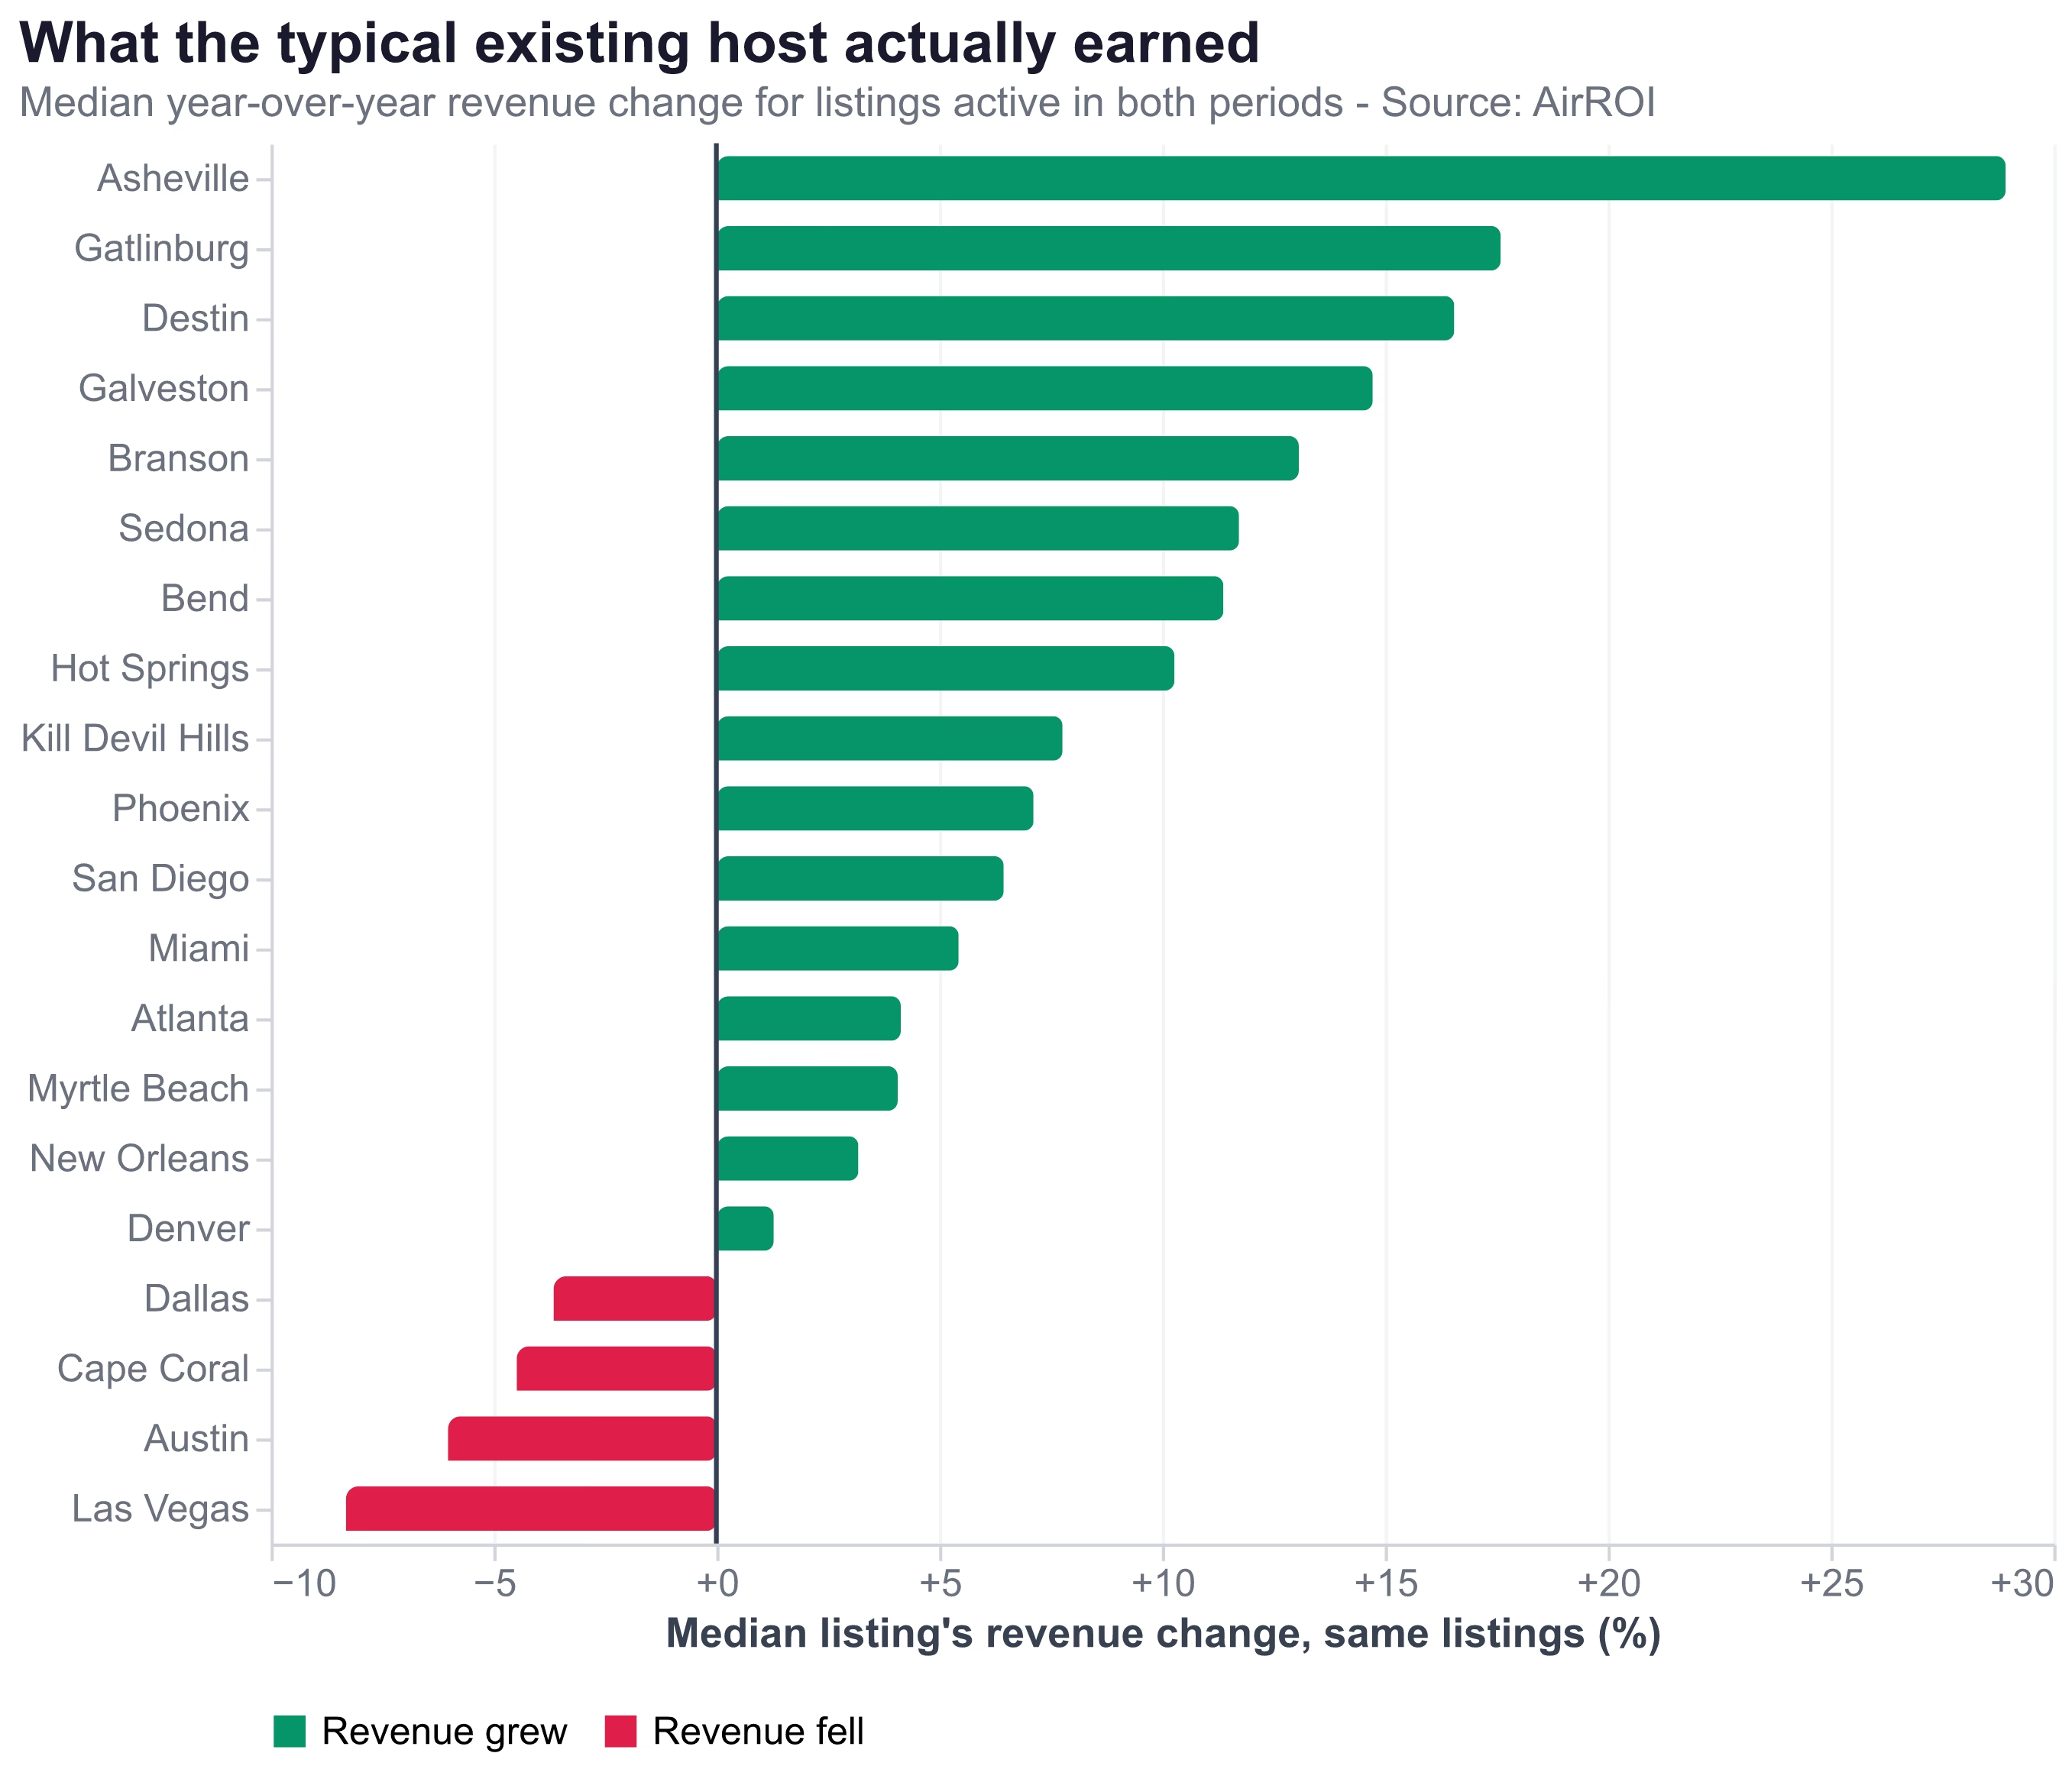
At the other end, Asheville (+28.9%), Gatlinburg (+17.6%), Destin (+16.6%) and Galveston (+14.7%) delivered genuine gains to their typical operator. The spread between the best and worst market is 37 percentage points of revenue growth -- vastly wider than any national average can express.
The headline "a better year to own than to buy" is defensible as an average and misleading as a description. Roughly half of established hosts in these markets did worse than the year before.
Why the Market Averages Look Better Than the Hosts Do
Market-average RevPAR across these 20 markets rose. The median matched listing's RevPAR fell. Both statements are correct, and the gap between them is a composition effect.
When the set of listings being averaged changes between two periods -- weaker properties going dormant, newer or better-capitalised ones appearing in the data -- the average can rise even while most individual operators lose ground. This is the same mechanism that makes national averages reassuring in a year when many hosts are struggling, and it is why we rebuilt this analysis on a matched panel after the supply figures failed.
"The story this summer is pricing. Operators have held rates firmly through the second quarter and into the forward months, and that discipline is carrying revenue growth even as booking momentum settles into a steadier pattern." -- Sally Henry, VP of Market Intelligence and Insights, KeyData
About the Mortgage-Rate Explanation
The stated cause of the supply slowdown does not hold up well, and it changes what the incumbent advantage is made of.
AirDNA attributes it directly. Bram Gallagher, their Director of Economics and Forecasting:
"At the beginning of the year, we expected lower borrowing costs to bring more new supply to market. Instead, renewed inflation driven by the war in Iran and the resulting energy shock pushed mortgage rates back above 6%, delaying investment. That slower supply growth, combined with healthy travel demand, has supported occupancy while creating stronger pricing conditions for established operators. As inflation eases, we expect demand and investment activity to strengthen further in 2027."
But three facts sit awkwardly against "rates froze acquisitions":
"The ones that'll stick around have been around because owners bought them before the real estate boom, but with prices of houses going crazy and the interest rate to pay said house is also high there will probably be a culling because many bought or made Airbnb thinking it was easy money."
If You Already Own
Your rate increase probably worked. Your calendar probably did not. Check which one is carrying you.
The panel says the median host raised price 12.0% and gave back 18.3% of nights, netting +6.8% revenue -- with a 47% chance of being on the wrong side of it. The practical implication is that the revenue number is the only one that settles the question. A host looking only at ADR concluded 2026 was a strong year. A host looking at nights booked concluded it was a bad one. Both were reading real data about the same property.
Where the rate ceiling has clearly been found, the evidence is unambiguous. Dallas hosts raised rates 16.0% and still finished with median revenue down 3.6%, having shed 30.0% of their nights. Cape Coral raised 12.1% and lost 28.5% of nights for a 4.5% revenue decline. In markets like these, further increases will cost more volume than they recover.
Where it has not, the same lever still has room. Gatlinburg gave up only 9.4% of nights for an 11.3% rate rise and delivered +17.6% revenue. Galveston, Destin and Branson show the same pattern: modest volume loss against a solid rate gain.
If You Want to Buy
The honest case for buying in 2026 is narrower than "less competition," because the incumbents you would be joining did not have an easy year.
That is the finding a prospective buyer should sit with longest. The properties already established in these markets -- with reviews, ranking history and repeat guests -- collectively lost 18.3% of their booked nights and sent nearly half their owners backwards on revenue. A new listing enters below them, without the review depth, into the same demand.
So the conditions worth testing are narrow and specific:
Assume you land below the median, and check whether that still clears. With the top-quartile-to-median spread now at a median 2.45x and widening, the distance between an average listing and a good one is larger than most pro formas assume, and new listings start low.
"My advice is to buy something that's already set up as a short-term rental that has a history of income and expenses that you can rely on. For me, nothing was as valuable as this because it speaks to the financial history of the property."
This analysis is for informational purposes and is not investment advice. Short-term rental returns depend on property-specific factors and local regulation; consult qualified professionals before committing capital.
The 2027 Question
AirDNA expects the pressure to lift, forecasting that as inflation eases, "demand and investment activity strengthen further in 2027."
If that happens, the rate lever that carried hosts through 2026 gets harder to pull. New entrants underprice to win their first reviews, and the operators who do best will be the ones who spent this year building something other than a higher price -- review depth, direct booking relationships, a position in the top quartile rather than the middle.
But the forecast assumes the wrong problem gets solved. What broke in 2026 was volume: the median listing lost nearly three weeks of bookings, and TSA throughput has fallen every month since February. Cheaper mortgages bring more supply. They do not bring more guests. A 2027 in which investment recovers while travel demand stays flat is the version nobody is forecasting, and it is the version in which incumbents are worse off than they are now -- competing against more listings for the same shrinking pool of nights.
Nor is cheap money the base case. The Federal Reserve held its target range at 3.50-3.75% on 29 July 2026, its fifth consecutive hold, on a 9-3 vote in which all three dissents favoured a hike.
There is a version of 2027 where this resolves well, and a version where the volume problem outlasts the credit one. We would rather say plainly that we cannot yet tell them apart than pick the comfortable one. What we can say is that the difference will show up first in nights booked, not in nightly rates -- and that a host watching only their ADR will be the last to know which one arrived.
Frequently Asked Questions
The case for buying is weaker than the industry narrative suggests, because the incumbent advantage it rests on is thin. Tracking 83,892 listings active in both 2025 and 2026, AirROI found the median listing raised its nightly rate 12.0% but booked 18.3% fewer nights, and 47% earned less than the year before. If owning through the supply slowdown produced that result, buying into it deserves conservative underwriting rather than optimism.
Yes on rate, no on volume. Across a panel of 83,892 listings tracked individually, 81% of hosts raised their nightly rate and the median increase was 12.0%, but the median listing also lost 4.58 percentage points of occupancy and 18.3% of its booked nights. Hosts are charging more and selling less.
Not for existing listings. Following the same 83,892 listings across both years, occupancy fell in 19 of 20 US markets, with the median listing down 4.58 percentage points. Asheville was the sole exception, gaining 0.43 points. Market-average occupancy figures can look steadier because the mix of listings being averaged changes between periods.
Because we could not verify them to a standard we would stand behind. AirROI's city-level listing counts showed 9% to 35% growth across every market tested, but filtering the same snapshots by county showed those markets essentially flat, with the difference sitting in listings that gained a city label without a county one. That pattern indicates a geocoding and coverage change rather than real supply, so we withheld the figures.
AirDNA forecasts that demand and investment activity strengthen in 2027 as inflation eases, which would lift occupancy. Treat it as a forecast with real uncertainty: the Federal Reserve held rates at 3.50-3.75% in July 2026 with three officials dissenting in favour of a hike, and the volume problem visible in our data is a demand problem, which cheaper mortgages do not directly fix.