Dynamic Pricing Isn't Your Edge Anymore: What Separates Top STR Performers in 2026

The entire short-term rental content ecosystem is still publishing "you need dynamic pricing" articles. They are correct. But here is the problem with that advice in 2026: 84% of STR operators have already adopted AI-powered pricing tools, up from 60.7% in 2025, according to the Hostaway 2026 Short-Term Rental Report. When nearly everyone runs the same algorithms against the same demand signals, dynamic pricing stops being a competitive advantage and becomes a cost of doing business.
AirROI data across four US markets reveals a striking pattern. Top-quartile listings earn 62-82% more RevPAR than the median -- in markets where most operators already use dynamic pricing. The 5.4x RevPAR spread between the top tenth and bottom quarter in Scottsdale cannot be explained by which pricing tool each host selected. Something else is driving the gap. This article identifies what that something else is.
The Adoption Curve That Changed Everything
Dynamic pricing delivered real, measurable results for early adopters. According to the Rentals United and PriceLabs 2026 industry report, properties using high-frequency dynamic pricing achieve 30 percentage points higher occupancy than static-rate properties in Italy (68% vs. 38%). In the United States, adopters hold a 13-percentage-point occupancy advantage. Revenue lifts of 15-36% are well-documented across the industry.
Those gains were real. The problem is that they accrued primarily to early movers who adopted dynamic pricing while competitors were still setting seasonal rates manually. As adoption approached saturation, the advantage compressed.
The numbers tell the story of acceleration:
| Year | AI Tool Adoption Among STR Operators | Source |
|---|---|---|
| 2024 | ~45% (estimated) | Industry surveys |
| 2025 | 60.7% | Hostaway 2026 STR Report |
| 2026 | 84% | Hostaway / StayFi data |
Dynamic pricing specifically is the most-adopted AI category, with 62% of all operators using algorithmic rate management. Among professional property managers -- who now control 69% of the US market, according to Rentals United -- adoption is even higher. The tooling keeps spreading into AI assistants as well: AI pricing tools over MCP now return a recommended base price and a full calendar of nightly rates inside Claude or Cursor.
"Growth in 2026 will increasingly depend on optimisation strategies rather than inventory expansion alone, as operators face growing competition, shorter booking windows and changing traveller expectations." -- Rentals United & PriceLabs, 2026 Vacation Rental Industry Report
This is the "refinement era." The easy revenue lift from adopting dynamic pricing still exists for the shrinking pool of non-adopters. For the 84% who already have it, the competition has shifted to different terrain. And 74% of operators report that market competitiveness increased year-over-year, confirming that the baseline for adequate performance has risen.
The Revenue Gap Dynamic Pricing Cannot Close
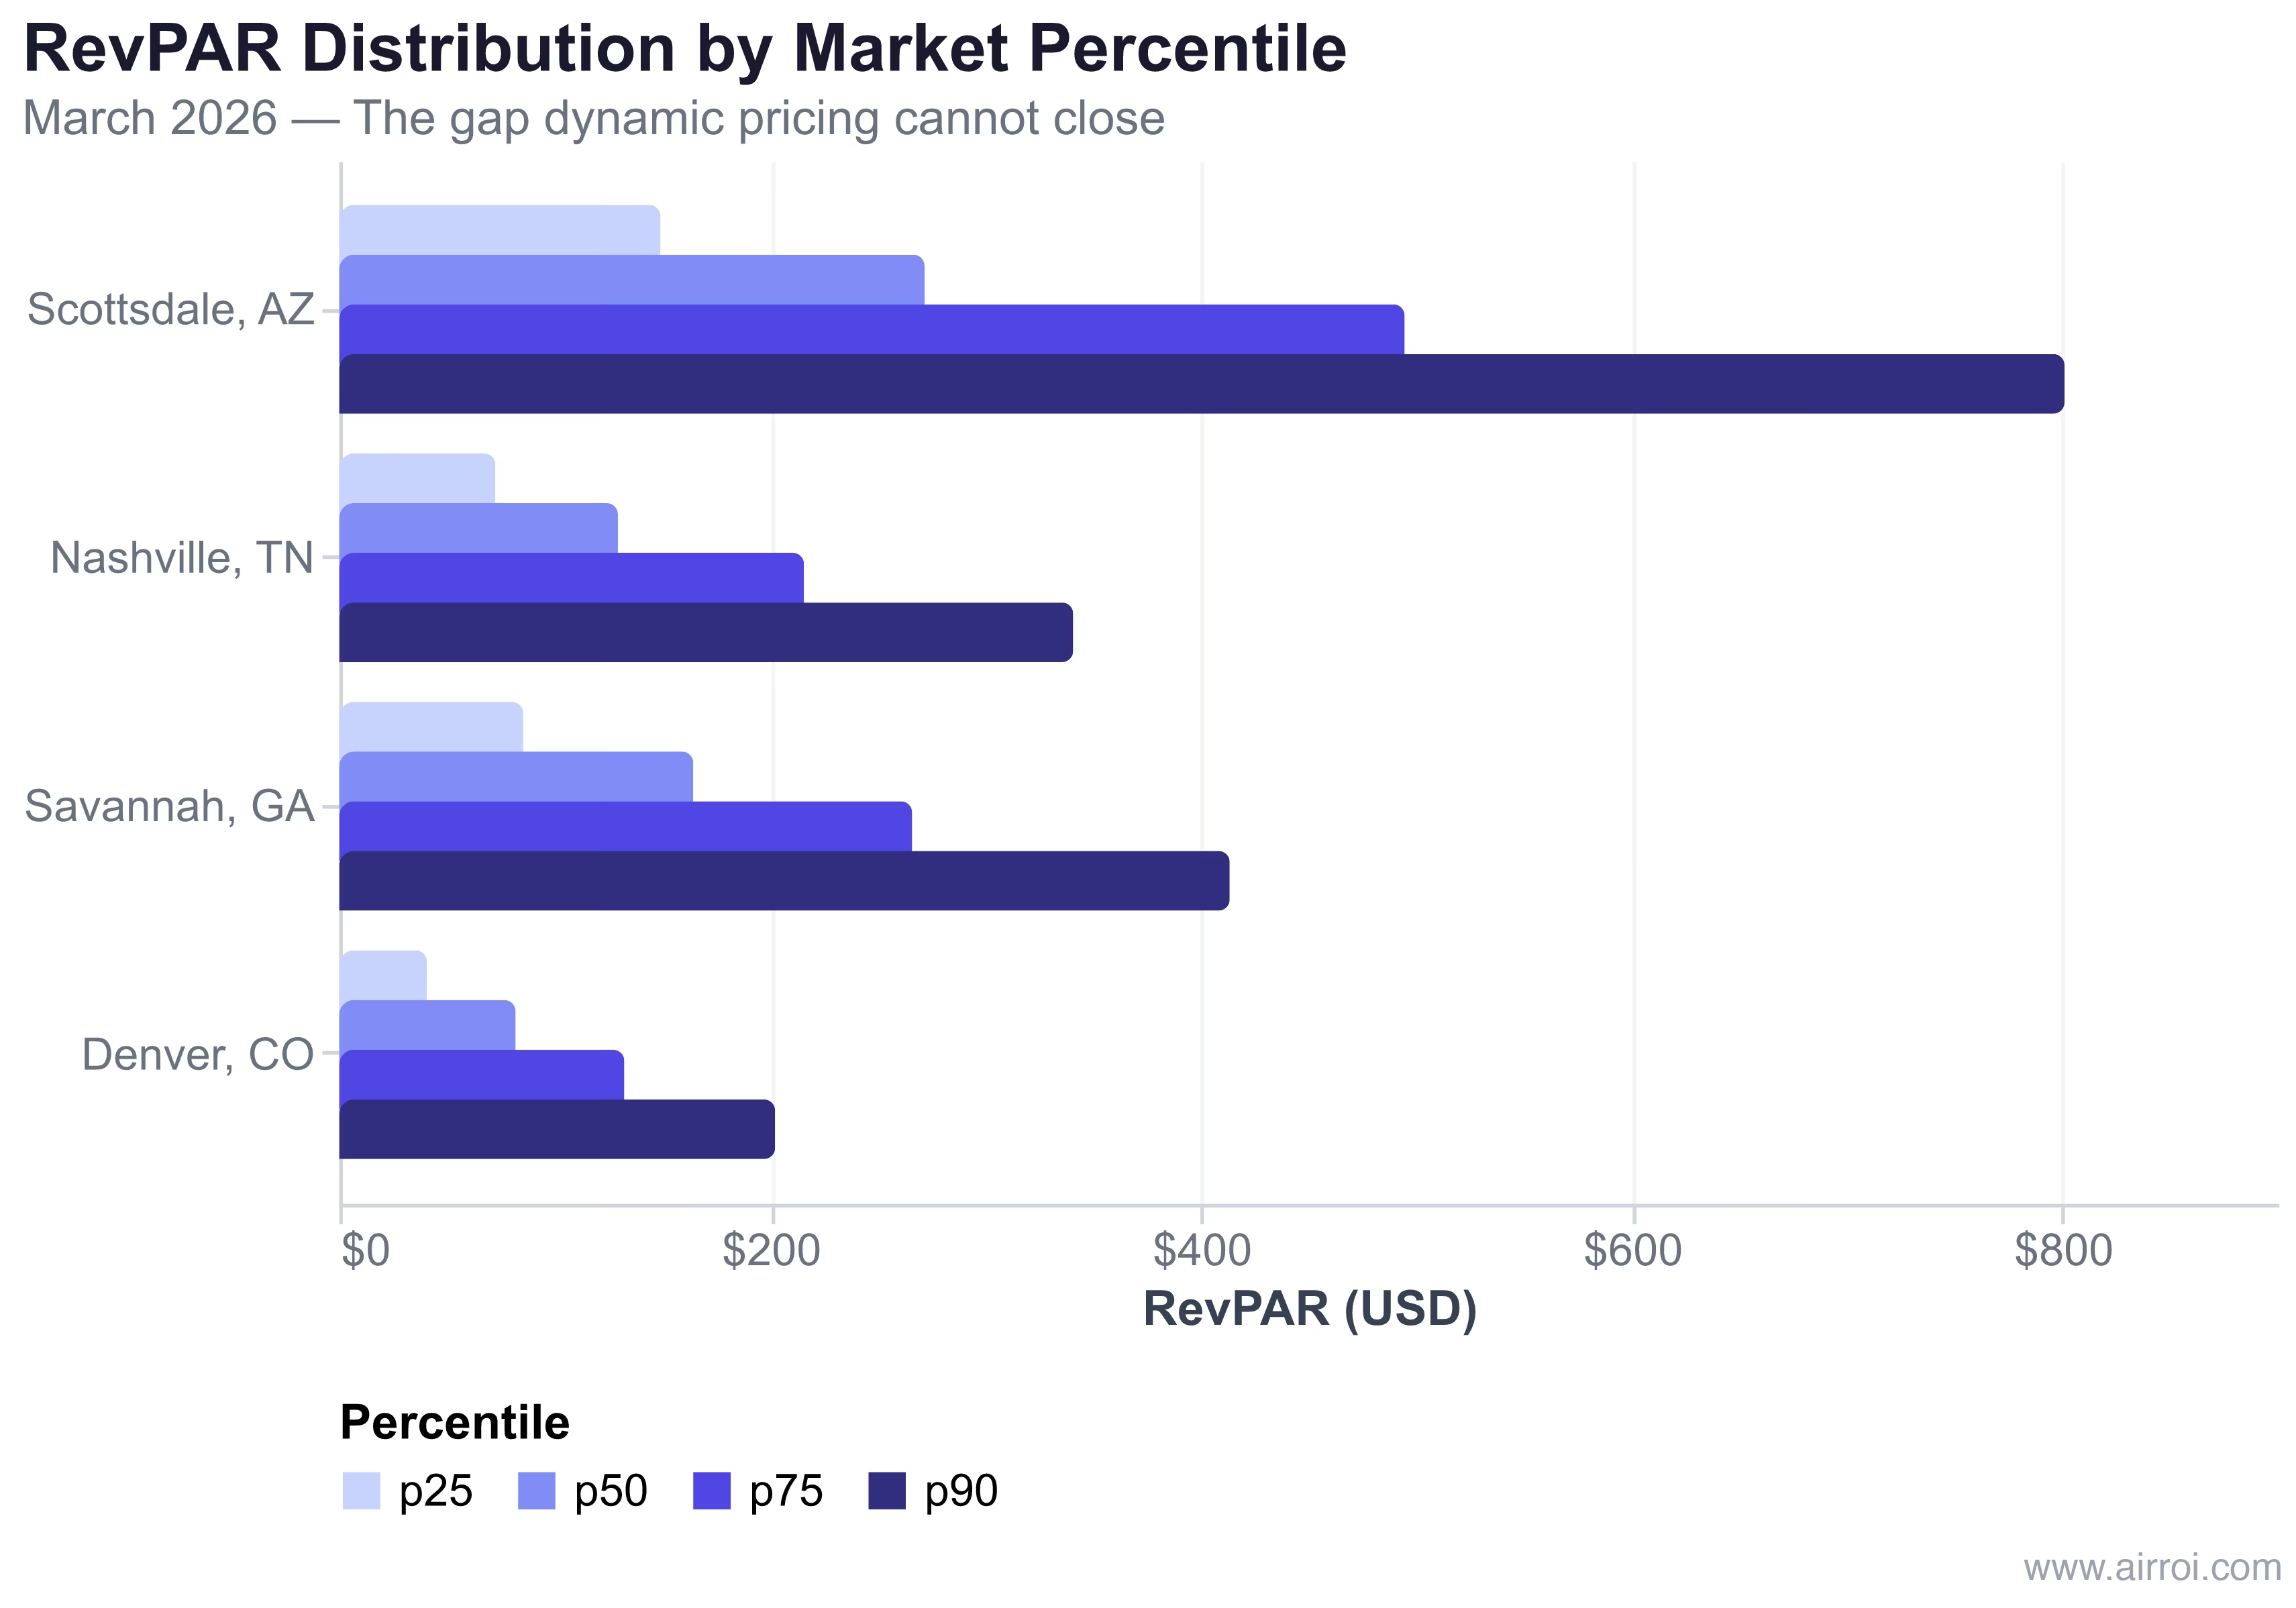
If pricing tools were the primary driver of STR performance, markets with high adoption should show compressed revenue distributions. The opposite is true. AirROI data from March 2026 reveals enormous RevPAR spreads within each market -- gaps that persist despite near-universal dynamic pricing adoption.
| Market | Active Listings | p25 RevPAR | p50 RevPAR | p75 RevPAR | p90 RevPAR | p75/p50 Premium |
|---|---|---|---|---|---|---|
| Scottsdale, AZ | 4,665 | $149 | $272 | $495 | $801 | +82% |
| Nashville, TN | 5,891 | $73 | $129 | $216 | $341 | +67% |
| Savannah, GA | 2,595 | $85 | $164 | $266 | $414 | +62% |
| Denver, CO | 3,821 | $41 | $82 | $132 | $202 | +62% |
Source: AirROI market data, March 2026
In Scottsdale, a p90 listing earns $801 RevPAR compared to $149 for a p25 listing -- a 5.4x spread within the same city, during the same month. In Nashville, the p90/p25 ratio is 4.7x. These are not different markets with different demand characteristics. These are listings competing for the same guests on the same platform with access to the same pricing tools.
The dollar impact of these gaps is substantial. The difference between median and top-quartile monthly revenue ranges from $1,564 in Denver to $6,911 in Scottsdale:
| Market | p50 Monthly Revenue | p75 Monthly Revenue | Monthly Gap |
|---|---|---|---|
| Scottsdale, AZ | $8,424 | $15,335 | +$6,911 |
| Savannah, GA | $5,095 | $8,247 | +$3,152 |
| Nashville, TN | $4,011 | $6,691 | +$2,680 |
| Denver, CO | $2,539 | $4,103 | +$1,564 |
Source: AirROI market data, March 2026
Annualized, the p50-to-p75 gap represents $18,768 to $82,932 in additional revenue depending on the market. This is the revenue ceiling that pricing algorithms cannot reach on their own. What the top-quartile performers do differently has nothing to do with which pricing tool they selected.
What the Top Quartile Does Differently
Research consistently points to the same conclusion: 70-80% of underperformance in STR portfolios comes from non-pricing problems -- poor photos, ineffective titles, low review scores, and restrictive cancellation policies. Dynamic pricing optimizes the rate for a given product. The top quartile invests in changing what the product is.
Listing Content Quality: The 12% Standard
According to a PriceLabs analysis of 10,000+ global listings, only 12% of listings meet strong content quality standards. Those that do are 35% more likely to outperform their local market than listings with weak or inconsistent content.
The deficiency is widespread. Between 60-70% of listings have image-related issues: poor lighting affects 32% of listings, bad staging impacts 32%, and blurry pictures appear in 30%. Meanwhile, 54% of listings have incomplete or unclear descriptions that omit details guests actively search for.
"Content quality acts as a performance multiplier. Pricing works best when listings are already discoverable." -- PriceLabs, Airbnb Listing Optimization Study
Professional photography delivers a 20-35% revenue increase. At a one-time cost of roughly $500, professional photos represent possibly the highest-ROI investment a host can make -- higher than any pricing tool subscription. Research also shows that featuring the living room prominently in the primary photo increases booking rate by 35%.
Review Score Management: The Compound Effect
Listings rated 4.9 stars or above earn 18.2% more revenue than their lower-rated peers, with 7.7% higher ADR and 9.7% higher occupancy working in combination. A 1-point review score increase allows hosts to raise prices 11.2% without losing bookings, because review scores directly influence Airbnb's search ranking algorithm.
This creates a compound effect. Higher review scores produce better search placement, which generates more bookings, which -- when managed well -- produces more positive reviews. The cycle favors hosts who treat review score management as a systematic practice rather than a passive outcome. Responding to reviews, addressing feedback in real time, and proactively fixing recurring complaints are operational investments that pricing tools cannot replicate.
Superhost Status and Trust Signals
Superhosts earn 29% more in total annual revenue than standard hosts, even though they charge approximately 11% less per night. The math works because Superhosts book more frequently -- lower nightly rates combined with higher occupancy create more total income than premium prices with calendar gaps.
About 41% of US hosts currently qualify as Superhosts. The premium is strongest in competitive markets with many similar listings, where the trust badge serves as a tiebreaker in booking decisions. In supply-constrained markets or for highly distinctive properties, the badge matters less because demand finds those listings regardless.
Amenity-Driven Revenue Premiums
The most durable competitive advantages are structural -- they change the physical product rather than its price. AirROI data from our analysis of amenity upgrades with proven ROI shows the scale of these premiums:
- Hot tubs: 47-121% revenue premium depending on market (strongest in mountain and coastal markets)
- Pools: 50-94% ADR premium in warm-climate markets
- EV chargers: 45-56% revenue premium, with Airbnb EV charger searches growing 80% from 2022 to 2023
- Pet-friendliness: 20% revenue lift at under $500 investment
These premiums persist regardless of pricing tool selection because they change the product itself. A hot tub listing in Scottsdale operates in a fundamentally different comp set than a comparable listing without one -- and dynamic pricing algorithms reflect rather than create that advantage.
The Post-Pricing Playbook
The strategic question for 2026 is not whether to use dynamic pricing -- that answer is unambiguously yes. The question is where to invest the next dollar of operational energy once pricing optimization is handled.
Based on the data, here is an investment hierarchy ranked by ROI and accessibility:
1. Photography and listing SEO -- Highest return, lowest cost. Professional photography delivers 20-35% revenue lift at ~$500. Description optimization improves search visibility at zero cost. Only 12% of listings meet strong content standards, meaning the opportunity for most hosts is enormous.
2. Review score management -- Each 1-point improvement enables 11.2% higher pricing without losing bookings. Requires systematic guest communication, rapid issue resolution, and proactive review solicitation. The compound effect of better scores feeding better search placement feeding more bookings is the closest thing to a moat in STR.
3. Minimum-stay optimization -- Most dynamic pricing tools adjust rates but do not optimize minimum-night requirements. In Scottsdale, where the average length of stay is 5.4 nights in March, a host requiring 1-night minimums during peak season leaves money on the table. Strategic minimum-stay management is a lever most tools ignore.
4. Amenity upgrades with market-specific ROI -- Use AirROI Atlas to compare listings with and without specific amenities in your market before committing capital. Hot tubs deliver 86-121% premiums in mountain markets but smaller lifts elsewhere. The right amenity depends on your market and property type.
5. Multi-channel distribution -- Two-thirds of operators generate less than 25% of bookings through direct channels. Reducing OTA dependency through direct booking websites, email marketing, and return-guest programs captures revenue that platform fees otherwise absorb.
"Your edge has to shift to things that don't commoditize -- local expertise, portfolio orchestration, multi-channel strategy -- or into services the platform hasn't yet platformed." -- Rental Scale Up, 2026 Airbnb strategy analysis
The common thread across all five investments: they change the host's product, operations, or distribution -- not just its price. When 84% of operators run similar pricing algorithms, the revenue variance shifts to dimensions those algorithms do not touch. The top quartile has already made that shift. AirROI data across every market we track shows the same pattern: rate discipline matters, but the hosts earning 62-82% more RevPAR than the median are not winning on price alone.
Frequently Asked Questions
AirROI data shows top-quartile listings earn 62-82% more RevPAR than the median across markets like Nashville, Scottsdale, Savannah, and Denver. The differentiators are listing content quality (only 12% of listings meet strong standards), review scores (4.9+ rated listings earn 18.2% more revenue), professional photography (20-35% revenue lift), and Superhost status (29% revenue premium).
Superhosts earn 29% more in total annual revenue than standard hosts, even though they charge approximately 11% less per night. The premium comes from higher occupancy driven by better search placement, the Superhost trust badge that increases booking conversion, and priority support. About 41% of US hosts currently qualify for Superhost status.
When most competitors use the same pricing tools with similar demand signals, prices converge and the initial revenue lift flattens. PriceLabs analysis of 10,000+ listings found that 70-80% of underperformance comes from non-pricing factors including poor photos, ineffective titles, low review scores, and restrictive cancellation policies.
Focus on the factors that explain the 62-82% RevPAR gap between median and top-quartile performers: professional photography (20-35% revenue lift at roughly $500 investment), review score optimization (each 1-point increase enables 11.2% higher pricing), amenity upgrades with proven ROI like hot tubs (47-121% revenue premium), and listing SEO to improve search visibility.