STR Revenue Is Up 8% in 2026 — But Not Because Guests Are Booking More
Short-term rental revenue growth in 2026 is real — Key Data's Q2 2026 Index shows RevPAR pacing 8% higher year-over-year in April — but the mechanism behind it should concern every operator in the industry. Demand held flat in March 2026. Zero growth in booked nights. The entire RevPAR increase is being generated by rate hikes, not by more guests walking through your door.
This is not a recovery. It is not a boom. It is value extraction from a flat guest pool — and AirROI's analysis of airbnb occupancy vs ADR across six diverse US markets reveals that this strategy produces wildly divergent outcomes depending on one variable that most pricing algorithms ignore: whether your market's supply is growing or contracting.
The winners — Nashville (+6.7% RevPAR) and Asheville (+20% RevPAR) — raised rates into markets that lost 18-22% of their active listings. The losers — Destin (-19.9% RevPAR), Vail (-9.1%), and Gatlinburg (-10.6%) — raised rates into markets that added 11%+ new supply. Same strategy, opposite results.
The National Number Hides a Brutal Divergence
According to Key Data's Q2 2026 Index Report, "on-the-books data shows revenue per available rental pacing eight percent higher year-over-year in April, signaling a market driven by rate strategy rather than demand acceleration." Average daily rates increased steadily through Q1 and are pacing 9% higher into April with mid-single-digit gains projected through June.
The demand side tells a different story. March 2026 showed flat year-over-year booking volume nationally. AirDNA's 2026 Outlook Report, released in December 2025, projected US STR occupancy easing by 1% with ADR rising 1.5% and available listings growing 4.6% to approximately 1.68 million properties. The 2025 full-year actuals confirmed the pattern: ADR climbed 3.6% to $246.62 while occupancy fell 1.5% to 48.4%.
"Investors want clarity on whether STRs remain a strong opportunity. The data points to a clear yes." — Jamie Lane, Chief Economist, AirDNA
This is a market maturation signal. The US short-term rental industry has shifted from growth mode (more guests arriving organically) to optimization mode (extracting more revenue from existing demand). Professional managers are already executing this pivot. According to PriceLabs data analyzed by Rental Scale Up, "professionally managed portfolios are trading occupancy for higher Average Daily Rates and stronger Revenue per Available Rental, and listing quality has emerged as a measurable revenue driver."
The strategy works — but only in the right conditions.
Where Rate Discipline Delivered: The Supply Contraction Dividend
Rate-driven growth requires one precondition that national data cannot reveal: supply must be contracting faster than demand is softening. Two markets in AirROI's analysis demonstrate this perfectly.
Nashville: Permit Enforcement Created the Opening
Nashville lost 22% of its active Airbnb listings between April 2025 (7,490) and April 2026 (5,844). The city's strengthened short-term rental permit enforcement, combined with hosts exiting after weak 2024-25 returns, removed nearly 1,650 listings from the market.
The remaining hosts raised rates aggressively:
| Period | ADR Change | Occupancy Change | RevPAR Change |
|---|---|---|---|
| March 2025 → March 2026 | +21.3% ($298 → $362) | -3 ppts (51% → 48%) | +12.8% ($148 → $167) |
| April 2025 → April 2026 | +20.2% ($318 → $382) | -4 ppts (46% → 42%) | +6.7% ($144 → $154) |
The math is straightforward: with 22% fewer competitors, the remaining demand redistributed across fewer listings. A 20% rate increase with only a 3-4 percentage-point occupancy decline is the textbook definition of successful rate discipline. Nashville hosts captured roughly $3,600 more gross revenue per property per year without meaningfully sacrificing bookings.
Asheville: Hurricane Helene Removed 18% of Supply
Asheville provides a natural experiment in forced supply contraction. Hurricane Helene's September 2025 impact removed approximately 18% of active listings (from 2,260 in April 2025 to 1,854 in April 2026) through property damage and infrastructure disruption.
The result was the strongest RevPAR performance in this analysis:
| Period | ADR Change | Occupancy Change | RevPAR Change |
|---|---|---|---|
| March 2025 → March 2026 | +13.2% ($220 → $249) | +4 ppts (40% → 44%) | +23.7% ($84 → $104) |
| April 2025 → April 2026 | +14.7% ($226 → $259) | +2 ppts (39% → 41%) | +20.0% ($86 → $103) |
Asheville is the only market in this analysis where occupancy INCREASED alongside rate growth. With fewer listings and recovering tourism demand, the market supported both higher rates and more booked nights — the theoretical ideal that most pricing consultants promise but few markets deliver.
The pattern is clear: supply reduction enables rate increases. Nashville's was regulatory; Asheville's was catastrophic. Neither was a result of operator strategy — they were exogenous shocks that created favorable conditions for the hosts who remained.
Where Rate Hikes Backfired Into RevPAR Losses
Three markets in AirROI's analysis demonstrate what happens when operators raise rates without supply contraction to support the increase. The national "ADR is up" narrative becomes a trap.
Destin: The Most Dramatic Failure
Destin, Florida pushed rates 14% higher for spring 2026 while adding 430 new listings (+11.2% supply growth). The result was catastrophic:
| Period | ADR Change | Occupancy Change | RevPAR Change | Supply Change |
|---|---|---|---|---|
| March 2025 → March 2026 | +14.4% ($426 → $487) | -9 ppts (45% → 36%) | -12.4% ($198 → $174) | +8.7% |
| April 2025 → April 2026 | +14.0% ($411 → $468) | -14 ppts (47% → 33%) | -19.9% ($193 → $155) | +11.2% |
Gatlinburg: Easy Entry, Saturated Demand
Gatlinburg added 11.4% more listings (3,640 to 4,054) between April 2025 and April 2026 while raising ADR 12.2%:
| Period | ADR Change | Occupancy Change | RevPAR Change | Supply Change |
|---|---|---|---|---|
| March 2025 → March 2026 | +12.5% ($320 → $360) | -8 ppts (52% → 44%) | -3.2% ($166 → $160) | +10.8% |
| April 2025 → April 2026 | +12.2% ($306 → $343) | -9 ppts (47% → 38%) | -10.6% ($142 → $127) | +11.4% |
Gatlinburg's low barrier to entry — rural Tennessee zoning is permissive, and cabin inventory is readily available — makes it one of the easiest US markets to enter. That same accessibility makes rate increases unsustainable when demand is flat. Every new listing dilutes the existing demand pool.
The Asymmetric Math
The fundamental problem with rate-driven growth in oversupplied markets is mathematical asymmetry. When occupancy drops from 47% to 33% (Destin's April decline of 14 percentage points), the host would need a 42% ADR increase to maintain the same RevPAR — not the 14% that was actually achieved. The gap between required and actual rate increases is the lost revenue.
| Occupancy Decline | ADR Increase Required to Maintain RevPAR |
|---|---|
| -5 ppts (50% → 45%) | +11.1% |
| -8 ppts (50% → 42%) | +19.0% |
| -10 ppts (50% → 40%) | +25.0% |
| -14 ppts (47% → 33%) | +42.4% |
No market in this analysis achieved ADR increases large enough to offset actual occupancy losses when supply was growing.
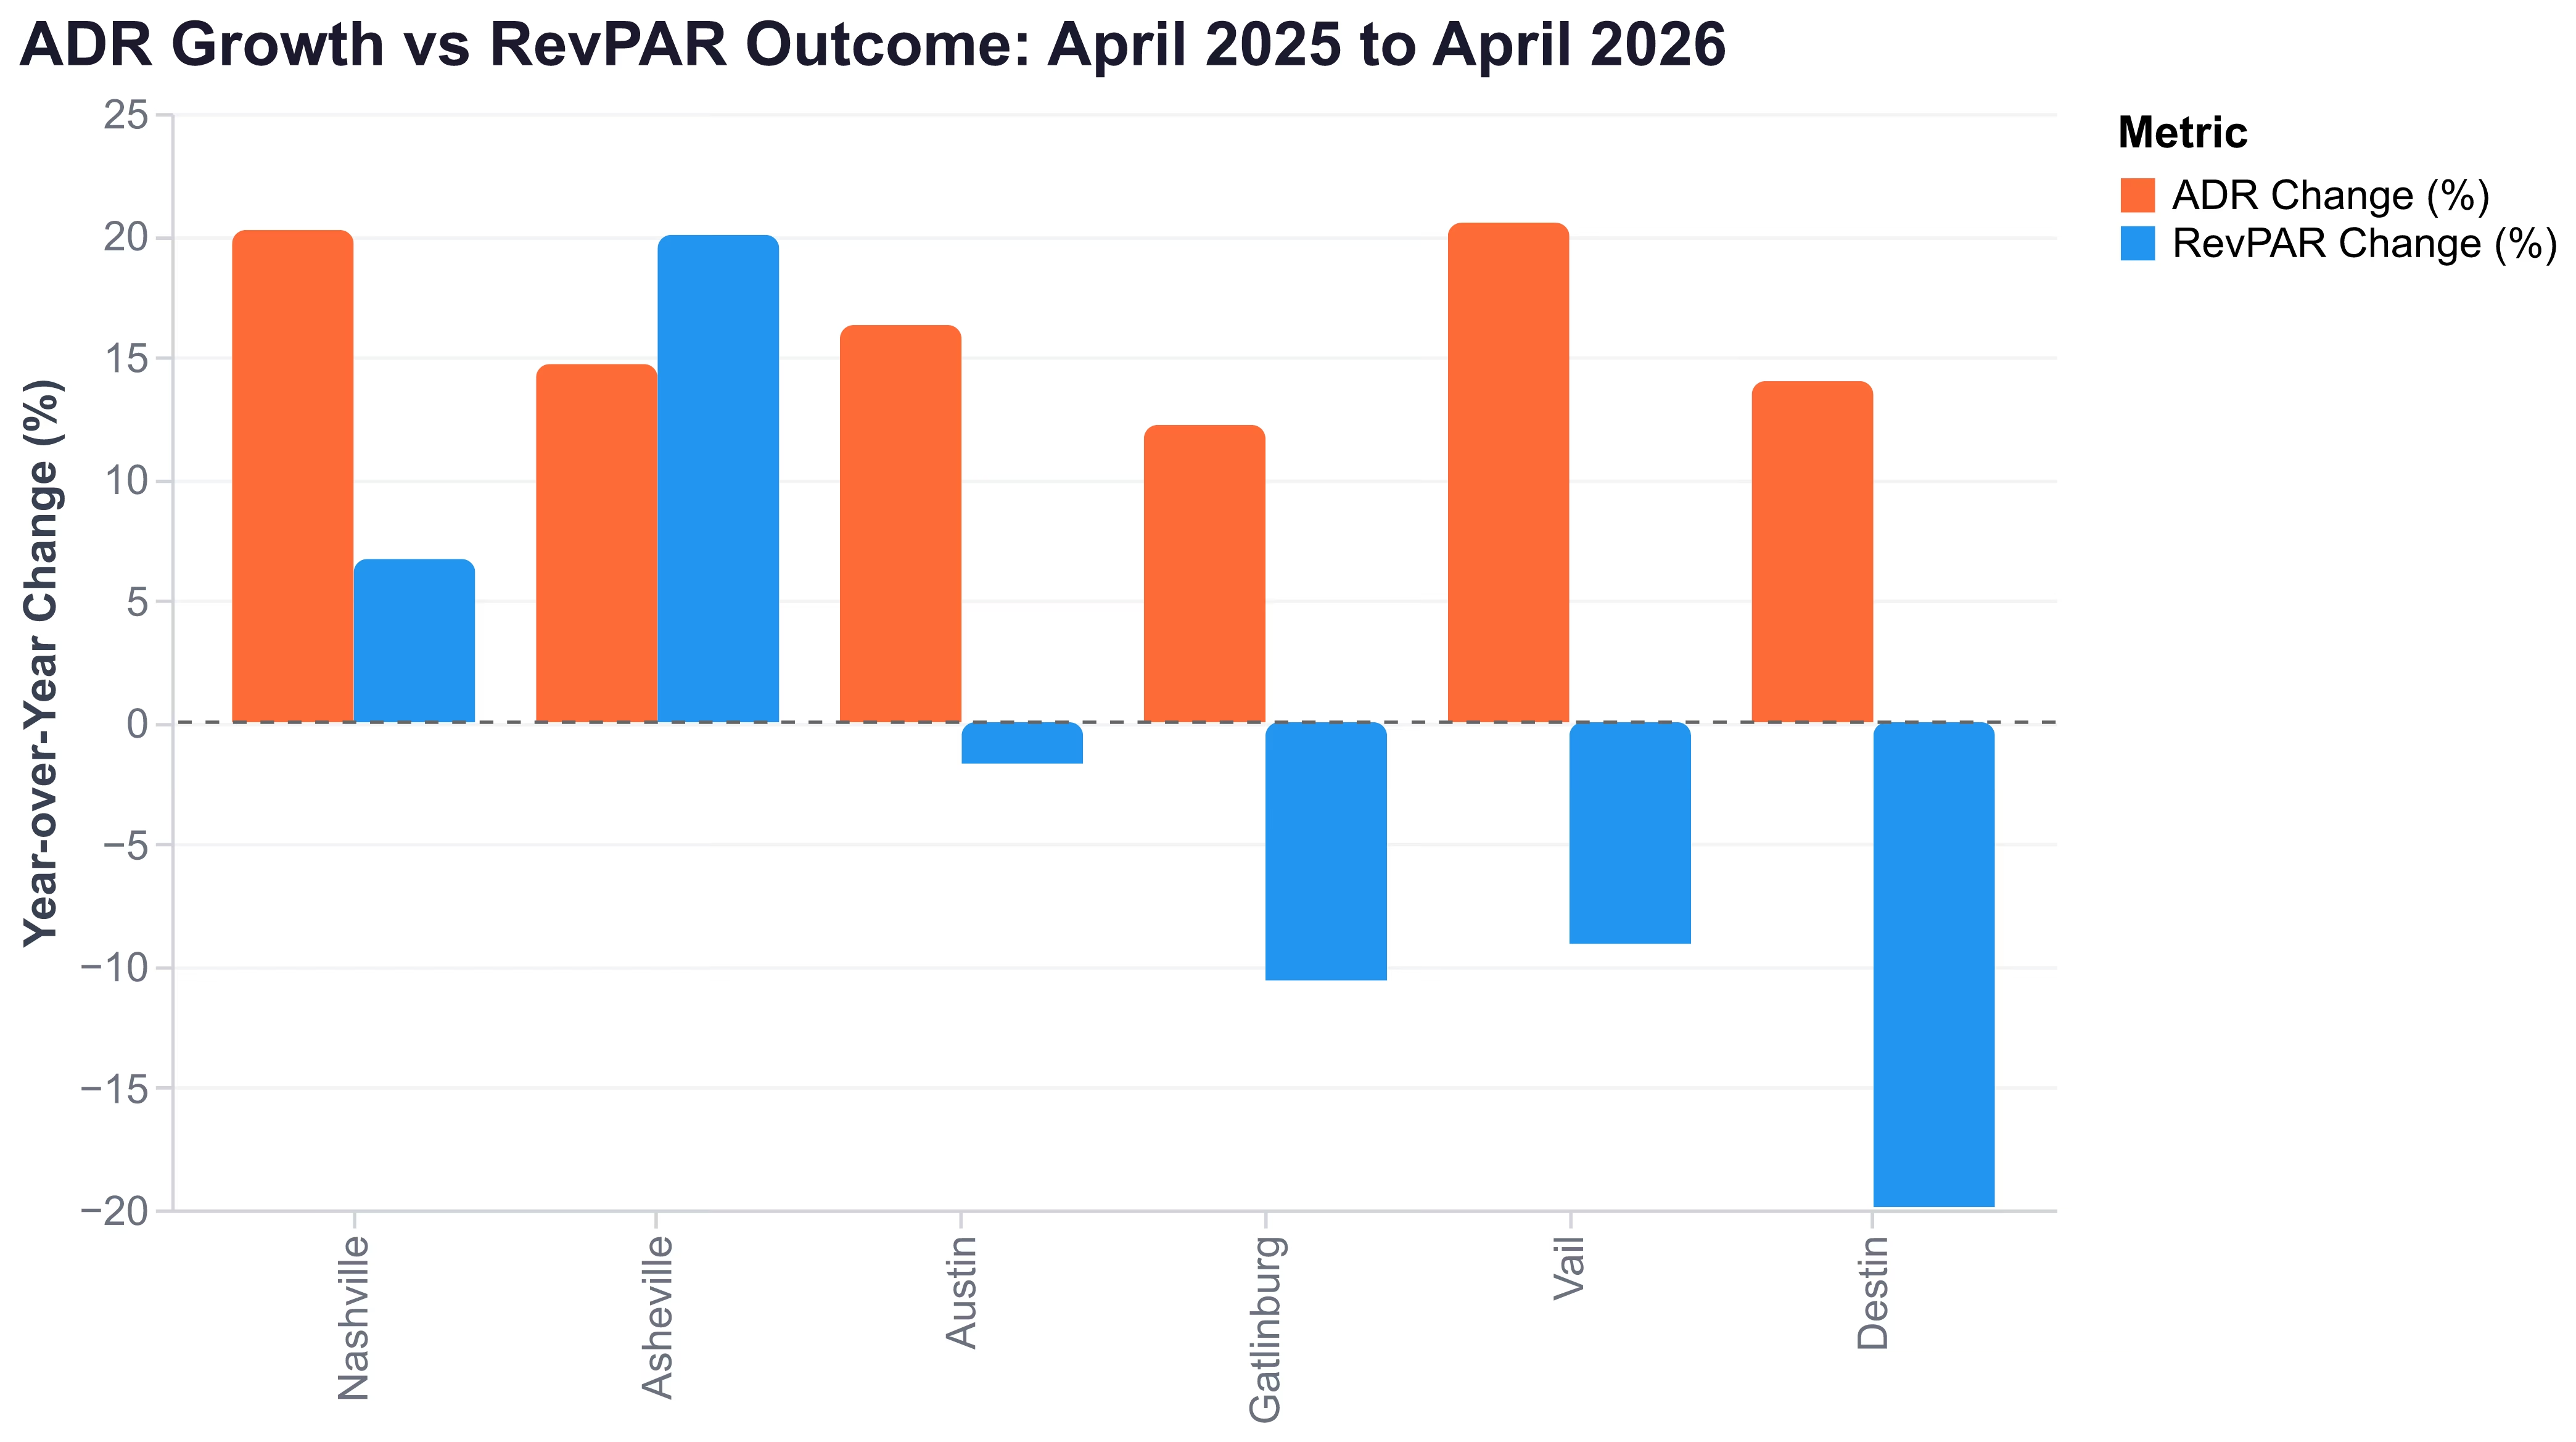
The chart above tells the story clearly: every market raised ADR between 12% and 21% (orange bars), but RevPAR outcomes (blue bars) diverged wildly based on supply conditions. Nashville and Asheville grew RevPAR. Everyone else lost it.
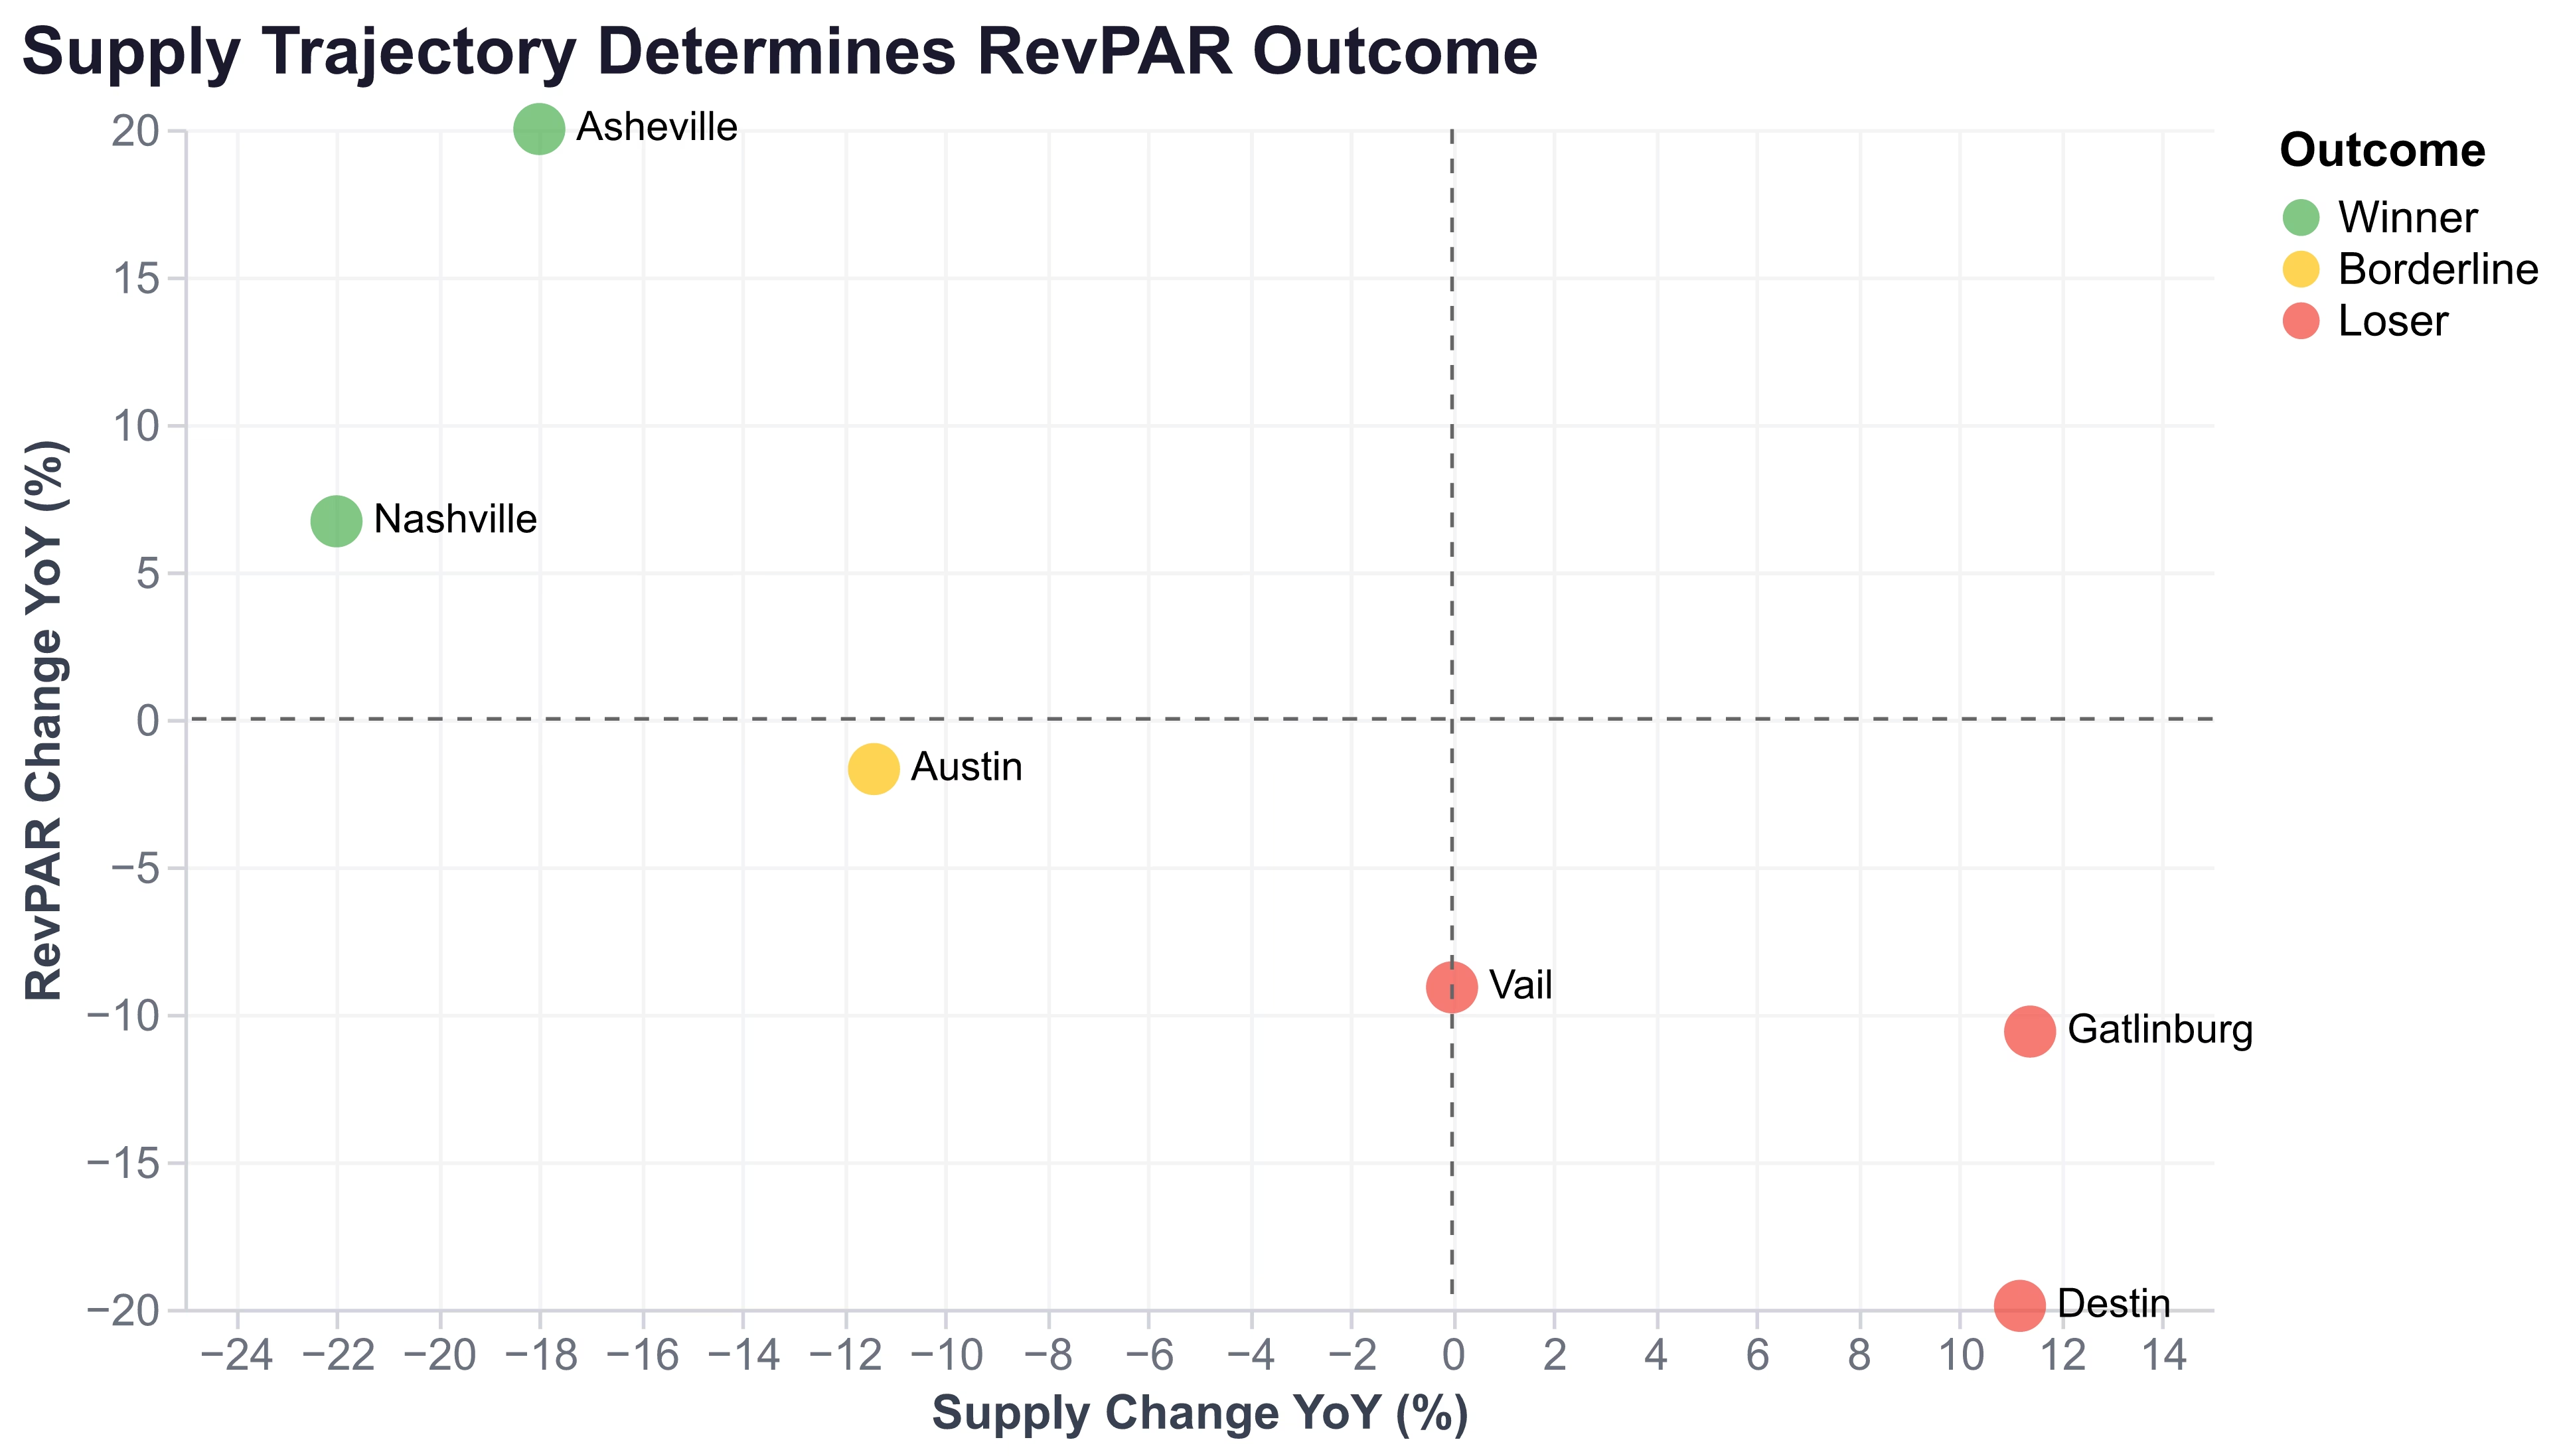
The correlation between supply trajectory and RevPAR outcome is stark. Markets in the upper-left quadrant (contracting supply, growing RevPAR) are the winners. Markets in the lower-right (growing supply, declining RevPAR) are the losers. The dividing line runs almost exactly through zero on the supply axis.
The Colorado Problem: 20% Rate Increases, Negative RevPAR
The Rocky Mountain region deserves separate treatment because Key Data's Q2 2026 Index specifically identified it as the one US region experiencing both occupancy AND RevPAR declines. AirROI's Vail data confirms the finding in granular detail.
"The Rocky Mountain region experienced declines in occupancy and RevPAR, highlighting the uneven nature of demand across markets. These differences highlight the need for localized strategies rather than broad, portfolio-wide approaches." — VRM Intel analysis of Key Data Q2 2026 Index
Vail's ski season numbers are striking:
| Month | 2025 ADR | 2026 ADR | Change | 2025 Occ | 2026 Occ | Change | RevPAR Impact |
|---|---|---|---|---|---|---|---|
| January | $909 | $1,100 | +20.9% | 46% | 38% | -8 ppts | -4.3% |
| February | $966 | $1,165 | +20.5% | 55% | 45% | -10 ppts | -9.1% |
| March | $918 | $1,113 | +21.3% | 50% | 38% | -12 ppts | -11.8% |
The pattern intensifies as the season progresses. January's 8-point occupancy loss produces a manageable 4.3% RevPAR decline. By March, the 12-point collapse yields an 11.8% loss — the worst single-month RevPAR performance of any market in this analysis.
The Vail case reveals a luxury demand ceiling. At $900-$1,000/night (2025 levels), Vail achieved 46-55% occupancy. At $1,100-$1,165/night (2026), occupancy fell to 38-45%. Affluent ski travelers — the segment presumably least price-sensitive — proved more elastic than operators assumed. The data suggests Vail's RevPAR-maximizing rate sits somewhere between 2025 and 2026 levels: high enough to reflect luxury positioning, low enough to maintain 45%+ fill rates.
This is not a Vail-specific problem. It is a regional pattern affecting the entire Rocky Mountain corridor. The combination of elevated rates, stable supply, and no incremental demand growth creates a structural headwind that rate increases alone cannot overcome.
Compressed Booking Windows: The Enabler and the Trap
One factor enabling rate-driven strategies nationally is the continuing compression of booking lead times. According to PriceLabs' 2026 analysis, "booking windows are compressing across the industry. This is a structural shift, not a temporary pattern."
AirROI's lead time data across major US markets shows median booking windows of 17-20 days in urban markets and 40-65 days in leisure markets — with the average July stay booking window shrinking from 34 days in 2022 to 29 days in 2026.
Compressed lead times create a dual-edged dynamic for rate-driven growth:
The enabler: Shorter booking windows allow hosts to hold higher rates longer without discounting. In a 60-day lead-time market, an unbooked date at 30 days out feels urgent. In a 20-day lead-time market, the same unbooked date is normal — the guest hasn't decided yet. Rate-disciplined hosts benefit because they avoid premature discounting.
The trap: By the time you realize occupancy is soft, the booking window has already closed. In Destin, where April lead times average 62 days, hosts who noticed collapsing occupancy in February had time to adjust. In Austin, where lead times average 39 days, the signal arrives too late for meaningful course correction.
For hosts in markets with sub-30-day booking windows, the connection to rate-driven growth strategy is immediate: you can hold rates for longer, but you must also accept that you are flying with less visibility. If your market's supply grew 10%+ and you raised rates 15%, you may not know the strategy failed until you are staring at an empty April calendar with 10 days of lead time remaining.
Host Strategy: Rate Push vs. Occupancy Protect by Market Type
The data points to a clear decision framework based on supply trajectory — not market type, not geography, not property class:
| Your Market's Supply Trend | Recommended Rate Strategy | Expected Outcome |
|---|---|---|
| Contracting >10% YoY | Push rates 15-20% | RevPAR grows 5-13% with 3-5 ppt occupancy loss |
| Contracting 5-10% YoY | Push rates 8-12% | RevPAR grows 2-6% with 2-4 ppt occupancy loss |
| Flat (±3% YoY) | Test 5-8% increase; monitor weekly | RevPAR flat to slightly positive if occupancy holds |
| Growing 5-10% YoY | Hold rates flat; differentiate on quality | Protect occupancy; accept flat RevPAR |
| Growing >10% YoY | Protect occupancy; consider rate cuts on slow periods | Avoid RevPAR decline; focus on fill rate |
Step 2: Know your breakeven. Calculate how much occupancy you can lose before a rate increase turns RevPAR-negative. If you are raising rates 15%, you can afford roughly a 7 percentage-point occupancy decline before you are worse off.
Step 3: Monitor weekly, not monthly. In compressed booking-window markets, monthly reviews arrive too late. Track your forward pacing weekly against same time last year. If bookings are 20%+ below STLY pace at the 3-week mark, your rates are set too high for current demand.
Frequently Asked Questions
Revenue is growing nationally — Key Data's Q2 2026 Index shows RevPAR pacing 8% higher YoY in April. But this growth is entirely rate-driven. Demand held flat in March 2026, meaning hosts are extracting more revenue per guest rather than attracting more guests. Whether individual hosts benefit depends on local supply dynamics.
AirROI data shows Destin, Florida experienced a catastrophic -19.9% RevPAR decline despite 14% ADR growth. Vail, Colorado saw RevPAR drop 9-12% across the ski season despite 20%+ ADR increases. Gatlinburg, Tennessee lost 10.6% of RevPAR with 12% higher rates. All three markets added 11%+ new listings while demand stayed flat.
Only if your local market's supply is contracting or stable. AirROI data shows rate increases produce positive RevPAR outcomes in markets losing listings (Nashville -22% supply saw +6.7% RevPAR growth) but backfire in growing markets (Destin +11% supply saw -19.9% RevPAR). Check active listing counts on AirROI Atlas before adjusting rates upward.
Key Data's Q2 2026 Index confirms both occupancy and RevPAR declined in the Rocky Mountain region. AirROI's Vail data shows ADR rose 20% to $1,165 per night but occupancy fell 10 percentage points to 45%, producing a net 9.1% RevPAR decline. The luxury ski segment hit a demand ceiling — affluent travelers proved more price-elastic than operators assumed.
The math is asymmetric: a 10 percentage-point occupancy drop requires a 25% ADR increase to maintain the same RevPAR. A 5-point drop needs 11% more ADR. A 15-point drop needs 43%. Most US markets in spring 2026 are experiencing 8-14 point occupancy declines with only 12-21% ADR gains — insufficient to maintain RevPAR where supply is growing.