Airbnb Q1 2026 Earnings: 5 Metrics Every Host Should Watch on May 7
Five numbers buried in Airbnb's Q1 2026 earnings report on May 7 will tell short-term rental hosts more about their business than any Wall Street analyst can. Airbnb guided Q1 revenue of $2.59 billion to $2.63 billion — 14-16% year-over-year growth — with GBV rising in the low teens and a "moderate ADR increase." Those sound like investor metrics. They are also the most precise preview of what is happening to your bookings, your pricing power, and your competitive landscape. AirROI data across four major US markets already shows the Q1 2026 pattern: ADR rose 11-37% year-over-year while occupancy softened, a divergence that Airbnb's aggregate numbers will almost certainly confirm at scale.
Why Airbnb Earnings Matter Even If You Don't Own ABNB Stock
Airbnb's quarterly earnings are the single best source of platform-wide intelligence that filters down to individual markets within 90 days. When the company reports a shift in pricing, demand, or supply strategy, hosts feel it through changed search algorithms, new fee structures, and competitive dynamics long before the next earnings cycle.
"We're not just maintaining our momentum; we're accelerating. These product improvements supported double-digit growth across our key top-line metrics in Q4." — Brian Chesky, CEO, Airbnb Q4 2025 shareholder letter
That acceleration is what the May 7 report will either confirm or revise. Here are the five metrics that translate corporate performance into host-level intelligence.
The 5 Airbnb Q1 2026 Metrics Hosts Should Track
1. Gross Booking Value (GBV) — Total Platform Spending Power
Gross booking value measures the total dollar amount guests spend on the platform before Airbnb takes its cut. For Q1 2026, Airbnb guided GBV growth in the low teens, following Q4 2025's $20.4 billion (+16% YoY).
The host translation: when GBV grows faster than nights booked, it means average transaction values are rising. In Q4 2025, GBV grew 16% while nights grew 10% — a 6-percentage-point gap that signals ADR appreciation. If Q1 2026 shows a similar spread, hosts operating in markets with strong pricing power are in a favorable position. If the gap narrows, it may indicate guests are trading down to cheaper listings or shorter stays.
GBV also reflects the impact of Airbnb's Reserve Now, Pay Later feature, which contributed over 200 basis points to nights growth and roughly 300 basis points to GBV growth in Q4 2025, according to CFO Elinor Mertz. Higher-priced bookings become accessible when guests can reserve with $0 upfront, inflating GBV without proportionally increasing demand volume.
2. Nights and Seats Booked — The Demand Barometer
Nights and seats booked is Airbnb's volume metric — the closest platform-level proxy for host occupancy. Airbnb guided high-single-digit growth for Q1 2026, consistent with the Q4 pace of 121.9 million (+10% YoY).
"Three product updates delivered over 200 basis points of growth in nights booked in Q4, and roughly 300 basis points of GBV growth." — Elinor Mertz, CFO, Airbnb Q4 2025 earnings call
Reserve Now, Pay Later and flexible cancellation policies are structural tailwinds baked into the Q1 numbers. Watch whether management credits organic demand growth or product-driven conversion on the call — the distinction matters for how sustainable the trajectory is.
3. Average Daily Rate (ADR) — Your Pricing Power Signal
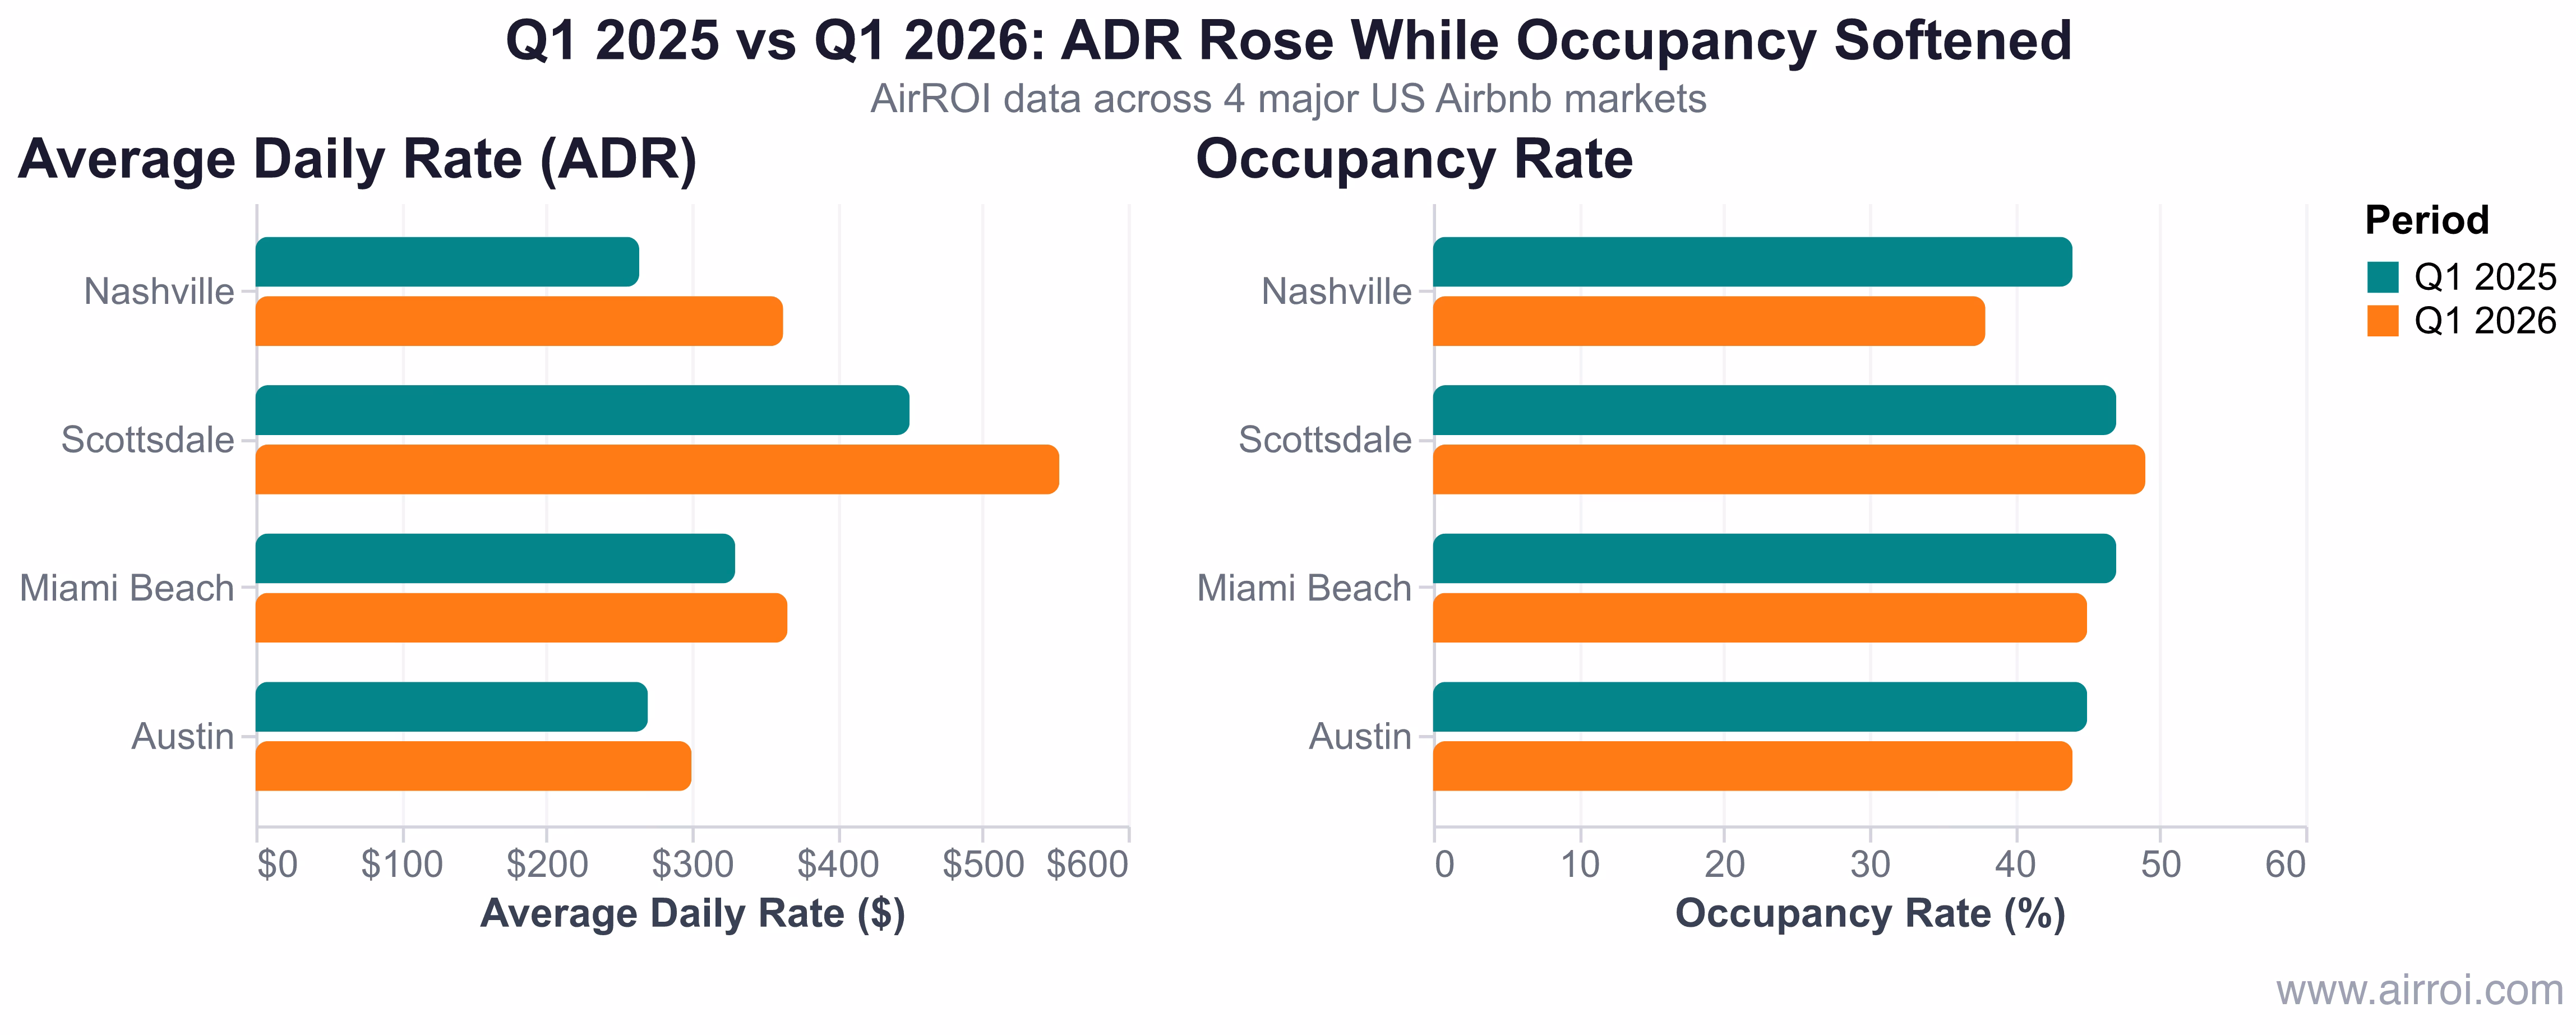
Airbnb guided a "moderate ADR increase" for Q1 2026. AirROI data tells a more specific story. Across four major US markets, Q1 2026 ADR growth ranged from 11% to 37% year-over-year — far exceeding "moderate" by any definition.
| Market | Q1 2025 Avg ADR | Q1 2026 Avg ADR | YoY Change | Q1 2025 Occupancy | Q1 2026 Occupancy | Occ. Change |
|---|---|---|---|---|---|---|
| Nashville | $264 | $363 | +37% | 44% | 38% | -6 pp |
| Scottsdale | $450 | $553 | +23% | 47% | 49% | +2 pp |
| Miami Beach | $330 | $366 | +11% | 47% | 45% | -2 pp |
| Austin | $270 | $300 | +11% | 45% | 44% | -1 pp |
Source: AirROI market data, Q1 2025 vs Q1 2026 monthly averages
The pattern is clear: ADR is rising across every market analyzed, while occupancy is flat to declining. Nashville's 37% ADR surge alongside a 6-percentage-point occupancy drop is the most dramatic example — hosts are earning more per booked night but booking fewer nights. Scottsdale is the outlier, delivering both higher rates and slightly improved occupancy during its peak winter season.
When Airbnb reports its platform-wide ADR on May 7, compare it to your market's AirROI data. If the platform shows a moderate 2-3% ADR increase but your market is up 20%+, you are in a pricing-power market that Airbnb's averages obscure.
4. Take Rate — How Much Airbnb Keeps Per Booking
The take rate (revenue divided by GBV) reveals how much Airbnb retains from each transaction. In Q4 2025, the implied take rate was 13.6%, down from 14.1% a year earlier. Airbnb noted the rate would be "up slightly year-over-year" in Q1 2026.
For hosts, the take rate matters because of the 2026 fee structure migration. Airbnb is moving most hosts to a single service fee of 15.5%, replacing the previous split model where hosts paid roughly 3% and guests paid a separate 14% service fee. The net economics are similar, but the visibility is different: hosts now see the full fee deducted from their payout.
5. Active Listings — The Supply Pressure Gauge
Airbnb reported approximately 9 million active listings worldwide as of early 2026, but the raw number masks two opposing forces. The company has removed over 550,000 low-quality listings since 2023 while simultaneously growing Guest Favorites — its quality designation for top-rated listings — by 30% in 2025 to represent nearly 50% of all bookings.
At the market level, supply dynamics vary dramatically. AirROI data shows Austin's active listings declined 9.7% year-over-year, from 10,311 in January 2025 to 9,310 in January 2026 — a meaningful supply contraction that should support pricing power for remaining hosts. Nashville holds 2,352 active listings, while Scottsdale tracks 4,720.
The supply quality story is the one hosts should track most closely. If Airbnb reports continued removal of low-quality listings alongside Guest Favorite growth, hosts who invest in quality ratings, professional photography, and responsive guest communication gain a structural advantage. Quality is becoming Airbnb's filtering mechanism, and the earnings call will reveal how aggressively management leans into it.
What AirROI Q1 2026 Data Already Reveals
Before Airbnb's official numbers drop on May 7, AirROI market data previews the story the earnings will tell. The pattern across four major US markets is consistent: ADR resilience despite occupancy pressure, driven by hosts who hold rates rather than chase bookings through discounting.
Scottsdale stands out as the strongest Q1 performer: $553 average ADR (+23% YoY), 49% occupancy (slightly improved), and a TTM RevPAR of $213 — driven by peak-season desert demand and a supply base of 4,720 listings that has not expanded meaningfully. For hosts in markets that mirror Scottsdale's profile (seasonal demand peaks, moderate supply, high-value guests), the Q1 earnings should confirm a pricing environment that rewards rate optimization.
The World Cup Wild Card in Forward Guidance
Q1 2026 results cover January through March — well before the FIFA World Cup kicks off on June 11. But the May 7 earnings call is where management will preview tournament demand, and Airbnb has been laying the groundwork.
"The FIFA World Cup 2026 is approaching fast, and fans from around the world are looking for places to stay in the communities we all call home. It's a once-in-a-lifetime opportunity for locals to open their doors and earn from the biggest sporting event on the planet." — Dave Stephenson, Chief Business Officer, Airbnb
Beyond Q1: What to Watch in Forward Guidance
The backward-looking Q1 numbers matter, but the forward guidance is where hosts find actionable intelligence. Five themes to track on the May 7 call:
Hotel listings expansion. Hotel bookings are growing at nearly double the platform's overall rate, currently representing a single-digit percentage of total nights booked. Airbnb is piloting hotel supply in New York, Los Angeles, Madrid, and San Francisco, focusing on boutique and independent properties. If management signals broader hotel rollout, STR hosts face a new competitive dimension within the platform itself.
Reserve Now, Pay Later global expansion. After driving 200+ basis points of nights growth in Q4 2025, RNPL is expanding to additional markets in 2026. Hosts should listen for whether management attributes Q1 growth to RNPL adoption or organic demand — the distinction determines how sustainable the demand boost is.
AI-powered customer support. Nearly 30% of support tickets in North America are now resolved by AI agents, with expansion to voice and global languages planned. Faster dispute resolution and reduced support wait times benefit hosts directly, and the earnings call will update progress metrics.
How to Use Earnings Data — Your Post-Call Action Plan
Earnings data is only valuable if you convert it into decisions. Here is a five-step framework for the May 7 call:
-
Read the shareholder letter first, not analyst summaries. Airbnb posts it on its Investor Relations site simultaneously with the results. The letter contains specific metrics that analysts filter through their stock-price lens.
-
Compare Airbnb's reported ADR growth to your market's trend. Pull your market's ADR from AirROI Atlas for January through March 2026 and calculate the YoY change. If Airbnb reports +3% ADR but your market shows +20%, you are in a pricing-power market that outperforms the platform average.
-
Compare nights booked growth to your occupancy. If Airbnb reports high-single-digit nights growth but your occupancy declined, your market is underperforming the platform — a signal to investigate local supply dynamics or competitive positioning.
-
Check your market's active listing count against the platform trend. If Airbnb reports continued listing growth but your market's supply is flat or declining (like Austin's 9.7% YoY drop), you have less competition than the headline suggests.
-
Listen for forward guidance that mentions your region or market type. World Cup host cities, European markets facing regulatory changes, and markets targeted for hotel expansion will all receive specific commentary.
The gap between platform averages and individual market performance is where hosts make or lose money. The earnings call gives you the platform baseline; AirROI gives you the local reality.
Frequently Asked Questions
Airbnb releases Q1 2026 financial results after market close on May 7, 2026, followed by an audio webcast at 2:00 p.m. PT / 5:00 p.m. ET. The shareholder letter will be posted on Airbnb's Investor Relations website simultaneously with the earnings release.
Airbnb guided Q1 2026 revenue of $2.59 billion to $2.63 billion, representing 14-16% year-over-year growth. This includes an approximate 3-point foreign exchange tailwind after factoring in the company's hedging program. For the full year, management expects revenue growth to accelerate to at least low double digits.
Airbnb's Q4 2025 take rate was 13.6%, down from 14.1% a year earlier. In 2026, the company is migrating most hosts to a 15.5% single service fee, replacing the previous split-fee model where hosts paid roughly 3% and guests paid 14%. Hosts need to increase their listed prices by approximately 18.3% to maintain the same net payout under the new structure.
Q1 results cover January through March, so World Cup bookings will not appear in the reported numbers. However, forward guidance on the May 7 call will almost certainly highlight tournament demand. Airbnb launched a Host Earnings Calculator on April 8, host city searches are up 80%, and 1 in 6 World Cup guests are booking with Airbnb for the first time.
After the May 7 call, compare Airbnb's reported ADR growth and nights booked against your own market data on AirROI Atlas. If your market diverges significantly from platform averages, it signals local supply or demand dynamics that require a local strategy rather than following platform-wide trends.