Capilla del Monte Airbnb Market Analysis 2026: Short Term Rental Data & Vacation Rental Statistics in Córdoba, Argentina
Is Airbnb profitable in Capilla del Monte in 2026? Explore comprehensive Airbnb analytics for Capilla del Monte, Córdoba, Argentina to uncover income potential. This 2026 STR market report for Capilla del Monte, based on AirROI data from February 2025 to January 2026, reveals key trends in the niche market of 56 active listings.
Whether you're considering an Airbnb investment in Capilla del Monte, optimizing your existing vacation rental, or exploring rental arbitrage opportunities, understanding the Capilla del Monte Airbnb data is crucial. Leveraging the low regulation environment is key to maximizing your short term rental income potential. Let's dive into the specifics.
Key Capilla del Monte Airbnb Performance Metrics Overview
Monthly Airbnb Revenue Variations & Income Potential in Capilla del Monte (2026)
Understanding the monthly revenue variations for Airbnb listings in Capilla del Monte is key to maximizing your short term rental income potential. Seasonality significantly impacts earnings. Our analysis, based on data from the past 12 months, shows that the peak revenue month for STRs in Capilla del Monte is typically January, while November often presents the lowest earnings, highlighting opportunities for strategic pricing adjustments during shoulder and low seasons. Explore the typical Airbnb income in Capilla del Monte across different performance tiers:
- Best-in-class properties (Top 10%) achieve $995+ monthly, often utilizing dynamic pricing and superior guest experiences.
- Strong performing properties (Top 25%) earn $596 or more, indicating effective management and desirable locations/amenities.
- Typical properties (Median) generate around $338 per month, representing the average market performance.
- Entry-level properties (Bottom 25%) see earnings around $158, often with potential for optimization.
Average Monthly Airbnb Earnings Trend in Capilla del Monte
Capilla del Monte Airbnb Occupancy Rate Trends (2026)
Maximize your bookings by understanding the Capilla del Monte STR occupancy trends. Seasonal demand shifts significantly influence how often properties are booked. Typically, Januarysees the highest demand (peak season occupancy), while August experiences the lowest (low season). Effective strategies, like adjusting minimum stays or offering promotions, can boost occupancy during slower periods. Here's how different property tiers perform in Capilla del Monte:
- Best-in-class properties (Top 10%) achieve 64%+ occupancy, indicating high desirability and potentially optimized availability.
- Strong performing properties (Top 25%) maintain 42% or higher occupancy, suggesting good market fit and guest satisfaction.
- Typical properties (Median) have an occupancy rate around 23%.
- Entry-level properties (Bottom 25%) average 13% occupancy, potentially facing higher vacancy.
Average Monthly Occupancy Rate Trend in Capilla del Monte
Average Daily Rate (ADR) Airbnb Trends in Capilla del Monte (2026)
Effective short term rental pricing strategy in Capilla del Monte involves understanding monthly ADR fluctuations. The Average Daily Rate (ADR) for Airbnb in Capilla del Monte typically peaks in January and dips lowest during September. Leveraging Airbnb dynamic pricing tools or strategies based on this seasonality can significantly boost revenue. Here's a look at the typical nightly rates achieved:
- Best-in-class properties (Top 10%) command rates of $80+ per night, often due to premium features or locations.
- Strong performing properties (Top 25%) achieve nightly rates of $60 or more.
- Typical properties (Median) charge around $43 per night.
- Entry-level properties (Bottom 25%) earn around $33 per night.
Average Daily Rate (ADR) Trend by Month in Capilla del Monte
Get Live Capilla del Monte Market Intelligence 👇

Explore Real-time Analytics
Airbnb Seasonality Analysis & Trends in Capilla del Monte (2026)
Peak Season (January, February, March)
- Revenue averages $642 per month
- Occupancy rates average 40.8%
- Daily rates average $50
Shoulder Season
- Revenue averages $420 per month
- Occupancy maintains around 27.3%
- Daily rates hold near $49
Low Season (May, June, November)
- Revenue drops to average $312 per month
- Occupancy decreases to average 23.0%
- Daily rates adjust to average $49
Seasonality Insights for Capilla del Monte
- The Airbnb seasonality in Capilla del Monte shows highly seasonal trends requiring careful strategy. While the sections above show seasonal averages, it's also insightful to look at the extremes:
- During the high season, the absolute peak month showcases Capilla del Monte's highest earning potential, with monthly revenues capable of climbing to $804, occupancy reaching a high of 45.3%, and ADRs peaking at $53.
- Conversely, the slowest single month of the year, typically falling within the low season, marks the market's lowest point. In this month, revenue might dip to $308, occupancy could drop to 20.7%, and ADRs may adjust down to $47.
- Understanding both the seasonal averages and these monthly peaks and troughs in revenue, occupancy, and ADR is crucial for maximizing your Airbnb profit potential in Capilla del Monte.
Seasonal Strategies for Maximizing Profit
- Peak Season: Maximize revenue through premium pricing and potentially longer minimum stays. Ensure high availability.
- Low Season: Offer competitive pricing, special promotions (e.g., extended stay discounts), and flexible cancellation policies. Target off-season travelers like remote workers or budget-conscious guests.
- Shoulder Seasons: Implement dynamic pricing that balances peak and low rates. Target weekend travelers or specific events. Offer slightly more flexible terms than peak season.
- Regularly analyze your own performance against these Capilla del Monte seasonality benchmarks and adjust your pricing and availability strategy accordingly.
Best Areas for Airbnb Investment in Capilla del Monte (2026)
Exploring the top neighborhoods for short-term rentals in Capilla del Monte? This section highlights key areas, outlining why they are attractive for hosts and guests, along with notable local attractions. Consider these locations based on your target guest profile and investment strategy.
| Neighborhood / Area | Why Host Here? (Target Guests & Appeal) | Key Attractions & Landmarks |
|---|---|---|
| Centro de Capilla del Monte | Main hub of activities, dining, and shopping. Close to popular attractions like the Uritorco hill, attracting tourists year-round. | Uritorco hill, Plaza San Martín, Standing Stone, Museo de Capilla del Monte, local artisan shops |
| Barrio El Zapato | Peaceful neighborhood with beautiful views of the Sierras. Ideal for nature lovers and those seeking tranquility. | El Zapato hill, natural reserves, hiking trails, birdwatching spots, small local restaurants |
| Los Cocos | A charming village located a short drive away from Capilla del Monte. Great for hosting visitors looking for a rural escape. | Los Cocos River, Cascada Del Río Los Cocos, local handicrafts, tranquil nature walks, family-friendly activities |
| La Falda | Nearby picturesque town with a variety of outdoor activities and cultural events, appealing to families and adventure seekers. | Cerro La Banderita, La Falda's Arts and Crafts Fair, local wineries, natural parks, scenic viewpoints |
| Córdoba Sierras | Stunning highland area attracting tourists for its stunning landscapes and outdoor activities. A bit remote, but offers exceptional natural beauty. | hiking opportunities, waterfalls, stargazing, agrotourism farms, scenic drives |
| Casa de Piedra | Known for its unique geological formations and natural beauty, it's optimal for eco-tourism and adventure sports. | Casa de Piedra formations, rock climbing spots, eco-tourism trails, scenic vistas, local guides |
| Villa de Capilla | A quaint area in Capilla that provides easy access to nature and local culture, ideal for relaxed stays. | local arts scene, community events, traditional cuisine, historical landmarks, cultural workshops |
| Pueblo de los Cuentos | A thematic village designed for families, perfect for visitors looking for a unique and whimsical experience. | story-themed park, family-friendly activities, craft workshops, narrative trails, nature exploration |
Understanding Airbnb License Requirements & STR Laws in Capilla del Monte (2026)
While Capilla del Monte, Córdoba, Argentina currently shows low STR regulations, specific Airbnb license requirements might still exist or change. Always verify the latest short term rental regulations and Airbnb license requirements directly with local government authorities for Capilla del Monte to ensure full compliance before hosting.
(Source: AirROI data, 2026, based on 4% licensed listings)
Top Performing Airbnb Properties in Capilla del Monte (2026)
Benchmark your potential! Explore examples of top-performing Airbnb properties in Capilla del Montebased on Trailing Twelve Month (TTM) revenue. Analyze their characteristics, revenue, occupancy rate, and ADR to understand what drives success in this market.

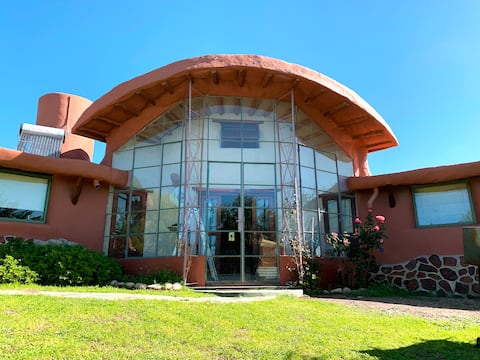
House with a view of the dike and a pool
Entire Place • 2 bedrooms
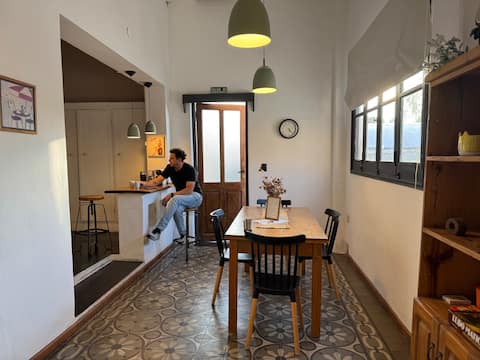
Cozy and quiet downtown apartment with barbecue
Entire Place • 2 bedrooms

Entire house, unparalleled view of Uritorco Hill
Entire Place • 3 bedrooms
Misky Wayra ll Cabin
Entire Place • N/A
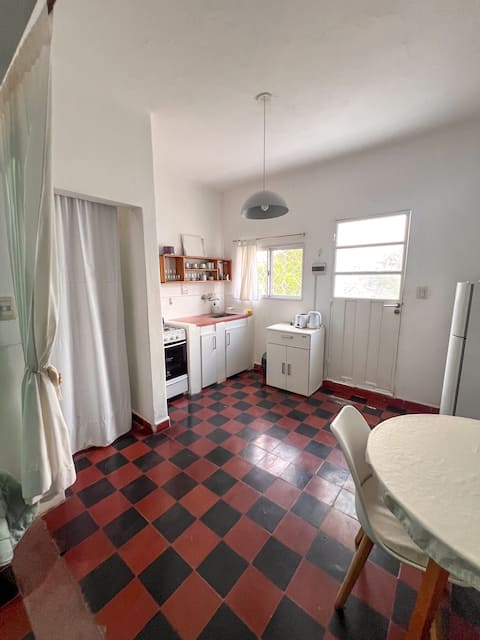
Comfortable and quiet apartment near downtown
Entire Place • 2 bedrooms
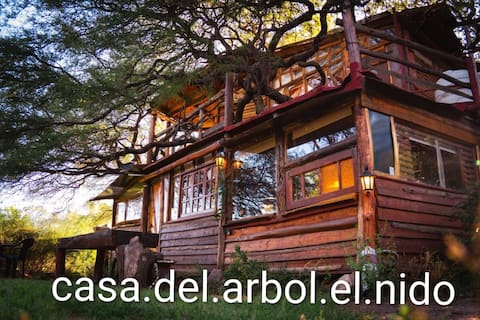
the nest The Treehouse
Entire Place • 2 bedrooms
Note: Performance varies based on location, size, amenities, seasonality, and management quality. Data reflects the past 12 months.
Top Performing Airbnb Hosts in Capilla del Monte (2026)
Learn from the best! This table showcases top-performing Airbnb hosts in Capilla del Monte based on the number of properties managed and estimated total revenue over the past year. Analyze their scale and performance metrics.
| Host Name | Properties | Grossing Revenue | Stay Reviews | Avg Rating |
|---|---|---|---|---|
| Alejandra | 1 | $17,543 | 38 | 4.84/5.0 |
| Jose | 2 | $15,025 | 8 | 4.50/5.0 |
| Emi | 2 | $14,187 | 116 | 4.95/5.0 |
| Silvana | 1 | $11,827 | 95 | 4.91/5.0 |
| Eduardo | 1 | $10,503 | 123 | 4.86/5.0 |
| Cabañas Morada Del Cerro | 2 | $7,807 | 31 | 4.83/5.0 |
| Elias Sanchez | 6 | $7,595 | 20 | 5.00/5.0 |
| Martín | 1 | $7,085 | 55 | 4.96/5.0 |
| Casas | 2 | $6,113 | 19 | 4.66/5.0 |
| Mariela | 2 | $6,032 | 15 | 4.71/5.0 |
Analyzing the strategies of top hosts, such as their property selection, pricing, and guest communication, can offer valuable lessons for optimizing your own Airbnb operations in Capilla del Monte.
Dive Deeper: Advanced Capilla del Monte STR Market Data (2026)
Ready to unlock more insights? AirROI provides access to advanced metrics and comprehensive Airbnb data for Capilla del Monte. Explore detailed analytics beyond this report to refine your investment strategy, optimize pricing, and maximize your vacation rental profits.
Explore Advanced MetricsCapilla del Monte Short-Term Rental Market Composition (2026): Property & Room Types
Room Type Distribution
Property Type Distribution
Market Composition Insights for Capilla del Monte
- The Capilla del Monte Airbnb market composition is heavily skewed towards Entire Home/Apt listings, which make up 69.6% of the 56 active rentals. This indicates strong guest preference for privacy and space.
- However, a notable 28.6% share for Private Rooms suggests opportunities for budget-conscious travelers or hosts renting out spare rooms.
- Looking at the property type distribution in Capilla del Monte, House properties are the most common (48.2%), reflecting the local real estate landscape.
- Houses represent a significant 48.2% portion, catering likely to families or larger groups.
- The presence of 16.1% Hotel/Boutique listings indicates integration with traditional hospitality.
- Smaller segments like others (combined 1.8%) offer potential for unique stay experiences.
Capilla del Monte Airbnb Room Capacity Analysis (2026): Bedroom Distribution
Distribution of Listings by Number of Bedrooms
Room Capacity Insights for Capilla del Monte
- The dominant room capacity in Capilla del Monte is 1 bedroom listings, making up 42.9% of the market. This suggests a strong demand for properties suitable for couples or solo travelers.
- Together, 1 bedroom and 2 bedrooms properties represent 76.8% of the active Airbnb listings in Capilla del Monte, indicating a high concentration in these sizes.
- Listings with 3+ bedrooms (3.6%) represent a smaller niche, potentially indicating an underserved market for larger group accommodations in Capilla del Monte.
Capilla del Monte Vacation Rental Guest Capacity Trends (2026)
Distribution of Listings by Guest Capacity
Guest Capacity Insights for Capilla del Monte
- The most common guest capacity trend in Capilla del Monte vacation rentals is listings accommodating 4 guests (32.1%). This suggests the primary traveler segment is likely small families or groups.
- Properties designed for 4 guests and 2 guests dominate the Capilla del Monte STR market, accounting for 50.0% of listings.
- 12.5% of properties accommodate 6+ guests, serving the market segment for larger families or group travel in Capilla del Monte.
- On average, properties in Capilla del Monte are equipped to host 3.2 guests.
Capilla del Monte Airbnb Booking Patterns (2026): Available vs. Booked Days
Available Days Distribution
Booked Days Distribution
Booking Pattern Insights for Capilla del Monte
- The most common availability pattern in Capilla del Monte falls within the 271-366 days range, representing 78.6% of listings. This suggests many properties have significant open periods on their calendars.
- Approximately 92.9% of listings show high availability (181+ days open annually), indicating potential for increased bookings or specific owner usage patterns.
- For booked days, the 31-90 days range is most frequent in Capilla del Monte (39.3%), reflecting common guest stay durations or potential owner blocking patterns.
- A notable 7.1% of properties secure long booking periods (181+ days booked per year), highlighting successful long-term rental strategies or significant owner usage.
Capilla del Monte Airbnb Minimum Stay Requirements Analysis
Distribution of Listings by Minimum Night Requirement
1 Night
21 listings
37.5% of total
2 Nights
11 listings
19.6% of total
3 Nights
9 listings
16.1% of total
4-6 Nights
1 listings
1.8% of total
30+ Nights
14 listings
25% of total
Key Insights
- The most prevalent minimum stay requirement in Capilla del Monte is 1 Night, adopted by 37.5% of listings. This highlights the market's preference for shorter, flexible bookings.
- A significant segment (25%) caters to monthly stays (30+ nights) in Capilla del Monte, pointing to opportunities in the extended-stay market.
Recommendations
- Align with the market by considering a 1 Night minimum stay, as 37.5% of Capilla del Monte hosts use this setting.
- Explore offering discounts for stays of 30+ nights to attract the 25% of the market seeking extended stays.
- Adjust minimum nights based on seasonality – potentially shorter during low season and longer during peak demand periods in Capilla del Monte.
Capilla del Monte Airbnb Cancellation Policy Trends Analysis (2026)
Limited
1 listings
1.8% of total
Flexible
34 listings
60.7% of total
Moderate
10 listings
17.9% of total
Firm
11 listings
19.6% of total
Cancellation Policy Insights for Capilla del Monte
- The prevailing Airbnb cancellation policy trend in Capilla del Monte is Flexible, used by 60.7% of listings.
- The market strongly favors guest-friendly terms, with 78.6% of listings offering Flexible or Moderate policies. This suggests guests in Capilla del Monte may expect booking flexibility.
Recommendations for Hosts
- Consider adopting a Flexible policy to align with the 60.7% market standard in Capilla del Monte.
- Given the high prevalence of Flexible policies (60.7%), offering this can enhance booking appeal, especially during shoulder seasons.
- Regularly review your cancellation policy against competitors and market demand shifts in Capilla del Monte.
Capilla del Monte STR Booking Lead Time Analysis (2026)
Average Booking Lead Time by Month
Booking Lead Time Insights for Capilla del Monte
- The overall average booking lead time for vacation rentals in Capilla del Monte is 22 days.
- Guests book furthest in advance for stays during January (average 33 days), likely coinciding with peak travel demand or local events.
- The shortest booking windows occur for stays in June (average 12 days), indicating more last-minute travel plans during this time.
- Seasonally, Winter (24 days avg.) sees the longest lead times, while Summer (19 days avg.) has the shortest, reflecting typical travel planning cycles.
Recommendations for Hosts
- Use the overall average lead time (22 days) as a baseline for your pricing and availability strategy in Capilla del Monte.
- For January stays, consider implementing length-of-stay discounts or slightly higher rates for bookings made less than 33 days out to capitalize on advance planning.
- During June, focus on last-minute booking availability and promotions, as guests book with very short notice (12 days avg.).
- Target marketing efforts for the Winter season well in advance (at least 24 days) to capture early planners.
- Monitor your own booking lead times against these Capilla del Monte averages to identify opportunities for dynamic pricing adjustments.
Popular & Essential Airbnb Amenities in Capilla del Monte (2026)
Amenity Prevalence
Amenity Insights for Capilla del Monte
- Essential amenities in Capilla del Monte that guests expect include: Wifi. Lacking these (this) could significantly impact bookings.
- Popular amenities like Kitchen, Hot water, Free parking on premises are common but not universal. Offering these can provide a competitive edge.
Recommendations for Hosts
- Ensure your listing includes all essential amenities for Capilla del Monte: Wifi.
- Prioritize adding missing essentials: Wifi.
- Consider adding popular differentiators like Kitchen or Hot water to increase appeal.
- Highlight unique or less common amenities you offer (e.g., hot tub, dedicated workspace, EV charger) in your listing description and photos.
- Regularly check competitor amenities in Capilla del Monte to stay competitive.
Capilla del Monte Airbnb Guest Demographics & Profile Analysis (2026)
Guest Profile Summary for Capilla del Monte
- The typical guest profile for Airbnb in Capilla del Monte consists of primarily domestic travelers (65%), often arriving from nearby Buenos Aires, typically belonging to the Post-2000s (Gen Z/Alpha) group (50%), primarily speaking English or Spanish.
- Domestic travelers account for 65.2% of guests.
- Key international markets include Argentina (65.2%) and United States (9.6%).
- Top languages spoken are English (41%) followed by Spanish (39.6%).
- A significant demographic segment is the Post-2000s (Gen Z/Alpha) group, representing 50% of guests.
Recommendations for Hosts
- Target domestic marketing efforts towards travelers from Buenos Aires and Córdoba.
- Tailor amenities and listing descriptions to appeal to the dominant Post-2000s (Gen Z/Alpha) demographic (e.g., highlight fast WiFi, smart home features, local guides).
- Highlight unique local experiences or amenities relevant to the primary guest profile.
- Consider seasonal promotions aligned with peak travel times for key origin markets.
Nearby Short-Term Rental Market Comparison
How does the Capilla del Monte Airbnb market stack up against its neighbors? Compare key performance metrics like average monthly revenue, ADR, and occupancy rates in surrounding areas to understand the broader regional STR landscape.
| Market | Active Properties | Monthly Revenue | Daily Rate | Avg. Occupancy |
|---|---|---|---|---|
| Villa Berna | 25 | $1,104 | $136.98 | 28% |
| Mendiolaza | 13 | $983 | $140.30 | 32% |
| La Calera | 13 | $954 | $163.66 | 34% |
| Comuna de Potrero de Garay | 68 | $911 | $155.44 | 26% |
| Comuna de Los Reartes | 18 | $806 | $116.47 | 32% |
| La Cumbrecita | 13 | $733 | $170.33 | 24% |
| Villa Allende | 53 | $721 | $152.70 | 30% |
| Villa General Belgrano | 110 | $646 | $112.16 | 25% |
| Villa Ciudad Parque Los Reartes | 10 | $618 | $86.18 | 31% |
| Municipio de La Cumbre | 15 | $599 | $166.52 | 24% |