AirROI ranking · 202631 markets ranked
Best Places to Buy an Airbnb in Córdoba, Argentina (2026)
Cordoba is the best place to buy an Airbnb in Córdoba in 2026, according to AirROI's ranking of 31 markets. Its listings averaged ARS 8,130,000 in revenue over the 12 months to October 2026 and were booked on 37% of nights. It leads on the blend rather than on any one measure, placing 1st of 31 for market size, 1st of 31 for occupancy and 1st of 31 for year-round demand. Villa Allende and Villa General Belgrano come next.
- Markets tracked
- 51
- Active Airbnb listings
- 4,360
- Avg. revenue per listing
- ARS 8,290,000
- Occupancy rate
- 31%
- Avg. nightly rate
- ARS 129,000
- Revenue change, typical market
- +6%
The short answer
Córdoba Airbnb Market at a Glance
Across Córdoba, the 4,360 active Airbnb listings tracked by AirROI, a short-term-rental data firm, averaged ARS 8,290,000 over the same period. They were booked on 31% of nights at about ARS 129,000 a night; the ranking covers the 31 markets with at least 30 active listings. Revenue per listing rose in 9 of the 13 ranked markets with a comparable year of data, by 6% in the typical one.
The ranking weighs revenue per listing most, then occupancy and market size, then how evenly income spreads across the year and how it changed on the year. It reflects rental performance, not purchase prices or local short-term rental rules. How the ranking works.
Where the top 10 Airbnb markets in Córdoba are
Each dot is one of the 51 markets AirROI tracks in Córdoba, sized by active listings and coloured by average revenue per listing. Select a number to jump to its profile.
Money figures on this page are in Argentine pesos, converted from US dollars at ARS 1,448 per US$, the typical rate from November 2025 to October 2026.
Top 10
The Top 10 Airbnb Markets in Córdoba
Each profile draws on the market's full AirROI report: how it earns, when in the year, who books and what sells. Monthly figures are averages per listing active in that month, so twelve of them add up to more than the annual average, which also counts listings that operated for only part of the year.
| # | Market | Avg. revenue | Occupancy |
|---|---|---|---|
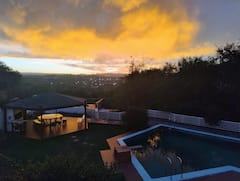 Cordoba Large market · High occupancy | ARS 8,130,000 | 37% | |
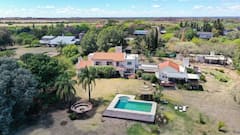 Villa Allende High earnings · Growing revenue | ARS 17,400,000 | 28% | |
 Villa General Belgrano Large market · High earnings | ARS 11,600,000 | 27% | |
| 4 | 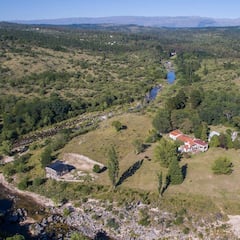 Los Reartes High occupancy · High earnings | ARS 10,500,000 | 32% |
| 5 |  Villa Carlos Paz Large market · High earnings | ARS 8,330,000 | 30% |
| 6 | 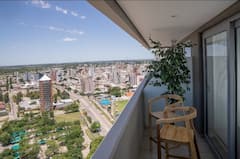 Río Cuarto Year-round demand · Growing revenue | ARS 5,720,000 | 31% |
| 7 | 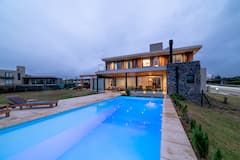 Comuna de Potrero de Garay High earnings | ARS 18,000,000 | 29% |
| 8 | 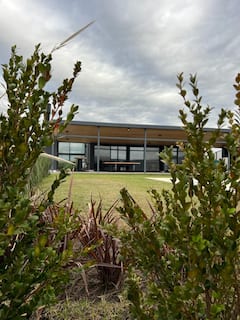 La Estancia High earnings | ARS 14,300,000 | 29% |
| 9 | 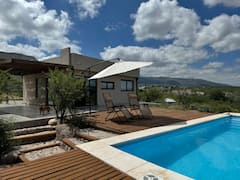 Capilla del Monte Growing revenue | ARS 5,650,000 | 29% |
| 10 | 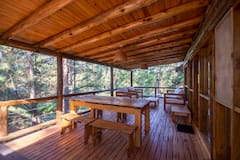 Villa Berna High earnings | ARS 16,300,000 | 28% |
1. Cordoba
Known for: Large market · High occupancy
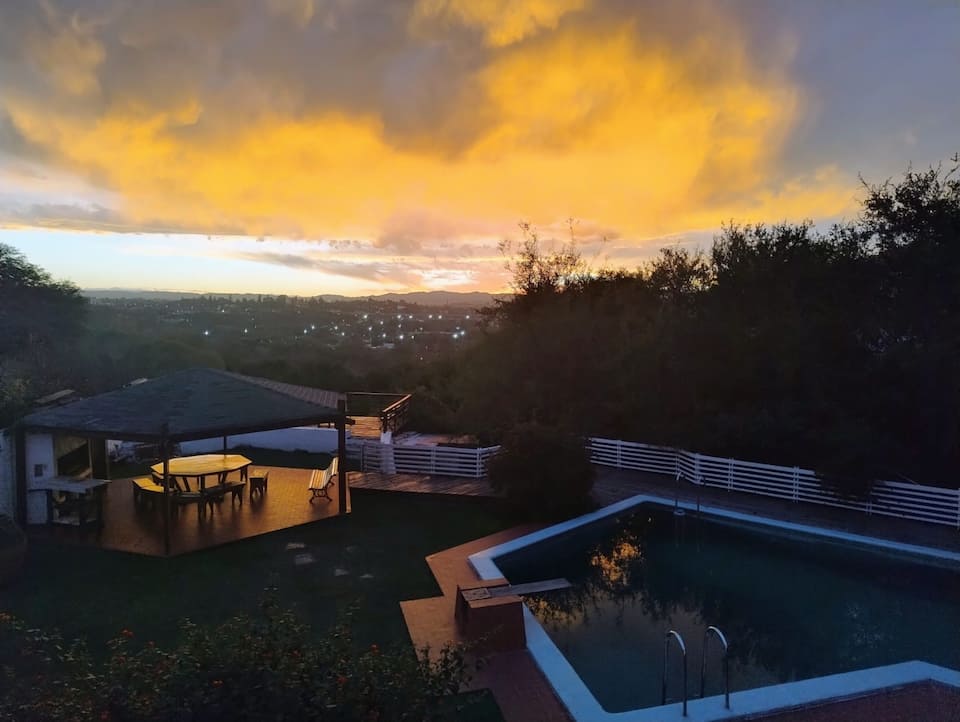

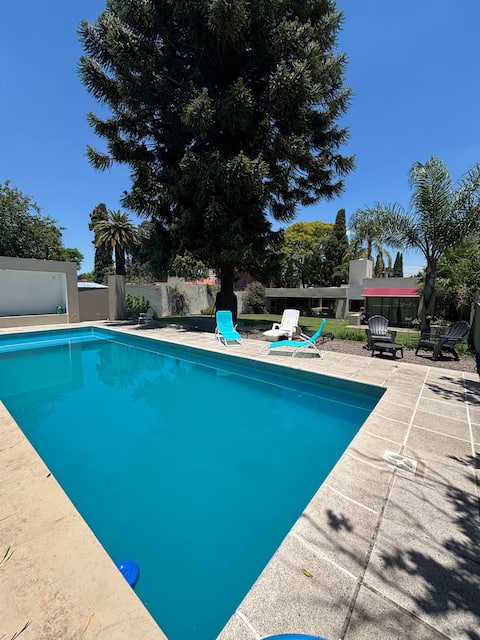
Top-earning Airbnb listings in Cordoba - Avg. revenue
- ARS 8,130,000 +21% vs. last year
- Occupancy
- 37%
- Nightly rate
- ARS 95,300
- Active listings
- 1,540
Where it places among the 31 ranked markets in Córdoba
- Revenue 12th of 31
- Occupancy 1st of 31
- Market size 1st of 31
- Year-round 1st of 31
- Growth 5th of 13
- How it earns
- Cordoba earns on volume. Rates run below the Córdoba average at about ARS 95,300 a night, but listings book 37% of nights. Revenue per listing, ARS 8,130,000, is close to the Córdoba average. A typical listing takes in about ARS 863,000 a month; the top quarter clear ARS 1,460,000 or more. Revenue per listing rose 21% over the year, helped by nightly rates 29% higher.
- When it earns
- Demand in Cordoba holds up through the year: November, the slowest month, still brings in about three-quarters of July's revenue. Trips run long, about 6 nights on average against 5 nights for the typical market in Córdoba, booked about 22 days ahead.
- Who books
- Nearly four in ten guests (39%) travel from abroad, most often from the United States and Brazil.
- What sells
- The most common entire home has 1 bedroom (65% of entire homes), and apartments and condos make up 82% of supply.
- Who it suits
- It suits buyers who want income that holds up all year and would rather price for occupancy than for rate.
Revenue per listing by month
ARS 1,210,000 ARS 876,000- Median listing
- ARS 863,000/mo
- Top 25% of listings
- ARS 1,460,000+/mo
- Booked ahead
- 22 days
- Average stay
- 6 nights
- Guests from abroad
- 39%
- Most common home size
- 1 bedroom
Areas in the full report: Nueva Córdoba · Córdoba City Center · Guadalquivir Riverfront
Full Cordoba Airbnb report2. Villa Allende
Known for: High earnings · Growing revenue
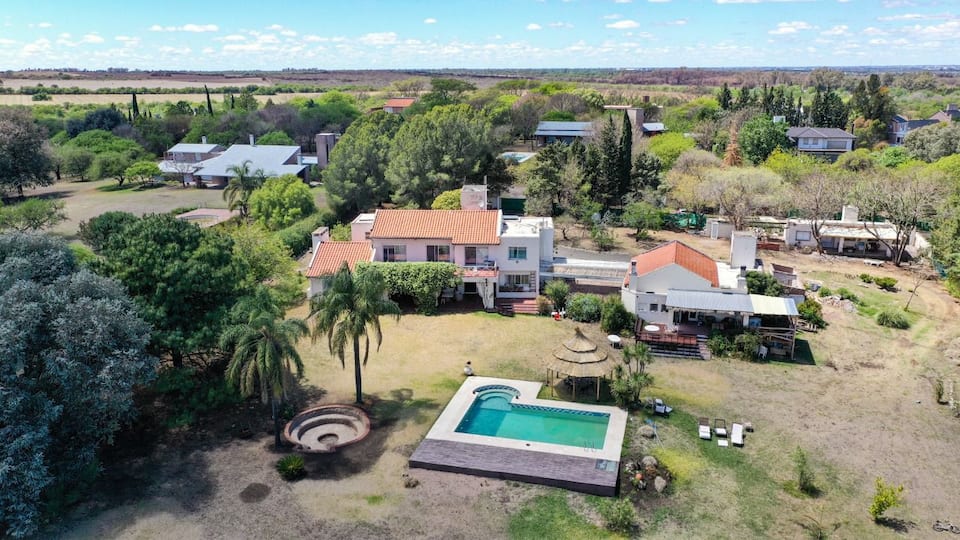


Top-earning Airbnb listings in Villa Allende - Avg. revenue
- ARS 17,400,000 +33% vs. last year
- Occupancy
- 28%
- Nightly rate
- ARS 257,000
- Active listings
- 64
Where it places among the 31 ranked markets in Córdoba
- Revenue 2nd of 31
- Occupancy 16th of 31
- Market size 13th of 31
- Year-round 5th of 31
- Growth 2nd of 13
- How it earns
- Villa Allende earns on price: guests pay about ARS 257,000 a night, about twice the Córdoba average. Listings averaged ARS 17,400,000 in revenue over the year, the second-highest of the 31 ranked markets. In a typical month the median listing brings in about ARS 1,370,000, and the best quarter clear ARS 2,830,000. Revenue per listing rose 33% over the year, the second-biggest gain in Córdoba, helped by nightly rates 8% higher, even as the number of listings grew 26%. With 64 listings it is a small market, so its averages can move more from year to year.
- When it earns
- Villa Allende has two seasons, December–March and August–September. December is the strongest month at about ARS 2,810,000 per listing, and May the quietest at about ARS 1,390,000.
- What sells
- One-bedroom homes lead the market (42% of entire homes), and houses make up 47% of supply.
- Who books
- About a quarter of guests (26%) travel from abroad, most often from the United States and Canada.
- Who it suits
- Best for buyers who can furnish and price for a premium stay and want a large home for groups and families.
Revenue per listing by month
ARS 2,810,000 ARS 1,390,000- Median listing
- ARS 1,370,000/mo
- Top 25% of listings
- ARS 2,830,000+/mo
- Booked ahead
- 26 days
- Average stay
- 4 nights
- Most common home size
- 1 bedroom
- Superhosts
- 36%
3. Villa General Belgrano
Known for: Large market · High earnings
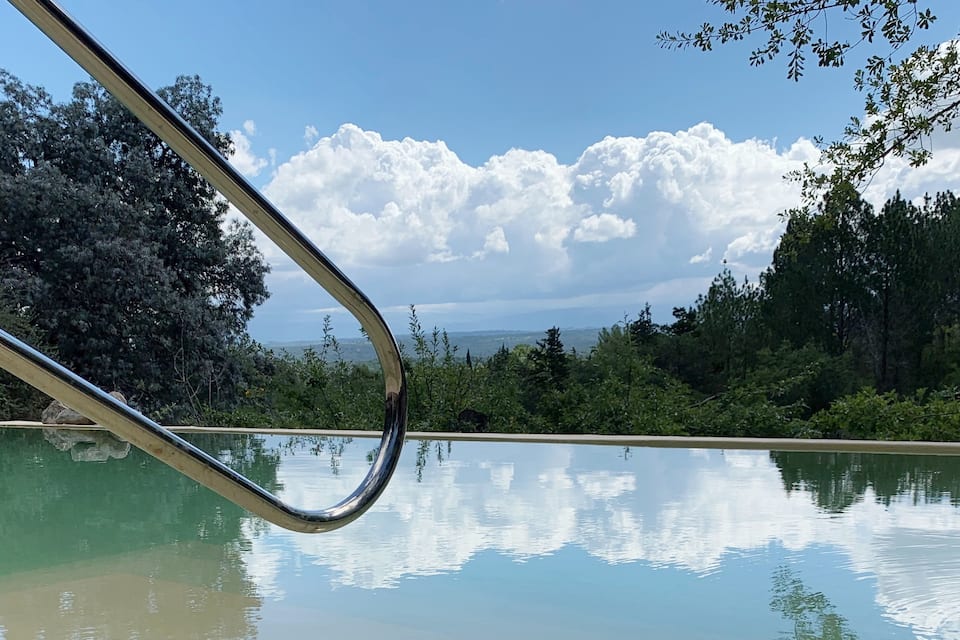


Top-earning Airbnb listings in Villa General Belgrano - Avg. revenue
- ARS 11,600,000 +20% vs. last year
- Occupancy
- 27%
- Nightly rate
- ARS 174,000
- Active listings
- 190
Where it places among the 31 ranked markets in Córdoba
- Revenue 5th of 31
- Occupancy 19th of 31
- Market size 3rd of 31
- Year-round 8th of 31
- Growth 6th of 13
- How it earns
- Villa General Belgrano is Córdoba's third-largest Airbnb market, with 190 active listings to price against. Listings averaged ARS 11,600,000 in revenue over the year, the fifth-highest of the 31 ranked markets. Month to month, the median listing earns about ARS 1,010,000 and a top-quarter listing ARS 2,070,000 or more. Revenue per listing rose 20% over the year, helped by nightly rates 6% higher, even as the number of listings grew 57%.
- When it earns
- Villa General Belgrano's season runs from December to February, peaking in January at about ARS 2,470,000 per listing; May, the quietest month, brings in about ARS 1,040,000.
- What sells
- The most common entire home has 2 bedrooms (44% of entire homes), and houses make up 30% of supply.
- Who books
- About a quarter of guests (25%) travel from abroad, most often from the United States and Uruguay.
Revenue per listing by month
ARS 2,470,000 ARS 1,040,000- Median listing
- ARS 1,010,000/mo
- Top 25% of listings
- ARS 2,070,000+/mo
- Booked ahead
- 29 days
- Average stay
- 4 nights
- Most common home size
- 2 bedrooms
- Superhosts
- 42%
4. Los Reartes
Known for: High occupancy · High earnings
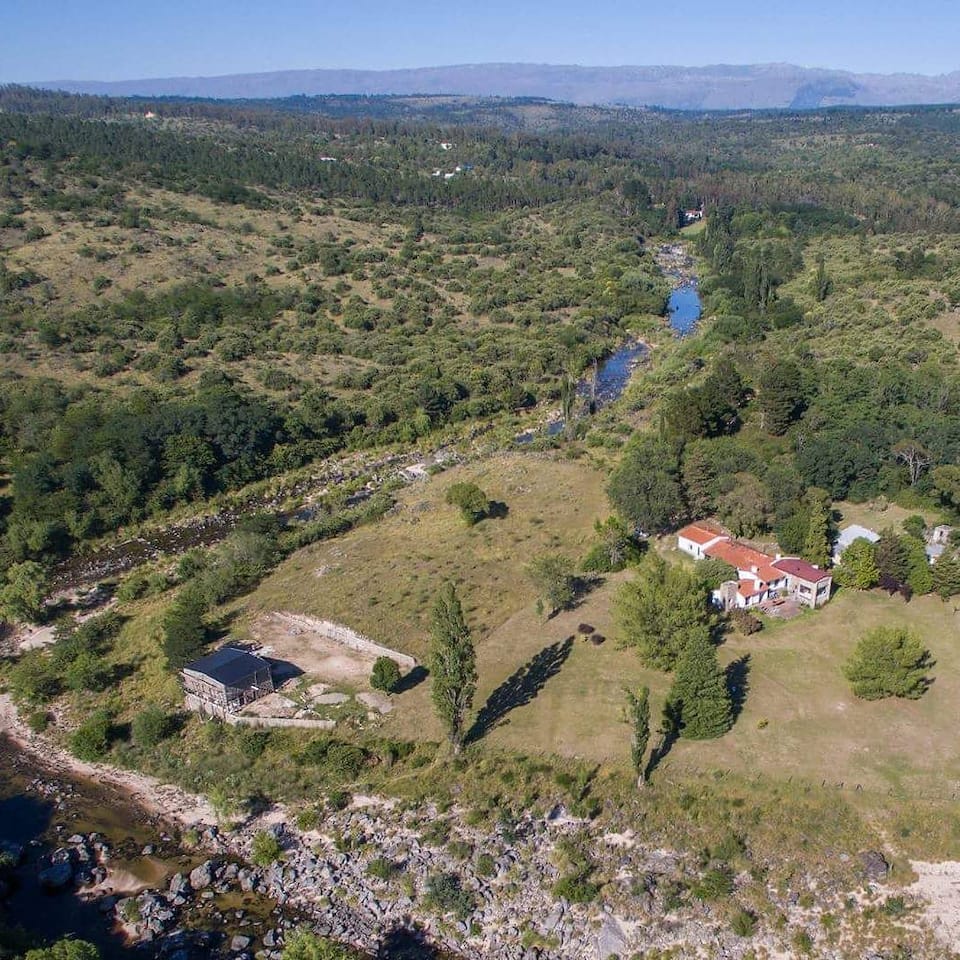


Top-earning Airbnb listings in Los Reartes - Avg. revenue
- ARS 10,500,000
- Occupancy
- 32%
- Nightly rate
- ARS 162,000
- Active listings
- 50
Where it places among the 31 ranked markets in Córdoba
- Revenue 6th of 31
- Occupancy 3rd of 31
- Market size 19th of 31
- Year-round 6th of 31
- Growth No prior year
- How it earns
- Los Reartes listings charge about ARS 162,000 a night, 26% above the Córdoba average, and are booked on 32% of nights. That adds up to ARS 10,500,000 per listing over the year, the sixth-highest of the 31 ranked markets. A typical listing takes in about ARS 1,270,000 a month; the top quarter clear ARS 2,150,000 or more. Its 50 listings make it one of the smaller ranked markets, so its figures are less settled than those of larger ones.
- When it earns
- Revenue in Los Reartes peaks twice, over July–August and again over January–February; January leads at about ARS 2,790,000 per listing, while April brings in about ARS 1,220,000. Guests stay about 6 nights, longer than in most of Córdoba, and book about 26 days ahead.
- What sells
- Two-bedroom homes lead the market (56% of entire homes), and cabins, campers and other outdoor stays make up 48% of supply.
Revenue per listing by month
ARS 2,790,000 ARS 1,220,000- Median listing
- ARS 1,270,000/mo
- Top 25% of listings
- ARS 2,150,000+/mo
- Booked ahead
- 26 days
- Average stay
- 6 nights
- Most common home size
- 2 bedrooms
- Superhosts
- 30%
5. Villa Carlos Paz
Known for: Large market · High earnings
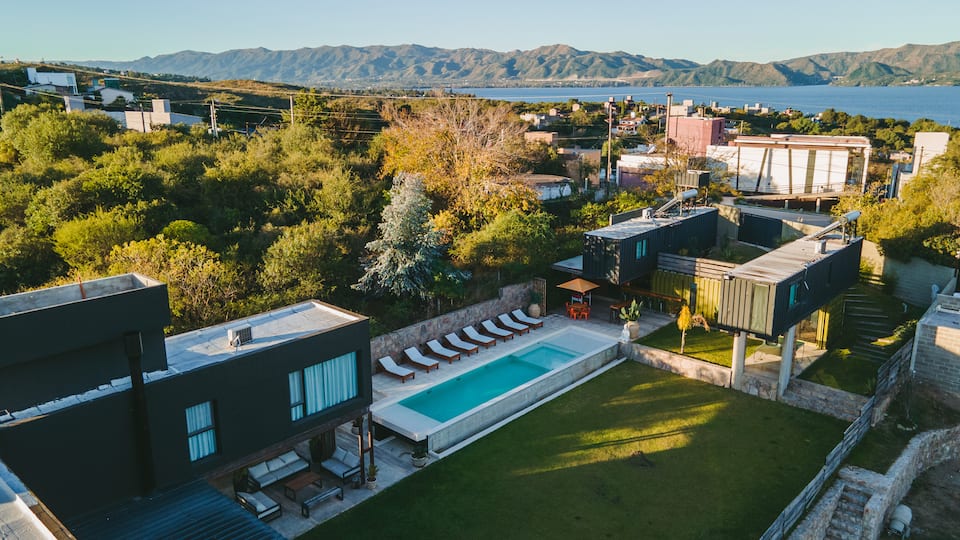


Top-earning Airbnb listings in Villa Carlos Paz - Avg. revenue
- ARS 8,330,000 −9% vs. last year
- Occupancy
- 30%
- Nightly rate
- ARS 143,000
- Active listings
- 700
Where it places among the 31 ranked markets in Córdoba
- Revenue 11th of 31
- Occupancy 7th of 31
- Market size 2nd of 31
- Year-round 10th of 31
- Growth 12th of 13
- How it earns
- Villa Carlos Paz is Córdoba's second-largest Airbnb market, with 700 active listings to price against. Revenue per listing, ARS 8,330,000, is close to the Córdoba average. In a typical month the median listing brings in about ARS 882,000, and the best quarter clear ARS 1,660,000. Revenue per listing slipped 9% over the year.
- When it earns
- Revenue in Villa Carlos Paz concentrates from December to February: January earns about ARS 2,610,000 per listing, about 2.7 times as much as June.
- What sells
- The most common entire home has 1 bedroom (47% of entire homes), and apartments and condos make up 64% of supply.
- Who it suits
- A good fit for buyers who can carry costs through a quiet June.
Revenue per listing by month
ARS 2,610,000 ARS 985,000- Median listing
- ARS 882,000/mo
- Top 25% of listings
- ARS 1,660,000+/mo
- Booked ahead
- 27 days
- Average stay
- 5 nights
- Most common home size
- 1 bedroom
- Superhosts
- 36%
Areas in the full report: Centro · El Paraíso · Las Tres Rosas
Full Villa Carlos Paz Airbnb report6. Río Cuarto
Known for: Year-round demand · Growing revenue
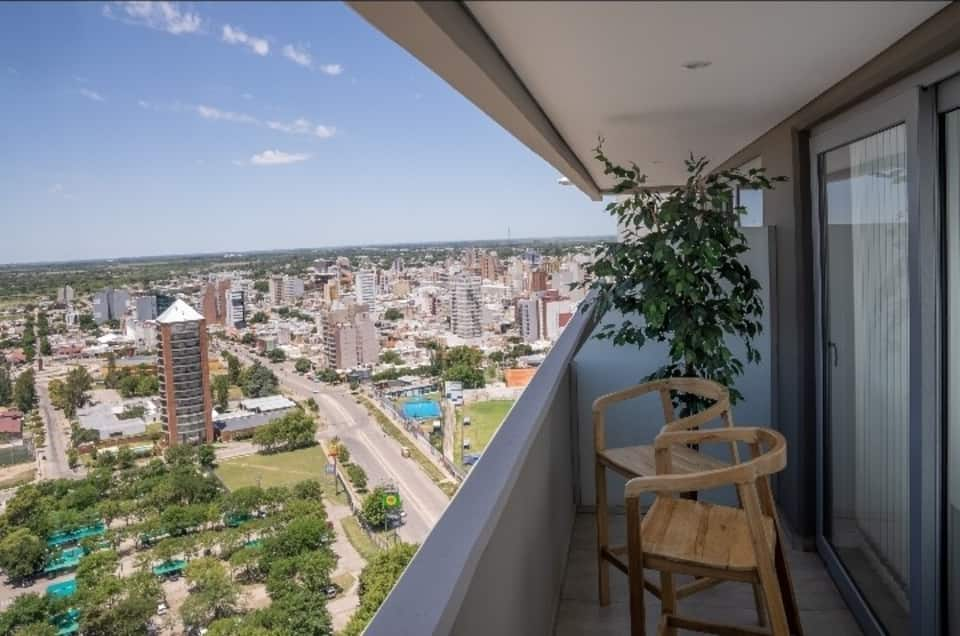
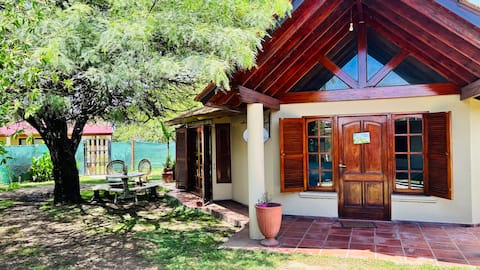
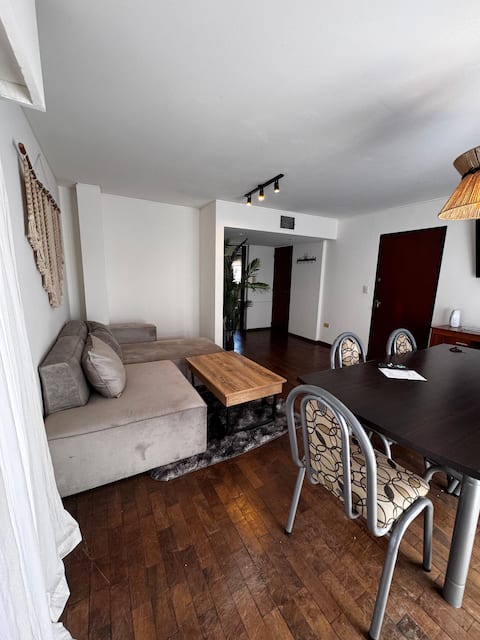
Top-earning Airbnb listings in Río Cuarto - Avg. revenue
- ARS 5,720,000 +25% vs. last year
- Occupancy
- 31%
- Nightly rate
- ARS 78,500
- Active listings
- 72
Where it places among the 31 ranked markets in Córdoba
- Revenue 19th of 31
- Occupancy 4th of 31
- Market size 8th of 31
- Year-round 2nd of 31
- Growth 4th of 13
- How it earns
- Río Cuarto is one of the steadier markets in Córdoba: October, its slowest month, still brings in about two-thirds of June's revenue. Moderate rates keep revenue per listing at ARS 5,720,000, 31% below the Córdoba average. Its place at #6 rests on year-round demand (2nd of 31) and occupancy (4th of 31) rather than on revenue per listing. Month to month, the median listing earns about ARS 675,000 and a top-quarter listing ARS 1,160,000 or more. Revenue per listing rose 25% over the year, helped by nightly rates 25% higher, even as the number of listings grew 64%. With 72 listings it is a small market, so its averages can move more from year to year.
- When it earns
- Most hosts take one- or two-night bookings (94% of listings), more than in the typical market.
- Guest expectations
- Average ratings (4.72 stars) trail the typical market in Córdoba (4.82), which leaves room for a well-run listing to stand out.
- Who books
- More than a third of guests (35%) travel from abroad, most often from Brazil and Uruguay.
- Who it suits
- It suits buyers who want income that holds up all year.
Revenue per listing by month
ARS 862,000 ARS 556,000- Median listing
- ARS 675,000/mo
- Top 25% of listings
- ARS 1,160,000+/mo
- Booked ahead
- 22 days
- Average stay
- 5 nights
- Guests from abroad
- 35%
- Most common home size
- 1 bedroom
7. Comuna de Potrero de Garay
Known for: High earnings
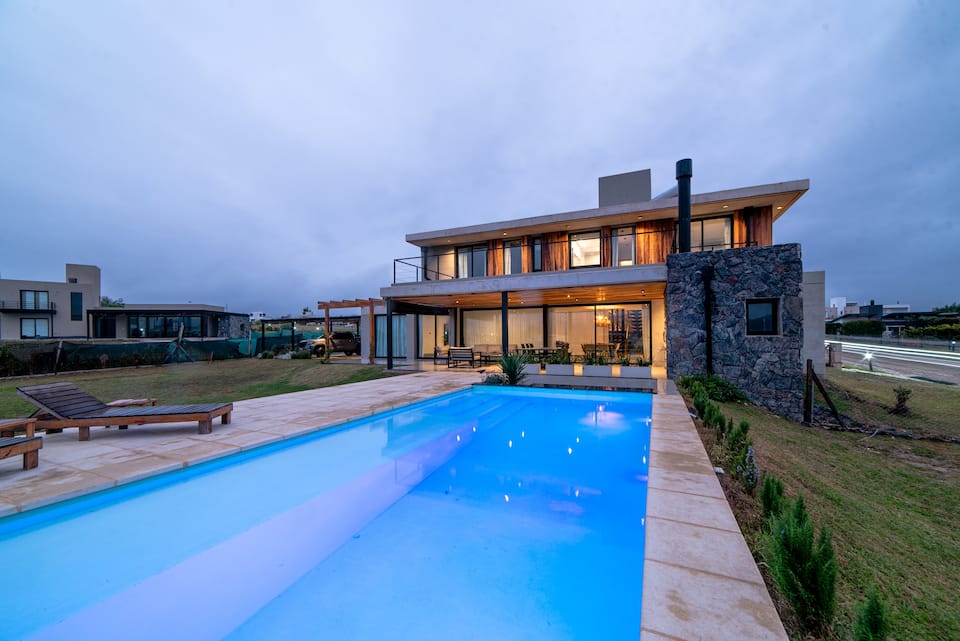


Top-earning Airbnb listings in Comuna de Potrero de Garay - Avg. revenue
- ARS 18,000,000 +6% vs. last year
- Occupancy
- 29%
- Nightly rate
- ARS 235,000
- Active listings
- 59
Where it places among the 31 ranked markets in Córdoba
- Revenue 1st of 31
- Occupancy 12th of 31
- Market size 15th of 31
- Year-round 22nd of 31
- Growth 8th of 13
- How it earns
- Nightly rates set Comuna de Potrero de Garay apart: about ARS 235,000, 83% above the Córdoba average. That adds up to ARS 18,000,000 per listing over the year, the highest of the 31 ranked markets. A typical listing takes in about ARS 1,720,000 a month; the top quarter clear ARS 3,230,000 or more. Revenue per listing rose 6% over the year, helped by nightly rates 7% higher. Its 59 listings make it one of the smaller ranked markets, so its figures are less settled than those of larger ones.
- When it earns
- In Comuna de Potrero de Garay, the months from December to February earn above the yearly average, led by January at about ARS 4,900,000 per listing; June is the low point at about ARS 1,210,000.
- What sells
- Big homes are common: 47% of entire homes have three or more bedrooms, against about 17% in the typical market in Córdoba, and houses make up 63% of supply.
- Who it suits
- Best for buyers who can furnish and price for a premium stay and can ride out a slow June.
Revenue per listing by month
ARS 4,900,000 ARS 1,210,000- Median listing
- ARS 1,720,000/mo
- Top 25% of listings
- ARS 3,230,000+/mo
- Booked ahead
- 28 days
- Average stay
- 4 nights
- Most common home size
- 2 bedrooms
- Superhosts
- 37%
8. La Estancia
Known for: High earnings
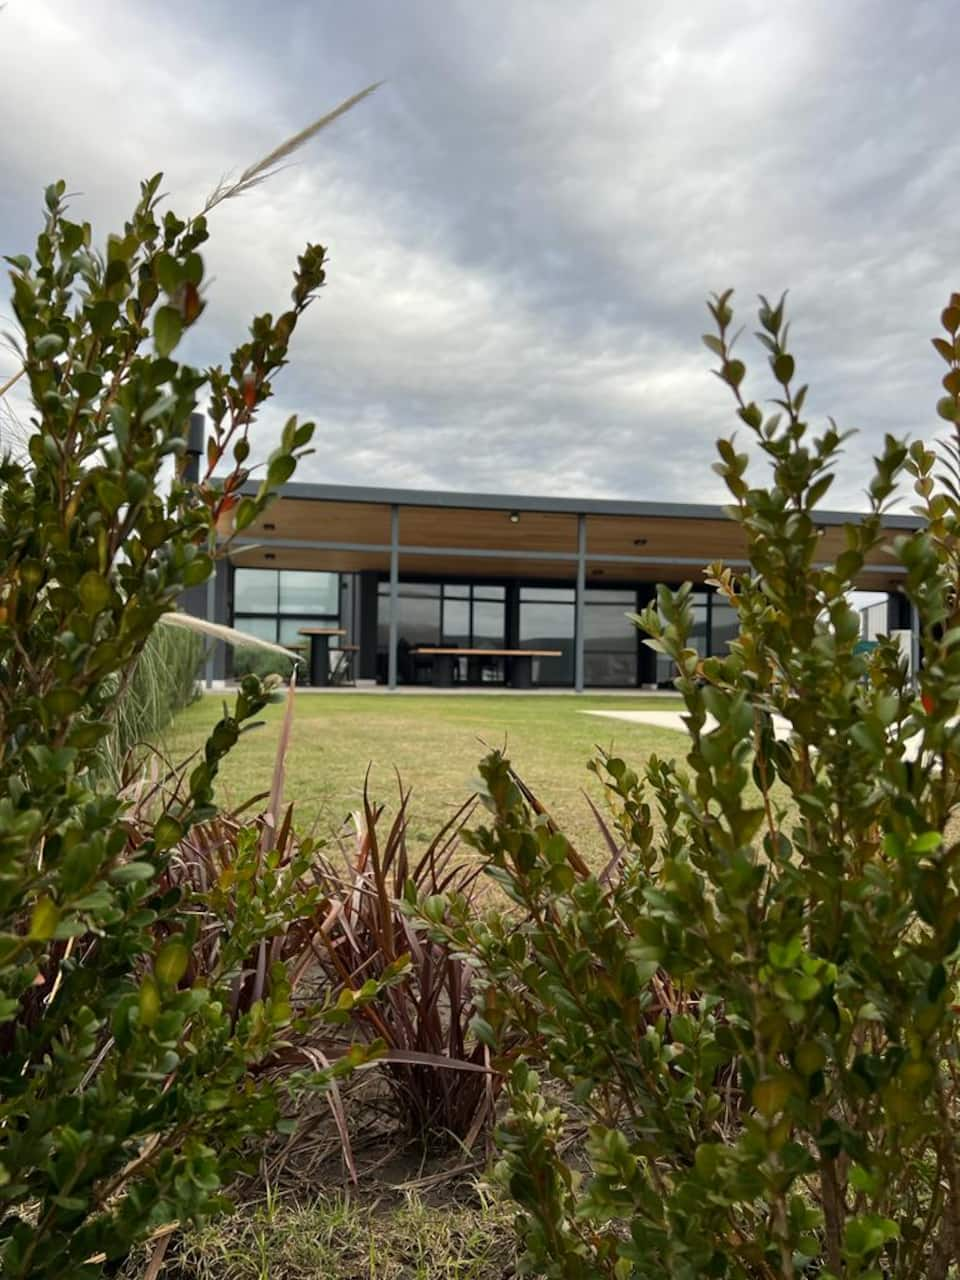

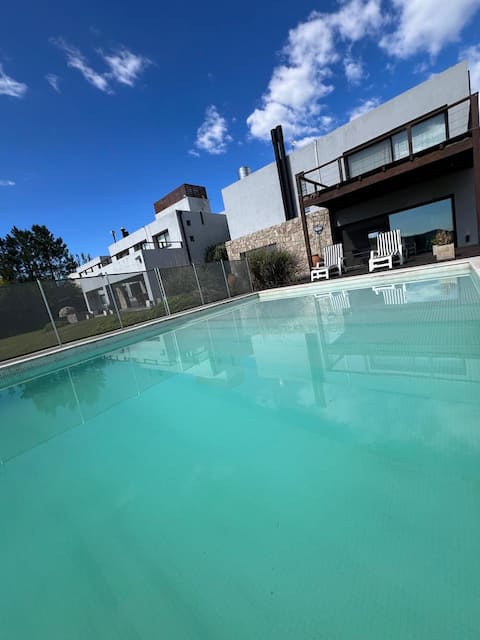
Top-earning Airbnb listings in La Estancia - Avg. revenue
- ARS 14,300,000
- Occupancy
- 29%
- Nightly rate
- ARS 223,000
- Active listings
- 56
Where it places among the 31 ranked markets in Córdoba
- Revenue 4th of 31
- Occupancy 10th of 31
- Market size 16th of 31
- Year-round 25th of 31
- Growth No prior year
- How it earns
- La Estancia earns on price: guests pay about ARS 223,000 a night, 73% above the Córdoba average. Listings averaged ARS 14,300,000 in revenue over the year, the fourth-highest of the 31 ranked markets. The gap between listings is wide: a typical one takes in about ARS 1,390,000 a month, while the top quarter clear ARS 3,010,000 and the top 10% ARS 4,930,000, so pricing and presentation count for more here than in most of Córdoba. With 56 listings it is a small market, so its averages can move more from year to year.
- When it earns
- La Estancia has two seasons, December–February and June–July. January is the strongest month at about ARS 3,940,000 per listing, and May the quietest at about ARS 846,000.
- What sells
- Two-bedroom homes lead the market (35% of entire homes), and houses make up 55% of supply.
- Who books
- Guests are overwhelmingly domestic (92%); the most common home cities are Córdoba, Buenos Aires and Rosario.
- Who it suits
- A good fit for buyers who are prepared for thin bookings around May and can furnish and price for a premium stay.
Revenue per listing by month
ARS 3,940,000 ARS 846,000- Median listing
- ARS 1,390,000/mo
- Top 25% of listings
- ARS 3,010,000+/mo
- Booked ahead
- 23 days
- Average stay
- 5 nights
- Guests from abroad
- 8%
- Most common home size
- 2 bedrooms
9. Capilla del Monte
Known for: Growing revenue
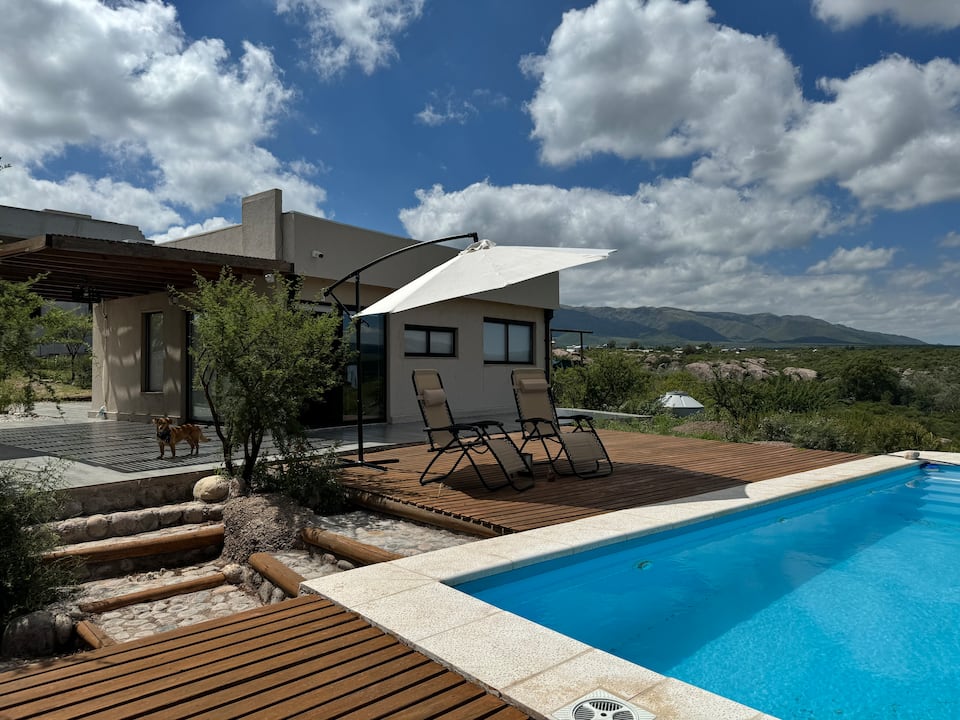


Top-earning Airbnb listings in Capilla del Monte - Avg. revenue
- ARS 5,650,000 +39% vs. last year
- Occupancy
- 29%
- Nightly rate
- ARS 91,200
- Active listings
- 84
Where it places among the 31 ranked markets in Córdoba
- Revenue 20th of 31
- Occupancy 9th of 31
- Market size 6th of 31
- Year-round 11th of 31
- Growth 1st of 13
- How it earns
- Capilla del Monte listings charge about ARS 91,200 a night, 29% below the Córdoba average, and are booked on 29% of nights. Moderate rates keep revenue per listing at ARS 5,650,000, 32% below the Córdoba average. Its place at #9 rests on revenue growth (1st of 13) and market size (6th of 31) rather than on revenue per listing. In a typical month the median listing brings in about ARS 634,000, and the best quarter clear ARS 1,130,000. Revenue per listing rose 39% over the year, the biggest gain in Córdoba, helped by nightly rates 28% higher, even as the number of listings grew 53%. Its 84 listings make it one of the smaller ranked markets, so its figures are less settled than those of larger ones.
- When it earns
- Capilla del Monte's season runs from January to March, peaking in January at about ARS 1,180,000 per listing; November, the quietest month, brings in about ARS 427,000. Most hosts take one- or two-night bookings (88% of listings), more than in the typical market.
- Who books
- More than a third of guests (36%) travel from abroad, most often from the United States and Uruguay.
- What sells
- The most common entire home has 1 bedroom (51% of entire homes), and houses make up 41% of supply.
- Who it suits
- It suits buyers who can carry costs through a quiet November.
Revenue per listing by month
ARS 1,180,000 ARS 427,000- Median listing
- ARS 634,000/mo
- Top 25% of listings
- ARS 1,130,000+/mo
- Booked ahead
- 28 days
- Average stay
- 4 nights
- Guests from abroad
- 36%
- Most common home size
- 1 bedroom
10. Villa Berna
Known for: High earnings
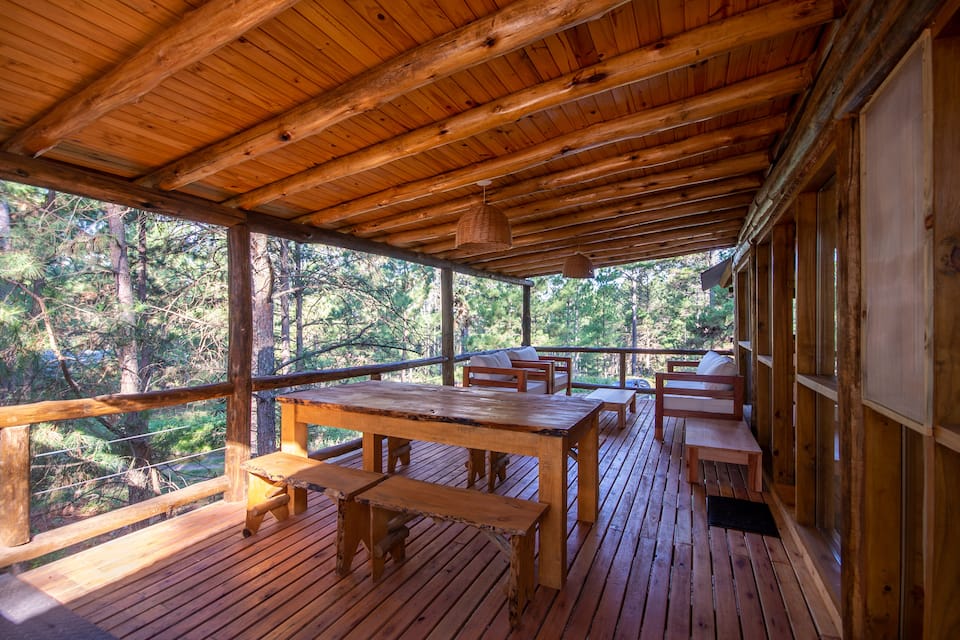


Top-earning Airbnb listings in Villa Berna - Avg. revenue
- ARS 16,300,000
- Occupancy
- 28%
- Nightly rate
- ARS 200,000
- Active listings
- 31
Where it places among the 31 ranked markets in Córdoba
- Revenue 3rd of 31
- Occupancy 14th of 31
- Market size 28th of 31
- Year-round 9th of 31
- Growth No prior year
- How it earns
- Nightly rates set Villa Berna apart: about ARS 200,000, 55% above the Córdoba average. That adds up to ARS 16,300,000 per listing over the year, the third-highest of the 31 ranked markets. Month to month, the median listing earns about ARS 1,350,000 and a top-quarter listing ARS 2,530,000 or more. With 31 listings it is a small market, so its averages can move more from year to year.
- When it earns
- Revenue in Villa Berna concentrates from January to March: January earns about ARS 3,170,000 per listing, about 2.5 times as much as June. Guests book later than in most of Córdoba, about 19 days ahead against roughly 26 for the typical market in Córdoba, so pricing close to the date matters; stays average 4 nights. Most hosts take one- or two-night bookings (87% of listings), more than in the typical market.
- What sells
- One-bedroom homes lead the market (67% of entire homes), and cabins, campers and other outdoor stays make up 58% of supply.
- Who it suits
- Best for buyers who can furnish and price for a premium stay and can ride out a slow June.
Revenue per listing by month
ARS 3,170,000 ARS 1,270,000- Median listing
- ARS 1,350,000/mo
- Top 25% of listings
- ARS 2,530,000+/mo
- Booked ahead
- 19 days
- Average stay
- 4 nights
- Most common home size
- 1 bedroom
- Superhosts
- 32%
Full ranking
How All 31 Ranked Markets in Córdoba Compare
The overall ranking with the five measures behind it. "Slow month" is a market's weakest month of revenue as a share of its best, so a higher figure means steadier income. Select a column heading to re-sort.
| Cordoba Large market, high occupancy | ARS 8,129,813 | 37% | ARS 95,304 | 72% | +21% | 1,542 | |
| Villa Allende High earnings, growing revenue | ARS 17,366,196 | 28% | ARS 256,524 | 49% | +33% | 64 | |
| Villa General Belgrano Large market, high earnings | ARS 11,627,675 | 27% | ARS 174,285 | 42% | +20% | 190 | |
| 4 | Los Reartes High occupancy, high earnings | ARS 10,468,963 | 32% | ARS 162,408 | 44% | – | 50 |
| 5 | Villa Carlos Paz Large market, high earnings | ARS 8,334,036 | 30% | ARS 142,753 | 38% | −9% | 700 |
| 6 | Río Cuarto Year-round demand, growing revenue | ARS 5,715,347 | 31% | ARS 78,517 | 65% | +25% | 72 |
| 7 | Comuna de Potrero de Garay High earnings | ARS 18,049,836 | 29% | ARS 235,305 | 25% | +6% | 59 |
| 8 | La Estancia High earnings | ARS 14,272,435 | 29% | ARS 222,864 | 21% | – | 56 |
| 9 | Capilla del Monte Growing revenue | ARS 5,650,169 | 29% | ARS 91,249 | 36% | +39% | 84 |
| 10 | Villa Berna High earnings | ARS 16,316,113 | 28% | ARS 200,095 | 40% | – | 31 |
| 11 | Alta Gracia Year-round demand, growing revenue | ARS 9,641,932 | 23% | ARS 170,867 | 53% | +25% | 66 |
| 12 | San Javier High earnings | ARS 9,602,826 | 30% | ARS 166,072 | 23% | – | 64 |
| 13 | Nono High earnings | ARS 10,432,753 | 29% | ARS 164,798 | 28% | – | 45 |
| 14 | La Cumbre High earnings | ARS 9,967,820 | 24% | ARS 168,998 | 36% | +5% | 83 |
| 15 | Calamuchita | ARS 8,103,742 | 30% | ARS 149,010 | 27% | – | 40 |
| 16 | Bialet Massé High occupancy | ARS 7,734,403 | 32% | ARS 145,129 | 28% | – | 36 |
| 17 | Santa Rosa de Calamuchita Large market | ARS 5,514,021 | 27% | ARS 129,327 | 44% | – | 95 |
| 18 | Villa María Year-round demand | ARS 4,640,642 | 26% | ARS 88,728 | 60% | +6% | 70 |
| 19 | Villa Parque Siquiman | ARS 7,515,696 | 25% | ARS 181,136 | 23% | – | 67 |
| 20 | Villa Yacanto de Calamuchita | ARS 7,611,289 | 24% | ARS 141,363 | 36% | – | 54 |
| 21 | Punilla | ARS 6,068,754 | 28% | ARS 136,192 | 14% | – | 53 |
| 22 | Mina Clavero | ARS 3,916,447 | 29% | ARS 95,058 | 31% | −6% | 88 |
| 23 | Tanti | ARS 5,332,972 | 28% | ARS 122,157 | 27% | – | 38 |
| 24 | Villa Giardino | ARS 4,934,665 | 24% | ARS 124,764 | 28% | −10% | 71 |
| 25 | San Antonio de Arredondo | ARS 4,520,425 | 30% | ARS 131,007 | 13% | – | 31 |
| 26 | Anisacate | ARS 5,580,647 | 25% | ARS 121,520 | 17% | – | 32 |
| 27 | Villa Rumipal | ARS 5,855,841 | 23% | ARS 125,315 | 8% | – | 33 |
| 28 | Villa Cura Brochero | ARS 3,919,343 | 27% | ARS 99,417 | 27% | – | 30 |
| 29 | Jesús María | ARS 4,563,877 | 20% | ARS 165,450 | 20% | – | 37 |
| 30 | Cosquín | ARS 3,815,059 | 25% | ARS 129,486 | 15% | – | 39 |
| 31 | Municipio de La Falda | ARS 4,093,150 | 21% | ARS 104,501 | 34% | −9% | 30 |
By measure
Córdoba Airbnb Markets Ranked by Revenue, Nightly Rate and Occupancy
The overall ranking balances five measures. These lists take one at a time, for buyers who care most about income, pricing power, bookings, a steady calendar, momentum or market size.
Highest-earning Airbnb markets in Córdoba
Average annual revenue per active listing over the past 12 months. Markets with at least 60 listings.
| # | Market | Revenue |
|---|---|---|
| Villa Allende #2 overall | ARS 17,400,000 | |
| Villa General Belgrano #3 overall | ARS 11,600,000 | |
| La Cumbre #14 overall | ARS 9,970,000 | |
| 4 | Alta Gracia #11 overall | ARS 9,640,000 |
| 5 | San Javier #12 overall | ARS 9,600,000 |
| 6 | Villa Carlos Paz #5 overall | ARS 8,330,000 |
| 7 | Cordoba #1 overall | ARS 8,130,000 |
| 8 | Villa Parque Siquiman #19 overall | ARS 7,520,000 |
| 9 | Río Cuarto #6 overall | ARS 5,720,000 |
| 10 | Capilla del Monte #9 overall | ARS 5,650,000 |
| 11 | Santa Rosa de Calamuchita #17 overall | ARS 5,510,000 |
| 12 | Villa Giardino #24 overall | ARS 4,930,000 |
| 13 | Villa María #18 overall | ARS 4,640,000 |
| 14 | Mina Clavero #22 overall | ARS 3,920,000 |
Most expensive Airbnb markets in Córdoba by nightly rate
Average rate per booked night. A high rate earns most where occupancy holds up too. Markets with at least 60 listings.
| # | Market | Nightly |
|---|---|---|
| Villa Allende #2 overall | ARS 257,000 | |
| Villa Parque Siquiman #19 overall | ARS 181,000 | |
| Villa General Belgrano #3 overall | ARS 174,000 | |
| 4 | Alta Gracia #11 overall | ARS 171,000 |
| 5 | La Cumbre #14 overall | ARS 169,000 |
| 6 | San Javier #12 overall | ARS 166,000 |
| 7 | Villa Carlos Paz #5 overall | ARS 143,000 |
| 8 | Santa Rosa de Calamuchita #17 overall | ARS 129,000 |
| 9 | Villa Giardino #24 overall | ARS 125,000 |
| 10 | Cordoba #1 overall | ARS 95,300 |
| 11 | Mina Clavero #22 overall | ARS 95,100 |
| 12 | Capilla del Monte #9 overall | ARS 91,200 |
| 13 | Villa María #18 overall | ARS 88,700 |
| 14 | Río Cuarto #6 overall | ARS 78,500 |
Highest-occupancy Airbnb markets in Córdoba
Share of available nights booked over the past 12 months. Markets with at least 60 listings.
| # | Market | Occupancy |
|---|---|---|
| Cordoba #1 overall | 37% | |
| Río Cuarto #6 overall | 31% | |
| Villa Carlos Paz #5 overall | 30% | |
| 4 | San Javier #12 overall | 30% |
| 5 | Capilla del Monte #9 overall | 29% |
| 6 | Mina Clavero #22 overall | 29% |
| 7 | Villa Allende #2 overall | 28% |
| 8 | Santa Rosa de Calamuchita #17 overall | 27% |
| 9 | Villa General Belgrano #3 overall | 27% |
| 10 | Villa María #18 overall | 26% |
| 11 | Villa Parque Siquiman #19 overall | 25% |
| 12 | Villa Giardino #24 overall | 24% |
| 13 | La Cumbre #14 overall | 24% |
| 14 | Alta Gracia #11 overall | 23% |
Most year-round Airbnb markets in Córdoba
Revenue in the slowest month as a share of the best month, so a higher figure means steadier income. Markets with at least 60 listings.
| # | Market | Slow month |
|---|---|---|
| Cordoba #1 overall | 72% | |
| Río Cuarto #6 overall | 65% | |
| Villa María #18 overall | 60% | |
| 4 | Alta Gracia #11 overall | 53% |
| 5 | Villa Allende #2 overall | 49% |
| 6 | Santa Rosa de Calamuchita #17 overall | 44% |
| 7 | Villa General Belgrano #3 overall | 42% |
| 8 | Villa Carlos Paz #5 overall | 38% |
| 9 | Capilla del Monte #9 overall | 36% |
| 10 | La Cumbre #14 overall | 36% |
| 11 | Mina Clavero #22 overall | 31% |
| 12 | Villa Giardino #24 overall | 28% |
| 13 | Villa Parque Siquiman #19 overall | 23% |
| 14 | San Javier #12 overall | 23% |
Fastest-growing Airbnb markets in Córdoba
Change in revenue per listing from the year before, among markets where it rose. Markets with at least 60 listings.
| # | Market | Change |
|---|---|---|
| Capilla del Monte #9 overall | +39% | |
| Villa Allende #2 overall | +33% | |
| Alta Gracia #11 overall | +25% | |
| 4 | Río Cuarto #6 overall | +25% |
| 5 | Cordoba #1 overall | +21% |
| 6 | Villa General Belgrano #3 overall | +20% |
| 7 | Villa María #18 overall | +6% |
| 8 | La Cumbre #14 overall | +5% |
Largest Airbnb markets in Córdoba
Active listings. Bigger markets have more comparable rentals to price against and more buyers at resale.
| # | Market | Listings |
|---|---|---|
| Cordoba #1 overall | 1,540 | |
| Villa Carlos Paz #5 overall | 700 | |
| Villa General Belgrano #3 overall | 190 | |
| 4 | Santa Rosa de Calamuchita #17 overall | 95 |
| 5 | Mina Clavero #22 overall | 88 |
| 6 | Capilla del Monte #9 overall | 84 |
| 7 | La Cumbre #14 overall | 83 |
| 8 | Río Cuarto #6 overall | 72 |
| 9 | Villa Giardino #24 overall | 71 |
| 10 | Villa María #18 overall | 70 |
| 11 | Villa Parque Siquiman #19 overall | 67 |
| 12 | Alta Gracia #11 overall | 66 |
| 13 | Villa Allende #2 overall | 64 |
| 14 | San Javier #12 overall | 64 |
| 15 | Comuna de Potrero de Garay #7 overall | 59 |
| 16 | La Estancia #8 overall | 56 |
| 17 | Villa Yacanto de Calamuchita #20 overall | 54 |
| 18 | Punilla #21 overall | 53 |
| 19 | Los Reartes #4 overall | 50 |
| 20 | Nono #13 overall | 45 |
| 21 | Calamuchita #15 overall | 40 |
| 22 | Cosquín #30 overall | 39 |
| 23 | Tanti #23 overall | 38 |
| 24 | Jesús María #29 overall | 37 |
| 25 | Bialet Massé #16 overall | 36 |
Seasonality
When Airbnbs in Córdoba Earn the Most
January is the best month for nearly nine in ten ranked markets in Córdoba.
January earns about twice what June does
Average revenue per listing across the 31 ranked markets in Córdoba, by month
| Month | Avg. revenue per listing | Best month for | Highest-ranked examples |
|---|---|---|---|
| January | ARS 1,860,000 | 27 markets | Villa General Belgrano, Los Reartes, Villa Carlos Paz |
| February | ARS 1,500,000 | 1 market | Santa Rosa de Calamuchita |
| March | ARS 1,160,000 | – | – |
| April | ARS 995,000 | – | – |
| May | ARS 958,000 | – | – |
| June | ARS 946,000 | 1 market | Río Cuarto |
| July | ARS 1,410,000 | 1 market | Cordoba |
| August | ARS 1,000,000 | – | – |
| September | ARS 1,060,000 | – | – |
| October | ARS 968,000 | – | – |
| November | ARS 960,000 | – | – |
| December | ARS 1,230,000 | 1 market | Villa Allende |
Average revenue is per listing across the ranked markets, the line in the chart above. "Best month for" counts the ranked markets whose own revenue peaks in that month.
Method
How the Ranking Works
The ranking covers the 31 markets in Córdoba with at least 30 active Airbnb listings and data through October 2026. Each market is compared with the others on five measures, and markets are ordered by a weighted blend of where they place on each:
- Revenue per listing (35%): average revenue an active listing earned over the past 12 months.
- Occupancy (20%): share of available nights that were booked.
- Market size (20%): active listings. Bigger markets offer more comparable rentals to price against and more buyers when you sell.
- Year-round demand (15%): revenue in the slowest month as a share of the best month. The latest month is left out when its bookings look incomplete.
- Growth (10%): change in revenue per listing from the year before. Markets whose boundaries changed between years are scored in the middle.
Left out: 11 markets whose data predate the latest refresh. The score measures how rentals perform. It does not include purchase prices, financing, operating costs or local short-term rental rules, which vary by address and should be checked before buying. Figures are in Argentine pesos and match each market's own report; see the data methodology for how listings are tracked.
To check one property before buying, run its address and size through the Airbnb income calculator for a revenue, occupancy and nightly-rate range from comparable listings.
FAQ
Frequently Asked Questions About Airbnb Investing in Córdoba
What is the best place to buy an Airbnb in Córdoba?
Cordoba ranks first of the 31 markets in Córdoba in AirROI's ranking, with ARS 8,130,000 in average revenue per listing and 37% occupancy. Villa Allende and Villa General Belgrano follow. The ranking weighs revenue, occupancy, market size, seasonality and growth; it leaves out purchase prices.
What are the most profitable Airbnb locations in Córdoba?
By revenue per listing, among markets with at least 60 listings, Villa Allende leads at ARS 17,400,000 a year, ahead of Villa General Belgrano at ARS 11,600,000. Profit also depends on what a property costs to buy and run, which varies far more between markets than revenue does.
How much does an Airbnb make in Córdoba?
The average active listing in Córdoba earned ARS 8,290,000 over the 12 months to October 2026, at 31% occupancy. Across the ranked markets, the middle half averaged between ARS 4,930,000 and ARS 9,640,000 per listing. Averages include listings that operated for only part of the year, so a listing rented all year typically earns more.
What is a good Airbnb occupancy rate in Córdoba?
The average listing in Córdoba was booked on 31% of available nights over the past 12 months. Half of the ranked markets fall between 25% and 29%, so a market above about 29% sits in the top quarter. Occupancy is only half the picture: a market with lower occupancy can still earn more if its nightly rates are higher.
Where is Airbnb demand highest in Córdoba?
Among ranked markets with at least 60 listings, Cordoba has the highest occupancy, with 37% of available nights booked, followed by Río Cuarto at 31%. Its listings average about ARS 95,300 a night and ARS 8,130,000 a year.
Where are Airbnb nightly rates highest in Córdoba?
Among ranked markets with at least 60 listings, Villa Allende has the highest average nightly rate, about ARS 257,000, followed by Villa Parque Siquiman at ARS 181,000. Río Cuarto is the least expensive, at about ARS 78,500. The average booked night in Córdoba costs about ARS 129,000.
What is the best month for Airbnb in Córdoba?
January is the highest-earning month for 27 of the 31 ranked markets, followed by July (1). June is the most common slowest month, in 9 of the 31 markets. Each market's report shows its own month-by-month revenue, occupancy and rates.
Which Airbnb markets in Córdoba earn the most evenly through the year?
Among ranked markets with at least 60 listings, Cordoba has the steadiest income: its slowest month, November, still earns about three-quarters of its best. Río Cuarto follows, at 65%. Steadier markets are easier to budget for, though they do not always earn the most per listing.
Which Airbnb markets are growing fastest in Córdoba?
Among ranked markets with at least 60 listings, revenue per listing grew most in Capilla del Monte, up 39% on the year before, and in Villa Allende, up 33%. A single strong year can reflect events or new supply, so it is worth checking a market's monthly trend before relying on it.
Is Airbnb still profitable in Córdoba in 2026?
Revenue per listing grew in 9 of the 13 ranked markets with a comparable year of data; in the typical market it rose 6%. Whether a given property profits depends on its purchase price, financing and running costs.
What are the best smaller Airbnb markets in Córdoba?
Among ranked markets with fewer than 50 active listings, Villa Berna (#10 overall, ARS 16,300,000 per listing), Nono (#13, ARS 10,400,000) and Calamuchita (#15, ARS 8,100,000) place highest. Smaller markets have fewer comparable rentals to price against, so their averages can move more from year to year.
How many Airbnb listings are there in Córdoba?
AirROI tracked 4,360 active Airbnb listings in Córdoba over the 12 months to October 2026, across 51 markets. The largest ranked market is Cordoba, with 1,540 listings, followed by Villa Carlos Paz with 700.
Directory
All 51 Airbnb Markets in Córdoba
Every Córdoba city with an AirROI Airbnb market report, A–Z, with its active listing count.
A
- Agua de Oro 18 listings
- Alta Gracia 66 listings
- Anisacate 32 listings
B
- Bialet Massé 36 listings
C
- Calamuchita 40 listings
- Capilla del Monte 84 listings
- Comuna de Los Reartes 19 listings
- Comuna de Potrero de Garay 59 listings
- Comuna Estancia Vieja 21 listings
- Cordoba 1,542 listings
- Cosquín 39 listings
- Cuesta Blanca 25 listings
E
- Embalse 26 listings
H
- Huerta Grande 22 listings
J
- Jesús María 37 listings
L
- La Calera 17 listings
- La Cumbre 83 listings
- La Cumbrecita 25 listings
- La Estancia 56 listings
- Los Hornillos 18 listings
- Los Reartes 50 listings
M
- Mendiolaza 22 listings
- Mina Clavero 88 listings
- Municipio de La Cumbre 18 listings
- Municipio de La Falda 30 listings
- Municipio de La Granja 19 listings
- Municipio de Villa Yacanto 19 listings
N
- Nono 45 listings
P
- Potrero de Garay 28 listings
- Punilla 53 listings
R
- Río Ceballos 21 listings
- Río Cuarto 72 listings
S
- Salsipuedes 17 listings
- San Antonio de Arredondo 31 listings
- San Javier 64 listings
- San Marcos Sierra 16 listings
- Santa Rosa de Calamuchita 95 listings
T
- Tanti 38 listings
V
- Valle Hermoso 22 listings
- Villa Allende 64 listings
- Villa Berna 31 listings
- Villa Carlos Paz 700 listings
- Villa Cura Brochero 30 listings
- Villa General Belgrano 190 listings
- Villa Giardino 71 listings
- Villa Las Rosas 18 listings
- Villa María 70 listings
- Villa Parque Siquiman 67 listings
- Villa Rumipal 33 listings
- Villa Yacanto 23 listings
- Villa Yacanto de Calamuchita 54 listings