Municipio de La Granja Airbnb Market Analysis 2026: Short Term Rental Data & Vacation Rental Statistics in Córdoba, Argentina
Is Airbnb profitable in Municipio de La Granja in 2026? Explore comprehensive Airbnb analytics for Municipio de La Granja, Córdoba, Argentina to uncover income potential. This 2026 STR market report for Municipio de La Granja, based on AirROI data from December 2024 to November 2025, reveals key trends in the niche market of 19 active listings.
Whether you're considering an Airbnb investment in Municipio de La Granja, optimizing your existing vacation rental, or exploring rental arbitrage opportunities, understanding the Municipio de La Granja Airbnb data is crucial. Leveraging the low regulation environment is key to maximizing your short term rental income potential. Let's dive into the specifics.
Key Municipio de La Granja Airbnb Performance Metrics Overview
Monthly Airbnb Revenue Variations & Income Potential in Municipio de La Granja (2026)
Understanding the monthly revenue variations for Airbnb listings in Municipio de La Granja is key to maximizing your short term rental income potential. Seasonality significantly impacts earnings. Our analysis, based on data from the past 12 months, shows that the peak revenue month for STRs in Municipio de La Granja is typically January, while April often presents the lowest earnings, highlighting opportunities for strategic pricing adjustments during shoulder and low seasons. Explore the typical Airbnb income in Municipio de La Granja across different performance tiers:
- Best-in-class properties (Top 10%) achieve $1,788+ monthly, often utilizing dynamic pricing and superior guest experiences.
- Strong performing properties (Top 25%) earn $1,143 or more, indicating effective management and desirable locations/amenities.
- Typical properties (Median) generate around $578 per month, representing the average market performance.
- Entry-level properties (Bottom 25%) see earnings around $325, often with potential for optimization.
Average Monthly Airbnb Earnings Trend in Municipio de La Granja
Municipio de La Granja Airbnb Occupancy Rate Trends (2026)
Maximize your bookings by understanding the Municipio de La Granja STR occupancy trends. Seasonal demand shifts significantly influence how often properties are booked. Typically, Januarysees the highest demand (peak season occupancy), while June experiences the lowest (low season). Effective strategies, like adjusting minimum stays or offering promotions, can boost occupancy during slower periods. Here's how different property tiers perform in Municipio de La Granja:
- Best-in-class properties (Top 10%) achieve 40%+ occupancy, indicating high desirability and potentially optimized availability.
- Strong performing properties (Top 25%) maintain 29% or higher occupancy, suggesting good market fit and guest satisfaction.
- Typical properties (Median) have an occupancy rate around 18%.
- Entry-level properties (Bottom 25%) average 9% occupancy, potentially facing higher vacancy.
Average Monthly Occupancy Rate Trend in Municipio de La Granja
Average Daily Rate (ADR) Airbnb Trends in Municipio de La Granja (2026)
Effective short term rental pricing strategy in Municipio de La Granja involves understanding monthly ADR fluctuations. The Average Daily Rate (ADR) for Airbnb in Municipio de La Granja typically peaks in July and dips lowest during December. Leveraging Airbnb dynamic pricing tools or strategies based on this seasonality can significantly boost revenue. Here's a look at the typical nightly rates achieved:
- Best-in-class properties (Top 10%) command rates of $193+ per night, often due to premium features or locations.
- Strong performing properties (Top 25%) achieve nightly rates of $109 or more.
- Typical properties (Median) charge around $82 per night.
- Entry-level properties (Bottom 25%) earn around $63 per night.
Average Daily Rate (ADR) Trend by Month in Municipio de La Granja
Get Live Municipio de La Granja Market Intelligence 👇

Explore Real-time Analytics
Airbnb Seasonality Analysis & Trends in Municipio de La Granja (2025)
Peak Season (January, February, March)
- Revenue averages $1,326 per month
- Occupancy rates average 38.3%
- Daily rates average $105
Shoulder Season
- Revenue averages $801 per month
- Occupancy maintains around 17.4%
- Daily rates hold near $103
Low Season (April, June, August)
- Revenue drops to average $382 per month
- Occupancy decreases to average 10.3%
- Daily rates adjust to average $102
Seasonality Insights for Municipio de La Granja
- The Airbnb seasonality in Municipio de La Granja shows highly seasonal trends requiring careful strategy. While the sections above show seasonal averages, it's also insightful to look at the extremes:
- During the high season, the absolute peak month showcases Municipio de La Granja's highest earning potential, with monthly revenues capable of climbing to $1,514, occupancy reaching a high of 44.8%, and ADRs peaking at $108.
- Conversely, the slowest single month of the year, typically falling within the low season, marks the market's lowest point. In this month, revenue might dip to $301, occupancy could drop to 7.6%, and ADRs may adjust down to $100.
- Understanding both the seasonal averages and these monthly peaks and troughs in revenue, occupancy, and ADR is crucial for maximizing your Airbnb profit potential in Municipio de La Granja.
Seasonal Strategies for Maximizing Profit
- Peak Season: Maximize revenue through premium pricing and potentially longer minimum stays. Ensure high availability.
- Low Season: Offer competitive pricing, special promotions (e.g., extended stay discounts), and flexible cancellation policies. Target off-season travelers like remote workers or budget-conscious guests.
- Shoulder Seasons: Implement dynamic pricing that balances peak and low rates. Target weekend travelers or specific events. Offer slightly more flexible terms than peak season.
- Regularly analyze your own performance against these Municipio de La Granja seasonality benchmarks and adjust your pricing and availability strategy accordingly.
Best Areas for Airbnb Investment in Municipio de La Granja (2026)
Exploring the top neighborhoods for short-term rentals in Municipio de La Granja? This section highlights key areas, outlining why they are attractive for hosts and guests, along with notable local attractions. Consider these locations based on your target guest profile and investment strategy.
| Neighborhood / Area | Why Host Here? (Target Guests & Appeal) | Key Attractions & Landmarks |
|---|---|---|
| La Granja Centro | The heart of La Granja with easy access to local shops, restaurants, and parks. Ideal for travelers wanting to experience the local culture and community atmosphere. | Plaza de La Granja, Local eateries, Cultural centers, Nearby parks, Craft fairs |
| La Granja Natural Park | A serene area ideal for nature lovers and outdoor enthusiasts, perfect for those seeking a quiet retreat. Visitors can enjoy hiking, picnicking, and bird watching. | La Granja Natural Park, Hiking trails, Scenic viewpoints, Picnic areas, Wildlife spotting |
| Córdoba Capital | Close proximity to the capital city of Córdoba means easy access to a larger urban experience, with abundant attractions, nightlife, and cultural events. | Historic city center, Museums, Cathedral of Córdoba, Cultural events, Varied nightlife |
| Villa Allende | Nearby suburb known for its residential charm and family-friendly atmosphere. Good for guests wanting a quieter stay while still close to city amenities. | Local shops, Cafes, Community events, Green spaces, Family-friendly parks |
| Río Ceballos | A beautiful nearby town known for its natural landscapes and rivers, great for eco-tourism and outdoor activities. | Río Ceballos River, Nature trails, Outdoor sports, Picnic spots, Natural swimming pools |
| Salsipuedes | Famous for its stunning landscapes and river settings. Great for adventure seekers looking to enjoy activities like rafting and hiking. | Salsipuedes River, Adventure sports, Scenic trails, Nature excursions, Wildlife |
| Alta Gracia | Known for its historical sites and cultural richness, it attracts tourists interested in history and architecture. | Museo del Che, Alta Gracia Castle, Cultural festivals, Local markets, Historic buildings |
| Los Cocos | A tranquil mountain village perfect for hiking and relaxation, drawing those looking for a retreat in nature's embrace. | Mountain trails, Peaceful environments, Local crafts, Viewpoints, Nature retreats |
Understanding Airbnb License Requirements & STR Laws in Municipio de La Granja (2026)
While Municipio de La Granja, Córdoba, Argentina currently shows low STR regulations, specific Airbnb license requirements might still exist or change. Always verify the latest short term rental regulations and Airbnb license requirements directly with local government authorities for Municipio de La Granja to ensure full compliance before hosting.
(Source: AirROI data, 2026, finding no licensed listings among those analyzed)
Top Performing Airbnb Properties in Municipio de La Granja (2026)
Benchmark your potential! Explore examples of top-performing Airbnb properties in Municipio de La Granjabased on Trailing Twelve Month (TTM) revenue. Analyze their characteristics, revenue, occupancy rate, and ADR to understand what drives success in this market.

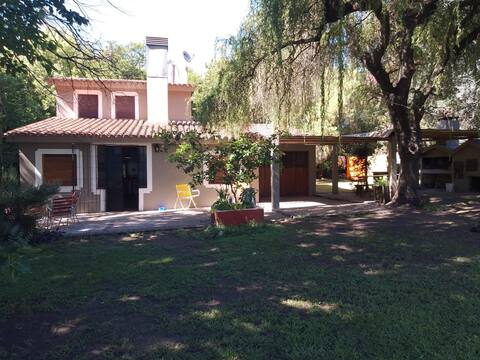
Armonía: Ideal for family/friend groups, basketball court
Entire Place • 3 bedrooms

La Deseada - Country House, Ascochinga.
Entire Place • 3 bedrooms
Villa Cris
Entire Place • 3 bedrooms
Dacha en alquiler
Entire Place • 2 bedrooms

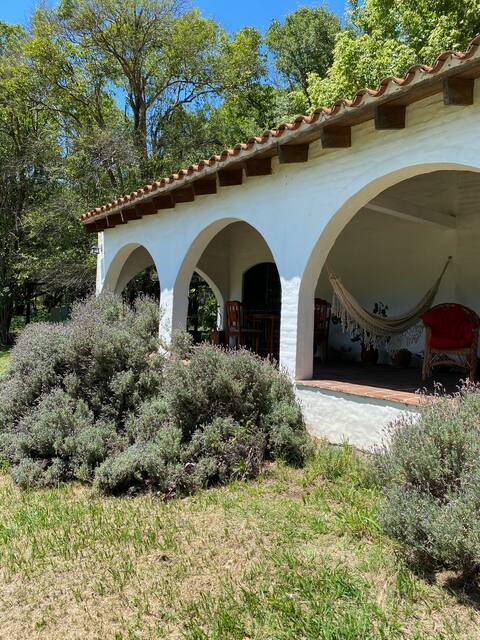
Beautiful Country House - Villa Ani Mi - La Granja
Entire Place • 3 bedrooms
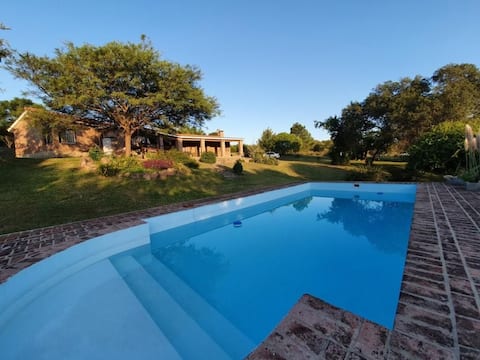
Exclusive house with a park and pool in S. Chicas
Entire Place • 2 bedrooms
Note: Performance varies based on location, size, amenities, seasonality, and management quality. Data reflects the past 12 months.
Top Performing Airbnb Hosts in Municipio de La Granja (2026)
Learn from the best! This table showcases top-performing Airbnb hosts in Municipio de La Granja based on the number of properties managed and estimated total revenue over the past year. Analyze their scale and performance metrics.
| Host Name | Properties | Grossing Revenue | Stay Reviews | Avg Rating |
|---|---|---|---|---|
| María Inés | 1 | $17,723 | 16 | 4.75/5.0 |
| Maria | 1 | $12,358 | 54 | 4.78/5.0 |
| Sole | 1 | $7,270 | 12 | 5.00/5.0 |
| Host #60116368 | 1 | $6,963 | 3 | 4.33/5.0 |
| María Beatriz | 1 | $4,886 | 8 | 5.00/5.0 |
| Daniel Luis | 1 | $4,686 | 6 | 4.67/5.0 |
| Jose | 1 | $3,693 | 3 | 5.00/5.0 |
| Nico | 1 | $3,243 | 40 | 5.00/5.0 |
| Andrés Marcelo | 1 | $3,095 | 1 | Not Rated |
| Amanda Bibiana | 1 | $2,840 | 5 | 5.00/5.0 |
Analyzing the strategies of top hosts, such as their property selection, pricing, and guest communication, can offer valuable lessons for optimizing your own Airbnb operations in Municipio de La Granja.
Dive Deeper: Advanced Municipio de La Granja STR Market Data (2026)
Ready to unlock more insights? AirROI provides access to advanced metrics and comprehensive Airbnb data for Municipio de La Granja. Explore detailed analytics beyond this report to refine your investment strategy, optimize pricing, and maximize your vacation rental profits.
Explore Advanced MetricsMunicipio de La Granja Short-Term Rental Market Composition (2026): Property & Room Types
Room Type Distribution
Property Type Distribution
Market Composition Insights for Municipio de La Granja
- The Municipio de La Granja Airbnb market composition is heavily skewed towards Entire Home/Apt listings, which make up 94.7% of the 19 active rentals. This indicates strong guest preference for privacy and space.
- Looking at the property type distribution in Municipio de La Granja, House properties are the most common (78.9%), reflecting the local real estate landscape.
- Houses represent a significant 78.9% portion, catering likely to families or larger groups.
Municipio de La Granja Airbnb Room Capacity Analysis (2026): Bedroom Distribution
Distribution of Listings by Number of Bedrooms
Room Capacity Insights for Municipio de La Granja
- The dominant room capacity in Municipio de La Granja is 2 bedrooms listings, making up 42.1% of the market. This suggests a strong demand for properties suitable for couples or solo travelers.
- Together, 2 bedrooms and 3 bedrooms properties represent 73.7% of the active Airbnb listings in Municipio de La Granja, indicating a high concentration in these sizes.
- A significant 42.2% of listings offer 3+ bedrooms, catering to larger groups and families seeking more space in Municipio de La Granja.
Municipio de La Granja Vacation Rental Guest Capacity Trends (2026)
Distribution of Listings by Guest Capacity
Guest Capacity Insights for Municipio de La Granja
- The most common guest capacity trend in Municipio de La Granja vacation rentals is listings accommodating 8+ guests (36.8%). This suggests the primary traveler segment is likely larger groups.
- Properties designed for 8+ guests and 4 guests dominate the Municipio de La Granja STR market, accounting for 63.1% of listings.
- 47.4% of properties accommodate 6+ guests, serving the market segment for larger families or group travel in Municipio de La Granja.
- On average, properties in Municipio de La Granja are equipped to host 5.8 guests.
Municipio de La Granja Airbnb Booking Patterns (2026): Available vs. Booked Days
Available Days Distribution
Booked Days Distribution
Booking Pattern Insights for Municipio de La Granja
- The most common availability pattern in Municipio de La Granja falls within the 271-366 days range, representing 94.7% of listings. This suggests many properties have significant open periods on their calendars.
- Approximately 100.0% of listings show high availability (181+ days open annually), indicating potential for increased bookings or specific owner usage patterns.
- For booked days, the 1-30 days range is most frequent in Municipio de La Granja (52.6%), reflecting common guest stay durations or potential owner blocking patterns.
Municipio de La Granja Airbnb Minimum Stay Requirements Analysis
Distribution of Listings by Minimum Night Requirement
1 Night
4 listings
21.1% of total
2 Nights
7 listings
36.8% of total
3 Nights
3 listings
15.8% of total
4-6 Nights
2 listings
10.5% of total
30+ Nights
3 listings
15.8% of total
Key Insights
- The most prevalent minimum stay requirement in Municipio de La Granja is 2 Nights, adopted by 36.8% of listings. This highlights the market's preference for shorter, flexible bookings.
- A significant segment (15.8%) caters to monthly stays (30+ nights) in Municipio de La Granja, pointing to opportunities in the extended-stay market.
Recommendations
- Align with the market by considering a 2 Nights minimum stay, as 36.8% of Municipio de La Granja hosts use this setting.
- If feasible, allowing 1-night stays, especially midweek or during low season, could capture last-minute bookings, as only 21.1% currently do.
- Explore offering discounts for stays of 30+ nights to attract the 15.8% of the market seeking extended stays.
- Adjust minimum nights based on seasonality – potentially shorter during low season and longer during peak demand periods in Municipio de La Granja.
Municipio de La Granja Airbnb Cancellation Policy Trends Analysis (2026)
Limited
1 listings
5.6% of total
Flexible
5 listings
27.8% of total
Moderate
4 listings
22.2% of total
Firm
8 listings
44.4% of total
Cancellation Policy Insights for Municipio de La Granja
- The prevailing Airbnb cancellation policy trend in Municipio de La Granja is Firm, used by 44.4% of listings.
- There's a relatively balanced mix between guest-friendly (50.0%) and stricter (44.4%) policies, offering choices for different guest needs.
Recommendations for Hosts
- Consider adopting a Firm policy to align with the 44.4% market standard in Municipio de La Granja.
- Regularly review your cancellation policy against competitors and market demand shifts in Municipio de La Granja.
Municipio de La Granja STR Booking Lead Time Analysis (2026)
Average Booking Lead Time by Month
Booking Lead Time Insights for Municipio de La Granja
- The overall average booking lead time for vacation rentals in Municipio de La Granja is 27 days.
- Guests book furthest in advance for stays during May (average 56 days), likely coinciding with peak travel demand or local events.
- The shortest booking windows occur for stays in July (average 13 days), indicating more last-minute travel plans during this time.
- Seasonally, Spring (45 days avg.) sees the longest lead times, while Summer (15 days avg.) has the shortest, reflecting typical travel planning cycles.
Recommendations for Hosts
- Use the overall average lead time (27 days) as a baseline for your pricing and availability strategy in Municipio de La Granja.
- For May stays, consider implementing length-of-stay discounts or slightly higher rates for bookings made less than 56 days out to capitalize on advance planning.
- During July, focus on last-minute booking availability and promotions, as guests book with very short notice (13 days avg.).
- Target marketing efforts for the Spring season well in advance (at least 45 days) to capture early planners.
- Monitor your own booking lead times against these Municipio de La Granja averages to identify opportunities for dynamic pricing adjustments.
Popular & Essential Airbnb Amenities in Municipio de La Granja (2026)
Amenity Prevalence
Amenity Insights for Municipio de La Granja
- Essential amenities in Municipio de La Granja that guests expect include: Free parking on premises, Pool. Lacking these (any) could significantly impact bookings.
- Popular amenities like Kitchen, BBQ grill, Dishes and silverware are common but not universal. Offering these can provide a competitive edge.
Recommendations for Hosts
- Ensure your listing includes all essential amenities for Municipio de La Granja: Free parking on premises, Pool.
- Consider adding popular differentiators like Kitchen or BBQ grill to increase appeal.
- Highlight unique or less common amenities you offer (e.g., hot tub, dedicated workspace, EV charger) in your listing description and photos.
- Regularly check competitor amenities in Municipio de La Granja to stay competitive.
Municipio de La Granja Airbnb Guest Demographics & Profile Analysis (2026)
Guest Profile Summary for Municipio de La Granja
- The typical guest profile for Airbnb in Municipio de La Granja consists of primarily domestic travelers (69%), often arriving from nearby Córdoba, typically belonging to the Post-2000s (Gen Z/Alpha) group (50%), primarily speaking Spanish or English.
- Domestic travelers account for 69.2% of guests.
- Key international markets include Argentina (69.2%) and United States (15.4%).
- Top languages spoken are Spanish (57.1%) followed by English (28.6%).
- A significant demographic segment is the Post-2000s (Gen Z/Alpha) group, representing 50% of guests.
Recommendations for Hosts
- Target domestic marketing efforts towards travelers from Córdoba and Miami.
- Tailor amenities and listing descriptions to appeal to the dominant Post-2000s (Gen Z/Alpha) demographic (e.g., highlight fast WiFi, smart home features, local guides).
- Highlight unique local experiences or amenities relevant to the primary guest profile.
- Consider seasonal promotions aligned with peak travel times for key origin markets.
Nearby Short-Term Rental Market Comparison
How does the Municipio de La Granja Airbnb market stack up against its neighbors? Compare key performance metrics like average monthly revenue, ADR, and occupancy rates in surrounding areas to understand the broader regional STR landscape.
| Market | Active Properties | Monthly Revenue | Daily Rate | Avg. Occupancy |
|---|---|---|---|---|
| Villa Berna | 25 | $1,155 | $140.18 | 29% |
| Mendiolaza | 12 | $1,090 | $139.09 | 33% |
| Comuna de Potrero de Garay | 66 | $1,062 | $165.61 | 30% |
| Municipio de Villa Yacanto | 15 | $977 | $134.50 | 28% |
| Comuna de Los Reartes | 17 | $957 | $119.93 | 33% |
| La Calera | 15 | $951 | $156.42 | 35% |
| Municipio de La Cumbre | 15 | $832 | $169.52 | 28% |
| Villa Allende | 51 | $799 | $160.92 | 30% |
| La Cumbrecita | 14 | $765 | $166.54 | 22% |
| Villa Ciudad Parque Los Reartes | 10 | $741 | $88.63 | 30% |