Municipio de Garupá Airbnb Market Analysis 2026: Short Term Rental Data & Vacation Rental Statistics in Misiones, Argentina
Is Airbnb profitable in Municipio de Garupá in 2026? Explore comprehensive Airbnb analytics for Municipio de Garupá, Misiones, Argentina to uncover income potential. This 2026 STR market report for Municipio de Garupá, based on AirROI data from May 2024 to April 2025, reveals key trends in the niche market of 21 active listings.
Whether you're considering an Airbnb investment in Municipio de Garupá, optimizing your existing vacation rental, or exploring rental arbitrage opportunities, understanding the Municipio de Garupá Airbnb data is crucial. Leveraging the low regulation environment is key to maximizing your short term rental income potential. Let's dive into the specifics.
Key Municipio de Garupá Airbnb Performance Metrics Overview
Monthly Airbnb Revenue Variations & Income Potential in Municipio de Garupá (2026)
Understanding the monthly revenue variations for Airbnb listings in Municipio de Garupá is key to maximizing your short term rental income potential. Seasonality significantly impacts earnings. Our analysis, based on data from the past 12 months, shows that the peak revenue month for STRs in Municipio de Garupá is typically September, while December often presents the lowest earnings, highlighting opportunities for strategic pricing adjustments during shoulder and low seasons. Explore the typical Airbnb income in Municipio de Garupá across different performance tiers:
- Best-in-class properties (Top 10%) achieve $2,463+ monthly, often utilizing dynamic pricing and superior guest experiences.
- Strong performing properties (Top 25%) earn $1,494 or more, indicating effective management and desirable locations/amenities.
- Typical properties (Median) generate around $593 per month, representing the average market performance.
- Entry-level properties (Bottom 25%) see earnings around $434, often with potential for optimization.
Average Monthly Airbnb Earnings Trend in Municipio de Garupá
Municipio de Garupá Airbnb Occupancy Rate Trends (2026)
Maximize your bookings by understanding the Municipio de Garupá STR occupancy trends. Seasonal demand shifts significantly influence how often properties are booked. Typically, Aprilsees the highest demand (peak season occupancy), while August experiences the lowest (low season). Effective strategies, like adjusting minimum stays or offering promotions, can boost occupancy during slower periods. Here's how different property tiers perform in Municipio de Garupá:
- Best-in-class properties (Top 10%) achieve 34%+ occupancy, indicating high desirability and potentially optimized availability.
- Strong performing properties (Top 25%) maintain 32% or higher occupancy, suggesting good market fit and guest satisfaction.
- Typical properties (Median) have an occupancy rate around 14%.
- Entry-level properties (Bottom 25%) average 8% occupancy, potentially facing higher vacancy.
Average Monthly Occupancy Rate Trend in Municipio de Garupá
Average Daily Rate (ADR) Airbnb Trends in Municipio de Garupá (2026)
Effective short term rental pricing strategy in Municipio de Garupá involves understanding monthly ADR fluctuations. The Average Daily Rate (ADR) for Airbnb in Municipio de Garupá typically peaks in July and dips lowest during December. Leveraging Airbnb dynamic pricing tools or strategies based on this seasonality can significantly boost revenue. Here's a look at the typical nightly rates achieved:
- Best-in-class properties (Top 10%) command rates of $100+ per night, often due to premium features or locations.
- Strong performing properties (Top 25%) achieve nightly rates of $57 or more.
- Typical properties (Median) charge around $18 per night.
- Entry-level properties (Bottom 25%) earn around $15 per night.
Average Daily Rate (ADR) Trend by Month in Municipio de Garupá
Get Live Municipio de Garupá Market Intelligence 👇

Explore Real-time Analytics
Airbnb Seasonality Analysis & Trends in Municipio de Garupá (2025)
Peak Season (September, August, November)
- Revenue averages $1,451 per month
- Occupancy rates average 15.1%
- Daily rates average $47
Shoulder Season
- Revenue averages $1,110 per month
- Occupancy maintains around 22.8%
- Daily rates hold near $38
Low Season (July, October, December)
- Revenue drops to average $520 per month
- Occupancy decreases to average 10.8%
- Daily rates adjust to average $42
Seasonality Insights for Municipio de Garupá
- The Airbnb seasonality in Municipio de Garupá shows highly seasonal trends requiring careful strategy. While the sections above show seasonal averages, it's also insightful to look at the extremes:
- During the high season, the absolute peak month showcases Municipio de Garupá's highest earning potential, with monthly revenues capable of climbing to $1,501, occupancy reaching a high of 43.3%, and ADRs peaking at $48.
- Conversely, the slowest single month of the year, typically falling within the low season, marks the market's lowest point. In this month, revenue might dip to $264, occupancy could drop to 0.0%, and ADRs may adjust down to $31.
- Understanding both the seasonal averages and these monthly peaks and troughs in revenue, occupancy, and ADR is crucial for maximizing your Airbnb profit potential in Municipio de Garupá.
Seasonal Strategies for Maximizing Profit
- Peak Season: Maximize revenue through premium pricing and potentially longer minimum stays. Ensure high availability.
- Low Season: Offer competitive pricing, special promotions (e.g., extended stay discounts), and flexible cancellation policies. Target off-season travelers like remote workers or budget-conscious guests.
- Shoulder Seasons: Implement dynamic pricing that balances peak and low rates. Target weekend travelers or specific events. Offer slightly more flexible terms than peak season.
- Regularly analyze your own performance against these Municipio de Garupá seasonality benchmarks and adjust your pricing and availability strategy accordingly.
Best Areas for Airbnb Investment in Municipio de Garupá (2026)
Exploring the top neighborhoods for short-term rentals in Municipio de Garupá? This section highlights key areas, outlining why they are attractive for hosts and guests, along with notable local attractions. Consider these locations based on your target guest profile and investment strategy.
| Neighborhood / Area | Why Host Here? (Target Guests & Appeal) | Key Attractions & Landmarks |
|---|---|---|
| Centro de Garupá | The main hub of the Municipio, offering easy access to local amenities, shops, and services. A prime location for travelers looking for convenience and city life. | Plaza del Sol, Local markets, Cultural events center, Public transportation access, Nearby restaurants |
| Los Lapachos | A suburban area known for its tranquility and green spaces. Ideal for families or groups wanting a peaceful retreat while still being close to urban conveniences. | Natural parks, Hiking trails, Community activities, Family-friendly spaces |
| Rincón del Sol | A charming neighborhood close to the natural beauty of the Misiones province, attracting nature lovers and outdoor enthusiasts looking for relaxation and adventure. | Parks, Riverside activities, Nature trails, Wildlife watching |
| Villa Cabello | A residential area with family-friendly amenities and a strong community feel. It is a good choice for longer stays and for those who want a local experience. | Local cafes, Community events, Nearby schools and parks |
| Cerro Pencal | Offers stunning views and a more secluded feel. It attracts visitors who prefer peace and quiet, with access to natural attractions. | Hiking spots, Scenic overlooks, Natural landscapes |
| Barrio El Porvenir | A developing neighborhood with growing interest from tourists and locals alike, providing a glimpse into the everyday life of Garupá residents. | Local eateries, Small shops, Cultural experiences |
| San Javier | Close to the border with Posadas, it’s popular for visitors looking to explore both areas, making it a strategic spot for hosts. | Shopping centers, Cafes, Cultural sites |
| Aguaray | A tranquil area that offers a retreat from city life, appealing to guests looking for relaxation, with a focus on local beauty and culture. | Natural reserves, Local festivals, Artisan markets |
Understanding Airbnb License Requirements & STR Laws in Municipio de Garupá (2026)
While Municipio de Garupá, Misiones, Argentina currently shows low STR regulations, specific Airbnb license requirements might still exist or change. Always verify the latest short term rental regulations and Airbnb license requirements directly with local government authorities for Municipio de Garupá to ensure full compliance before hosting.
(Source: AirROI data, 2026, finding no licensed listings among those analyzed)
Top Performing Airbnb Properties in Municipio de Garupá (2026)
Benchmark your potential! Explore examples of top-performing Airbnb properties in Municipio de Garupábased on Trailing Twelve Month (TTM) revenue. Analyze their characteristics, revenue, occupancy rate, and ADR to understand what drives success in this market.

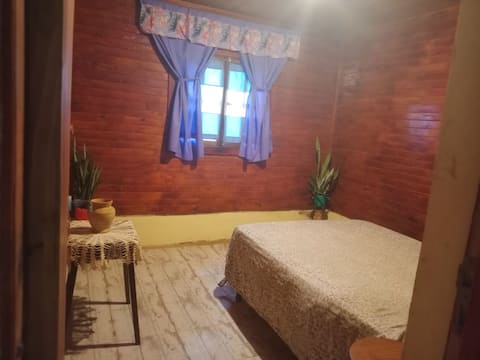
Cabaña Nordica
Entire Place • 2 bedrooms

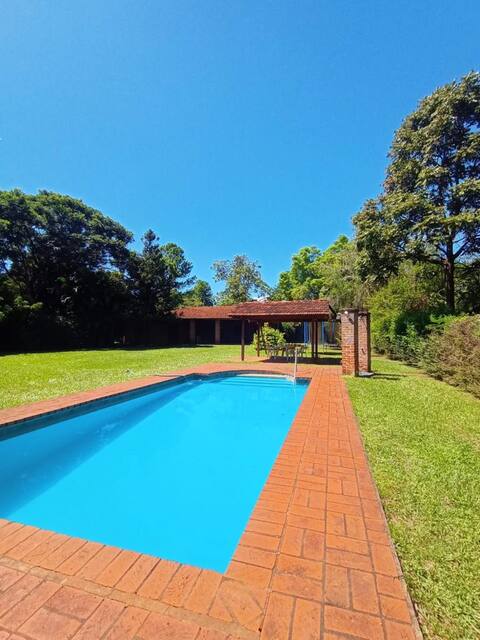
House with pool and park
Entire Place • 2 bedrooms

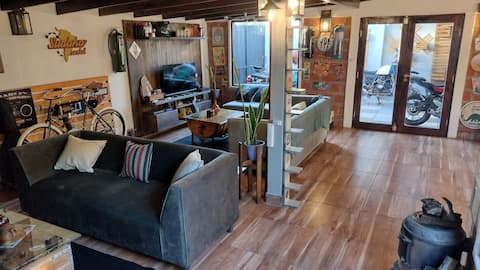
Cabaña Dombo ~ tu descanso, tu hogar.
Entire Place • 3 bedrooms
Casa en country La Eugenia- Posadas
Entire Place • 2 bedrooms
Argentita
Entire Place • 2 bedrooms
C01 Descansá con Estilo Tu Cama en Moderno Hostel
Private Room • 1 bedroom
Note: Performance varies based on location, size, amenities, seasonality, and management quality. Data reflects the past 12 months.
Top Performing Airbnb Hosts in Municipio de Garupá (2026)
Learn from the best! This table showcases top-performing Airbnb hosts in Municipio de Garupá based on the number of properties managed and estimated total revenue over the past year. Analyze their scale and performance metrics.
| Host Name | Properties | Grossing Revenue | Stay Reviews | Avg Rating |
|---|---|---|---|---|
| Host #307129474 | 12 | $12,595 | 0 | 0.00/5.0 |
| Host #2286487 | 1 | $12,439 | 0 | 0.00/5.0 |
| Raúl Anibal | 1 | $5,302 | 6 | 5.00/5.0 |
| Host #84093497 | 1 | $3,623 | 0 | 0.00/5.0 |
| Host #29344377 | 1 | $2,760 | 0 | 0.00/5.0 |
| Host #249927132 | 1 | $2,616 | 0 | 0.00/5.0 |
| Host #208009384 | 1 | $1,034 | 0 | 0.00/5.0 |
| Host #47288587 | 1 | $655 | 2 | 0.00/5.0 |
| Host #231306584 | 1 | $629 | 0 | 0.00/5.0 |
| Carmen | 1 | $85 | 13 | 4.92/5.0 |
Analyzing the strategies of top hosts, such as their property selection, pricing, and guest communication, can offer valuable lessons for optimizing your own Airbnb operations in Municipio de Garupá.
Dive Deeper: Advanced Municipio de Garupá STR Market Data (2026)
Ready to unlock more insights? AirROI provides access to advanced metrics and comprehensive Airbnb data for Municipio de Garupá. Explore detailed analytics beyond this report to refine your investment strategy, optimize pricing, and maximize your vacation rental profits.
Explore Advanced MetricsMunicipio de Garupá Short-Term Rental Market Composition (2026): Property & Room Types
Room Type Distribution
Property Type Distribution
Market Composition Insights for Municipio de Garupá
- The Municipio de Garupá Airbnb market composition is heavily skewed towards Shared Room listings, which make up 61.9% of the 21 active rentals. This indicates strong guest preference for privacy and space.
- Looking at the property type distribution in Municipio de Garupá, Hotel/Boutique properties are the most common (57.1%), reflecting the local real estate landscape.
- Houses represent a significant 23.8% portion, catering likely to families or larger groups.
- The presence of 57.1% Hotel/Boutique listings indicates integration with traditional hospitality.
- Smaller segments like apartment/condo (combined 4.8%) offer potential for unique stay experiences.
Municipio de Garupá Airbnb Room Capacity Analysis (2026): Bedroom Distribution
Distribution of Listings by Number of Bedrooms
Room Capacity Insights for Municipio de Garupá
- The dominant room capacity in Municipio de Garupá is 1 bedroom listings, making up 71.4% of the market. This suggests a strong demand for properties suitable for couples or solo travelers.
- Together, 1 bedroom and 2 bedrooms properties represent 95.2% of the active Airbnb listings in Municipio de Garupá, indicating a high concentration in these sizes.
- With over half the market (71.4%) consisting of studios or 1-bedroom units, Municipio de Garupá is particularly well-suited for individuals or couples.
- Listings with 3+ bedrooms (4.8%) represent a smaller niche, potentially indicating an underserved market for larger group accommodations in Municipio de Garupá.
Municipio de Garupá Vacation Rental Guest Capacity Trends (2026)
Distribution of Listings by Guest Capacity
Guest Capacity Insights for Municipio de Garupá
- The most common guest capacity trend in Municipio de Garupá vacation rentals is listings accommodating 1 guest (61.9%). This suggests the primary traveler segment is likely couples or solo travelers.
- Properties designed for 1 guest and 5 guests dominate the Municipio de Garupá STR market, accounting for 76.2% of listings.
- A significant 71.4% of listings cater specifically to 1-2 guests, highlighting strong demand from couples and solo travelers in Municipio de Garupá.
- On average, properties in Municipio de Garupá are equipped to host 2.4 guests.
Municipio de Garupá Airbnb Booking Patterns (2026): Available vs. Booked Days
Available Days Distribution
Booked Days Distribution
Booking Pattern Insights for Municipio de Garupá
- The most common availability pattern in Municipio de Garupá falls within the 271-366 days range, representing 95.2% of listings. This suggests many properties have significant open periods on their calendars.
- Approximately 100.0% of listings show high availability (181+ days open annually), indicating potential for increased bookings or specific owner usage patterns.
- For booked days, the 31-90 days range is most frequent in Municipio de Garupá (85.7%), reflecting common guest stay durations or potential owner blocking patterns.
Municipio de Garupá Airbnb Minimum Stay Requirements Analysis
Distribution of Listings by Minimum Night Requirement
1 Night
15 listings
75% of total
2 Nights
3 listings
15% of total
3 Nights
2 listings
10% of total
Key Insights
- The most prevalent minimum stay requirement in Municipio de Garupá is 1 Night, adopted by 75% of listings. This highlights the market's preference for shorter, flexible bookings.
- A strong majority (90.0%) of the Municipio de Garupá Airbnb data shows acceptance of very short stays (1-2 nights), indicating a dynamic, high-turnover market.
Recommendations
- Align with the market by considering a 1 Night minimum stay, as 75% of Municipio de Garupá hosts use this setting.
- Adjust minimum nights based on seasonality – potentially shorter during low season and longer during peak demand periods in Municipio de Garupá.
Municipio de Garupá Airbnb Cancellation Policy Trends Analysis (2026)
Flexible
2 listings
100% of total
Cancellation Policy Insights for Municipio de Garupá
- The prevailing Airbnb cancellation policy trend in Municipio de Garupá is Flexible, used by 100% of listings.
- The market strongly favors guest-friendly terms, with 100.0% of listings offering Flexible or Moderate policies. This suggests guests in Municipio de Garupá may expect booking flexibility.
Recommendations for Hosts
- Consider adopting a Flexible policy to align with the 100% market standard in Municipio de Garupá.
- Given the high prevalence of Flexible policies (100%), offering this can enhance booking appeal, especially during shoulder seasons.
- Regularly review your cancellation policy against competitors and market demand shifts in Municipio de Garupá.
Municipio de Garupá STR Booking Lead Time Analysis (2026)
Average Booking Lead Time by Month
Booking Lead Time Insights for Municipio de Garupá
- The overall average booking lead time for vacation rentals in Municipio de Garupá is 8 days.
- Guests book furthest in advance for stays during December (average 33 days), likely coinciding with peak travel demand or local events.
- The shortest booking windows occur for stays in June (average 0 days), indicating more last-minute travel plans during this time.
- Seasonally, Winter (18 days avg.) sees the longest lead times, while Summer (2 days avg.) has the shortest, reflecting typical travel planning cycles.
Recommendations for Hosts
- Use the overall average lead time (8 days) as a baseline for your pricing and availability strategy in Municipio de Garupá.
- For December stays, consider implementing length-of-stay discounts or slightly higher rates for bookings made less than 33 days out to capitalize on advance planning.
- During June, focus on last-minute booking availability and promotions, as guests book with very short notice (0 days avg.).
- Target marketing efforts for the Winter season well in advance (at least 18 days) to capture early planners.
- Monitor your own booking lead times against these Municipio de Garupá averages to identify opportunities for dynamic pricing adjustments.
Popular & Essential Airbnb Amenities in Municipio de Garupá (2026)
Amenity Prevalence
Amenity Insights for Municipio de Garupá
- Essential amenities in Municipio de Garupá that guests expect include: Air conditioning, TV, Kitchen, Washer, Essentials, Heating, Wifi. Lacking these (any) could significantly impact bookings.
- Popular amenities like Hot water, Dryer, Smoke alarm are common but not universal. Offering these can provide a competitive edge.
Recommendations for Hosts
- Ensure your listing includes all essential amenities for Municipio de Garupá: Air conditioning, TV, Kitchen, Washer, Essentials, Heating, Wifi.
- Prioritize adding missing essentials: Washer, Essentials, Heating, Wifi.
- Consider adding popular differentiators like Hot water or Dryer to increase appeal.
- Highlight unique or less common amenities you offer (e.g., hot tub, dedicated workspace, EV charger) in your listing description and photos.
- Regularly check competitor amenities in Municipio de Garupá to stay competitive.
Municipio de Garupá Airbnb Guest Demographics & Profile Analysis (2026)
Guest Profile Summary for Municipio de Garupá
- The typical guest profile for Airbnb in Municipio de Garupá consists of predominantly international visitors (100%), with top international origins including Brazil, typically belonging to the 1990s (Older Gen Z) group (50%), primarily speaking English or Portuguese.
- Domestic travelers account for 0.0% of guests.
- Top languages spoken are English (50%) followed by Portuguese (50%).
- A significant demographic segment is the Post-2000s (Gen Z/Alpha) group, representing 50% of guests.
Recommendations for Hosts
- Focus marketing internationally, particularly towards travelers from Brazil.
- Tailor amenities and listing descriptions to appeal to the dominant 1990s (Older Gen Z) demographic (e.g., highlight fast WiFi, smart home features, local guides).
- Highlight unique local experiences or amenities relevant to the primary guest profile.
- Consider seasonal promotions aligned with peak travel times for key origin markets.
Nearby Short-Term Rental Market Comparison
How does the Municipio de Garupá Airbnb market stack up against its neighbors? Compare key performance metrics like average monthly revenue, ADR, and occupancy rates in surrounding areas to understand the broader regional STR landscape.
| Market | Active Properties | Monthly Revenue | Daily Rate | Avg. Occupancy |
|---|---|---|---|---|
| Municipio de Ituzaingó | 30 | $651 | $94.01 | 24% |
| Municipio de Candelaria | 10 | $527 | $89.39 | 25% |
| Encarnacion | 276 | $368 | $64.46 | 20% |
| São Borja | 10 | $356 | $27.37 | 36% |
| Posadas | 330 | $337 | $39.95 | 32% |
| Santa Rosa | 15 | $283 | $50.47 | 27% |
| Santo Ângelo | 38 | $278 | $33.11 | 33% |
| Hohenau | 11 | $246 | $37.08 | 29% |
| Municipio de El Soberbio | 13 | $220 | $38.20 | 17% |
| Municipio de Eldorado | 20 | $205 | $32.14 | 22% |