Municipio de Oberá Airbnb Market Analysis 2026: Short Term Rental Data & Vacation Rental Statistics in Misiones, Argentina
Is Airbnb profitable in Municipio de Oberá in 2026? Explore comprehensive Airbnb analytics for Municipio de Oberá, Misiones, Argentina to uncover income potential. This 2026 STR market report for Municipio de Oberá, based on AirROI data from February 2025 to January 2026, reveals key trends in the niche market of 32 active listings.
Whether you're considering an Airbnb investment in Municipio de Oberá, optimizing your existing vacation rental, or exploring rental arbitrage opportunities, understanding the Municipio de Oberá Airbnb data is crucial. Leveraging the low regulation environment is key to maximizing your short term rental income potential. Let's dive into the specifics.
Key Municipio de Oberá Airbnb Performance Metrics Overview
Monthly Airbnb Revenue Variations & Income Potential in Municipio de Oberá (2026)
Understanding the monthly revenue variations for Airbnb listings in Municipio de Oberá is key to maximizing your short term rental income potential. Seasonality significantly impacts earnings. Our analysis, based on data from the past 12 months, shows that the peak revenue month for STRs in Municipio de Oberá is typically September, while April often presents the lowest earnings, highlighting opportunities for strategic pricing adjustments during shoulder and low seasons. Explore the typical Airbnb income in Municipio de Oberá across different performance tiers:
- Best-in-class properties (Top 10%) achieve $584+ monthly, often utilizing dynamic pricing and superior guest experiences.
- Strong performing properties (Top 25%) earn $303 or more, indicating effective management and desirable locations/amenities.
- Typical properties (Median) generate around $162 per month, representing the average market performance.
- Entry-level properties (Bottom 25%) see earnings around $95, often with potential for optimization.
Average Monthly Airbnb Earnings Trend in Municipio de Oberá
Municipio de Oberá Airbnb Occupancy Rate Trends (2026)
Maximize your bookings by understanding the Municipio de Oberá STR occupancy trends. Seasonal demand shifts significantly influence how often properties are booked. Typically, Septembersees the highest demand (peak season occupancy), while October experiences the lowest (low season). Effective strategies, like adjusting minimum stays or offering promotions, can boost occupancy during slower periods. Here's how different property tiers perform in Municipio de Oberá:
- Best-in-class properties (Top 10%) achieve 43%+ occupancy, indicating high desirability and potentially optimized availability.
- Strong performing properties (Top 25%) maintain 28% or higher occupancy, suggesting good market fit and guest satisfaction.
- Typical properties (Median) have an occupancy rate around 16%.
- Entry-level properties (Bottom 25%) average 10% occupancy, potentially facing higher vacancy.
Average Monthly Occupancy Rate Trend in Municipio de Oberá
Average Daily Rate (ADR) Airbnb Trends in Municipio de Oberá (2026)
Effective short term rental pricing strategy in Municipio de Oberá involves understanding monthly ADR fluctuations. The Average Daily Rate (ADR) for Airbnb in Municipio de Oberá typically peaks in September and dips lowest during April. Leveraging Airbnb dynamic pricing tools or strategies based on this seasonality can significantly boost revenue. Here's a look at the typical nightly rates achieved:
- Best-in-class properties (Top 10%) command rates of $65+ per night, often due to premium features or locations.
- Strong performing properties (Top 25%) achieve nightly rates of $49 or more.
- Typical properties (Median) charge around $36 per night.
- Entry-level properties (Bottom 25%) earn around $26 per night.
Average Daily Rate (ADR) Trend by Month in Municipio de Oberá
Get Live Municipio de Oberá Market Intelligence 👇

Explore Real-time Analytics
Airbnb Seasonality Analysis & Trends in Municipio de Oberá (2026)
Peak Season (September, May, August)
- Revenue averages $326 per month
- Occupancy rates average 27.7%
- Daily rates average $41
Shoulder Season
- Revenue averages $233 per month
- Occupancy maintains around 20.8%
- Daily rates hold near $40
Low Season (April, October, December)
- Revenue drops to average $184 per month
- Occupancy decreases to average 17.3%
- Daily rates adjust to average $40
Seasonality Insights for Municipio de Oberá
- The Airbnb seasonality in Municipio de Oberá shows highly seasonal trends requiring careful strategy. While the sections above show seasonal averages, it's also insightful to look at the extremes:
- During the high season, the absolute peak month showcases Municipio de Oberá's highest earning potential, with monthly revenues capable of climbing to $381, occupancy reaching a high of 35.1%, and ADRs peaking at $41.
- Conversely, the slowest single month of the year, typically falling within the low season, marks the market's lowest point. In this month, revenue might dip to $150, occupancy could drop to 16.7%, and ADRs may adjust down to $39.
- Understanding both the seasonal averages and these monthly peaks and troughs in revenue, occupancy, and ADR is crucial for maximizing your Airbnb profit potential in Municipio de Oberá.
Seasonal Strategies for Maximizing Profit
- Peak Season: Maximize revenue through premium pricing and potentially longer minimum stays. Ensure high availability.
- Low Season: Offer competitive pricing, special promotions (e.g., extended stay discounts), and flexible cancellation policies. Target off-season travelers like remote workers or budget-conscious guests.
- Shoulder Seasons: Implement dynamic pricing that balances peak and low rates. Target weekend travelers or specific events. Offer slightly more flexible terms than peak season.
- Regularly analyze your own performance against these Municipio de Oberá seasonality benchmarks and adjust your pricing and availability strategy accordingly.
Best Areas for Airbnb Investment in Municipio de Oberá (2026)
Exploring the top neighborhoods for short-term rentals in Municipio de Oberá? This section highlights key areas, outlining why they are attractive for hosts and guests, along with notable local attractions. Consider these locations based on your target guest profile and investment strategy.
| Neighborhood / Area | Why Host Here? (Target Guests & Appeal) | Key Attractions & Landmarks |
|---|---|---|
| Centro de Oberá | The heart of Oberá, offering various amenities, shops, and services. Ideal for guests looking for convenience and local culture. | Parque de las Naciones, Museo Histórico, Shopping Oberá, Centro Cultural de Oberá, Plaza San Martín |
| Parque de las Naciones | An attractive area known for its beautiful parks and cultural events. Great for families and nature lovers looking to enjoy outdoor activities. | Parque de las Naciones Utaka, Cultural events, Festivals, Walking trails, Local cuisine stalls |
| Zona Rural de Oberá | Perfect for guests seeking a tranquil stay in the countryside. The rural area offers beautiful landscapes and a chance to experience local life. | Cafés coloniales, Senderos naturales, Fincas de yerba mate, Fauna y flora locales |
| Villa Svea | A quiet residential area close to nature, perfect for guests wanting a peaceful retreat but still close to the city. | Lagos y ríos, Áreas recreativas, Rutas de senderismo, Céspedes extensos |
| Barrio 100 Hectáreas | An expanding neighborhood with various housing options; suitable for budget travelers or long-term stays. | Visitas locales, Comodidades cercanas, Parques locales, Acceso fácil a rutas principales |
| Barrio Villa Aurora | A vibrant neighborhood with a local feel, popular among visitors looking to immerse themselves in the everyday life of Oberá. | Cafés y tiendas locales, Mercados de agricultores, Cultura local, Eventos comunitarios |
| Barrio El Colono | A residential area with a strong community vibe, great for families seeking comfortable accommodations. | Centros educativos, Parques, Actividades de la comunidad, Ambiente amigable |
| Las Tres Rutas | A strategic area connecting several important roads, ideal for those traveling through or visiting nearby attractions. | Rutas de acceso, Visitas a localidades cercanas, Naturaleza y paisajes, Mercados de la zona |
Understanding Airbnb License Requirements & STR Laws in Municipio de Oberá (2026)
While Municipio de Oberá, Misiones, Argentina currently shows low STR regulations, specific Airbnb license requirements might still exist or change. Always verify the latest short term rental regulations and Airbnb license requirements directly with local government authorities for Municipio de Oberá to ensure full compliance before hosting.
(Source: AirROI data, 2026, finding no licensed listings among those analyzed)
Top Performing Airbnb Properties in Municipio de Oberá (2026)
Benchmark your potential! Explore examples of top-performing Airbnb properties in Municipio de Oberábased on Trailing Twelve Month (TTM) revenue. Analyze their characteristics, revenue, occupancy rate, and ADR to understand what drives success in this market.

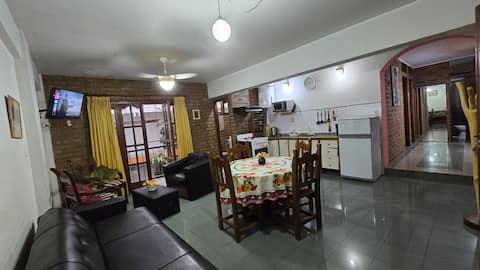
Spacious, bright and central apartment
Entire Place • 2 bedrooms
Family-friendly, in the center itself, garage
Entire Place • 2 bedrooms

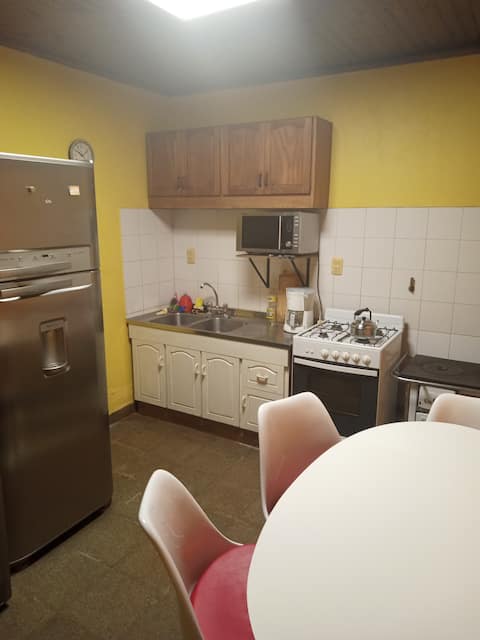
Minimalist apartment in Oberá Misiones
Entire Place • 1 bedroom
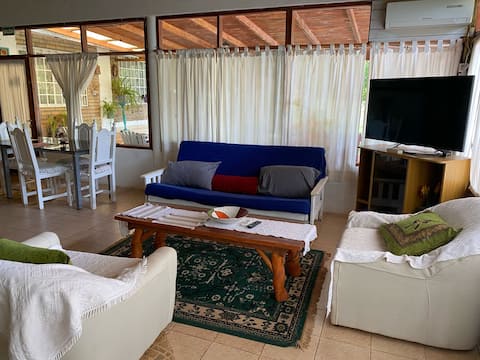
Wide family cabins in Oberá
Entire Place • 2 bedrooms
Comfortable private home in Oberá.
Entire Place • 2 bedrooms
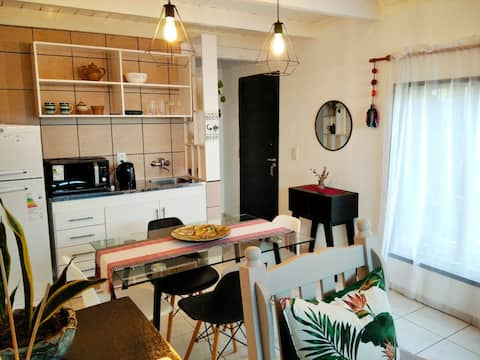
Wooden house
Entire Place • 1 bedroom
Note: Performance varies based on location, size, amenities, seasonality, and management quality. Data reflects the past 12 months.
Top Performing Airbnb Hosts in Municipio de Oberá (2026)
Learn from the best! This table showcases top-performing Airbnb hosts in Municipio de Oberá based on the number of properties managed and estimated total revenue over the past year. Analyze their scale and performance metrics.
| Host Name | Properties | Grossing Revenue | Stay Reviews | Avg Rating |
|---|---|---|---|---|
| Romeo Roque | 9 | $14,078 | 37 | 4.97/5.0 |
| Daniel | 1 | $8,757 | 39 | 5.00/5.0 |
| María Isabel | 4 | $4,437 | 38 | 4.85/5.0 |
| Julian | 2 | $3,775 | 11 | 4.88/5.0 |
| Laura | 1 | $3,035 | 16 | 4.56/5.0 |
| Judith | 3 | $2,715 | 10 | 4.67/5.0 |
| Pedro | 1 | $2,325 | 16 | 4.88/5.0 |
| Gabriela | 1 | $2,261 | 10 | 4.80/5.0 |
| Marcelo | 1 | $1,918 | 11 | 5.00/5.0 |
| Carolina | 1 | $1,771 | 6 | 5.00/5.0 |
Analyzing the strategies of top hosts, such as their property selection, pricing, and guest communication, can offer valuable lessons for optimizing your own Airbnb operations in Municipio de Oberá.
Dive Deeper: Advanced Municipio de Oberá STR Market Data (2026)
Ready to unlock more insights? AirROI provides access to advanced metrics and comprehensive Airbnb data for Municipio de Oberá. Explore detailed analytics beyond this report to refine your investment strategy, optimize pricing, and maximize your vacation rental profits.
Explore Advanced MetricsMunicipio de Oberá Short-Term Rental Market Composition (2026): Property & Room Types
Room Type Distribution
Property Type Distribution
Market Composition Insights for Municipio de Oberá
- The Municipio de Oberá Airbnb market composition is heavily skewed towards Entire Home/Apt listings, which make up 84.4% of the 32 active rentals. This indicates strong guest preference for privacy and space.
- Looking at the property type distribution in Municipio de Oberá, Apartment/Condo properties are the most common (50%), reflecting the local real estate landscape.
- Houses represent a significant 18.8% portion, catering likely to families or larger groups.
- The presence of 6.3% Hotel/Boutique listings indicates integration with traditional hospitality.
Municipio de Oberá Airbnb Room Capacity Analysis (2026): Bedroom Distribution
Distribution of Listings by Number of Bedrooms
Room Capacity Insights for Municipio de Oberá
- The dominant room capacity in Municipio de Oberá is 1 bedroom listings, making up 43.8% of the market. This suggests a strong demand for properties suitable for couples or solo travelers.
- Together, 1 bedroom and 2 bedrooms properties represent 81.3% of the active Airbnb listings in Municipio de Oberá, indicating a high concentration in these sizes.
- Listings with 3+ bedrooms (3.1%) represent a smaller niche, potentially indicating an underserved market for larger group accommodations in Municipio de Oberá.
Municipio de Oberá Vacation Rental Guest Capacity Trends (2026)
Distribution of Listings by Guest Capacity
Guest Capacity Insights for Municipio de Oberá
- The most common guest capacity trend in Municipio de Oberá vacation rentals is listings accommodating 4 guests (21.9%). This suggests the primary traveler segment is likely small families or groups.
- Properties designed for 4 guests and 3 guests dominate the Municipio de Oberá STR market, accounting for 43.8% of listings.
- On average, properties in Municipio de Oberá are equipped to host 3.2 guests.
Municipio de Oberá Airbnb Booking Patterns (2026): Available vs. Booked Days
Available Days Distribution
Booked Days Distribution
Booking Pattern Insights for Municipio de Oberá
- The most common availability pattern in Municipio de Oberá falls within the 271-366 days range, representing 93.8% of listings. This suggests many properties have significant open periods on their calendars.
- Approximately 100.1% of listings show high availability (181+ days open annually), indicating potential for increased bookings or specific owner usage patterns.
- For booked days, the 31-90 days range is most frequent in Municipio de Oberá (68.8%), reflecting common guest stay durations or potential owner blocking patterns.
Municipio de Oberá Airbnb Minimum Stay Requirements Analysis
Distribution of Listings by Minimum Night Requirement
1 Night
21 listings
65.6% of total
2 Nights
9 listings
28.1% of total
30+ Nights
2 listings
6.3% of total
Key Insights
- The most prevalent minimum stay requirement in Municipio de Oberá is 1 Night, adopted by 65.6% of listings. This highlights the market's preference for shorter, flexible bookings.
- A strong majority (93.7%) of the Municipio de Oberá Airbnb data shows acceptance of very short stays (1-2 nights), indicating a dynamic, high-turnover market.
Recommendations
- Align with the market by considering a 1 Night minimum stay, as 65.6% of Municipio de Oberá hosts use this setting.
- Explore offering discounts for stays of 30+ nights to attract the 6.3% of the market seeking extended stays.
- Adjust minimum nights based on seasonality – potentially shorter during low season and longer during peak demand periods in Municipio de Oberá.
Municipio de Oberá Airbnb Cancellation Policy Trends Analysis (2026)
Flexible
14 listings
43.8% of total
Moderate
14 listings
43.8% of total
Firm
4 listings
12.5% of total
Cancellation Policy Insights for Municipio de Oberá
- The prevailing Airbnb cancellation policy trend in Municipio de Oberá is Flexible, used by 43.8% of listings.
- The market strongly favors guest-friendly terms, with 87.6% of listings offering Flexible or Moderate policies. This suggests guests in Municipio de Oberá may expect booking flexibility.
Recommendations for Hosts
- Consider adopting a Flexible policy to align with the 43.8% market standard in Municipio de Oberá.
- Regularly review your cancellation policy against competitors and market demand shifts in Municipio de Oberá.
Municipio de Oberá STR Booking Lead Time Analysis (2026)
Average Booking Lead Time by Month
Booking Lead Time Insights for Municipio de Oberá
- The overall average booking lead time for vacation rentals in Municipio de Oberá is 24 days.
- Guests book furthest in advance for stays during October (average 39 days), likely coinciding with peak travel demand or local events.
- The shortest booking windows occur for stays in November (average 2 days), indicating more last-minute travel plans during this time.
- Seasonally, Spring (28 days avg.) sees the longest lead times, while Summer (13 days avg.) has the shortest, reflecting typical travel planning cycles.
Recommendations for Hosts
- Use the overall average lead time (24 days) as a baseline for your pricing and availability strategy in Municipio de Oberá.
- For October stays, consider implementing length-of-stay discounts or slightly higher rates for bookings made less than 39 days out to capitalize on advance planning.
- During November, focus on last-minute booking availability and promotions, as guests book with very short notice (2 days avg.).
- Target marketing efforts for the Spring season well in advance (at least 28 days) to capture early planners.
- Monitor your own booking lead times against these Municipio de Oberá averages to identify opportunities for dynamic pricing adjustments.
Popular & Essential Airbnb Amenities in Municipio de Oberá (2026)
Amenity Prevalence
Amenity Insights for Municipio de Oberá
- Essential amenities in Municipio de Oberá that guests expect include: Wifi. Lacking these (this) could significantly impact bookings.
- Popular amenities like Kitchen, TV, Air conditioning are common but not universal. Offering these can provide a competitive edge.
Recommendations for Hosts
- Ensure your listing includes all essential amenities for Municipio de Oberá: Wifi.
- Prioritize adding missing essentials: Wifi.
- Consider adding popular differentiators like Kitchen or TV to increase appeal.
- Highlight unique or less common amenities you offer (e.g., hot tub, dedicated workspace, EV charger) in your listing description and photos.
- Regularly check competitor amenities in Municipio de Oberá to stay competitive.
Municipio de Oberá Airbnb Guest Demographics & Profile Analysis (2026)
Guest Profile Summary for Municipio de Oberá
- The typical guest profile for Airbnb in Municipio de Oberá consists of a mix of domestic (56%) and international guests, often arriving from nearby Posadas, typically belonging to the Post-2000s (Gen Z/Alpha) group (50%), primarily speaking Spanish or English.
- Domestic travelers account for 55.6% of guests.
- Key international markets include Argentina (55.6%) and Brazil (24.4%).
- Top languages spoken are Spanish (40%) followed by English (23.6%).
- A significant demographic segment is the Post-2000s (Gen Z/Alpha) group, representing 50% of guests.
Recommendations for Hosts
- Balance marketing efforts between domestic and international channels based on the guest mix.
- Tailor amenities and listing descriptions to appeal to the dominant Post-2000s (Gen Z/Alpha) demographic (e.g., highlight fast WiFi, smart home features, local guides).
- Highlight unique local experiences or amenities relevant to the primary guest profile.
- Consider seasonal promotions aligned with peak travel times for key origin markets.
Nearby Short-Term Rental Market Comparison
How does the Municipio de Oberá Airbnb market stack up against its neighbors? Compare key performance metrics like average monthly revenue, ADR, and occupancy rates in surrounding areas to understand the broader regional STR landscape.
| Market | Active Properties | Monthly Revenue | Daily Rate | Avg. Occupancy |
|---|---|---|---|---|
| Encarnación | 24 | $327 | $137.83 | 26% |
| Encarnacion | 220 | $321 | $71.77 | 24% |
| Posadas | 314 | $310 | $50.00 | 31% |
| Hohenau | 14 | $298 | $45.77 | 31% |
| São Borja | 19 | $286 | $39.04 | 30% |
| Municipio de Ituzaingó | 22 | $279 | $82.31 | 19% |
| Santa Rosa | 20 | $216 | $39.45 | 32% |
| Santo Ângelo | 44 | $189 | $28.08 | 33% |
| Municipio de Eldorado | 23 | $187 | $33.89 | 25% |
| São Miguel das Missões | 25 | $129 | $47.41 | 17% |