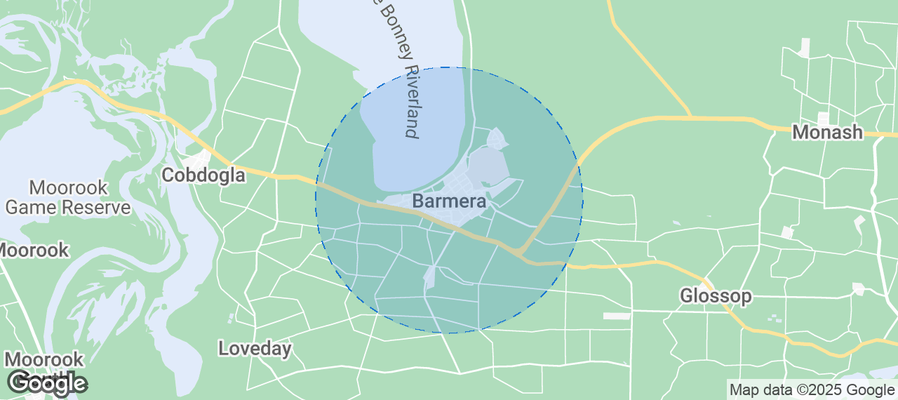
Barmera Airbnb Market Analysis 2026: Short Term Rental Data & Vacation Rental Statistics in South Australia, Australia
Is Airbnb profitable in Barmera in 2026? Explore comprehensive Airbnb analytics for Barmera, South Australia, Australia to uncover income potential. This 2026 STR market report for Barmera, based on AirROI data from February 2025 to January 2026, reveals key trends in the niche market of 18 active listings.
Whether you're considering an Airbnb investment in Barmera, optimizing your existing vacation rental, or exploring rental arbitrage opportunities, understanding the Barmera Airbnb data is crucial. Leveraging the low regulation environment is key to maximizing your short term rental income potential. Let's dive into the specifics.
Key Barmera Airbnb Performance Metrics Overview
Monthly Airbnb Revenue Variations & Income Potential in Barmera (2026)
Understanding the monthly revenue variations for Airbnb listings in Barmera is key to maximizing your short term rental income potential. Seasonality significantly impacts earnings. Our analysis, based on data from the past 12 months, shows that the peak revenue month for STRs in Barmera is typically October, while February often presents the lowest earnings, highlighting opportunities for strategic pricing adjustments during shoulder and low seasons. Explore the typical Airbnb income in Barmera across different performance tiers:
- Best-in-class properties (Top 10%) achieve $4,736+ monthly, often utilizing dynamic pricing and superior guest experiences.
- Strong performing properties (Top 25%) earn $3,452 or more, indicating effective management and desirable locations/amenities.
- Typical properties (Median) generate around $2,232 per month, representing the average market performance.
- Entry-level properties (Bottom 25%) see earnings around $1,464, often with potential for optimization.
Average Monthly Airbnb Earnings Trend in Barmera
Barmera Airbnb Occupancy Rate Trends (2026)
Maximize your bookings by understanding the Barmera STR occupancy trends. Seasonal demand shifts significantly influence how often properties are booked. Typically, Aprilsees the highest demand (peak season occupancy), while February experiences the lowest (low season). Effective strategies, like adjusting minimum stays or offering promotions, can boost occupancy during slower periods. Here's how different property tiers perform in Barmera:
- Best-in-class properties (Top 10%) achieve 81%+ occupancy, indicating high desirability and potentially optimized availability.
- Strong performing properties (Top 25%) maintain 65% or higher occupancy, suggesting good market fit and guest satisfaction.
- Typical properties (Median) have an occupancy rate around 47%.
- Entry-level properties (Bottom 25%) average 32% occupancy, potentially facing higher vacancy.
Average Monthly Occupancy Rate Trend in Barmera
Average Daily Rate (ADR) Airbnb Trends in Barmera (2026)
Effective short term rental pricing strategy in Barmera involves understanding monthly ADR fluctuations. The Average Daily Rate (ADR) for Airbnb in Barmera typically peaks in January and dips lowest during May. Leveraging Airbnb dynamic pricing tools or strategies based on this seasonality can significantly boost revenue. Here's a look at the typical nightly rates achieved:
- Best-in-class properties (Top 10%) command rates of $236+ per night, often due to premium features or locations.
- Strong performing properties (Top 25%) achieve nightly rates of $185 or more.
- Typical properties (Median) charge around $146 per night.
- Entry-level properties (Bottom 25%) earn around $116 per night.
Average Daily Rate (ADR) Trend by Month in Barmera
Get Live Barmera Market Intelligence 👇
Explore Real-time Analytics
Airbnb Seasonality Analysis & Trends in Barmera (2026)
Peak Season (October, April, June)
- Revenue averages $3,165 per month
- Occupancy rates average 58.2%
- Daily rates average $156
Shoulder Season
- Revenue averages $2,501 per month
- Occupancy maintains around 47.4%
- Daily rates hold near $156
Low Season (February, March, August)
- Revenue drops to average $2,116 per month
- Occupancy decreases to average 42.4%
- Daily rates adjust to average $155
Seasonality Insights for Barmera
- The Airbnb seasonality in Barmera shows moderate seasonality with distinct peak and low periods. While the sections above show seasonal averages, it's also insightful to look at the extremes:
- During the high season, the absolute peak month showcases Barmera's highest earning potential, with monthly revenues capable of climbing to $3,516, occupancy reaching a high of 63.6%, and ADRs peaking at $160.
- Conversely, the slowest single month of the year, typically falling within the low season, marks the market's lowest point. In this month, revenue might dip to $1,852, occupancy could drop to 36.0%, and ADRs may adjust down to $152.
- Understanding both the seasonal averages and these monthly peaks and troughs in revenue, occupancy, and ADR is crucial for maximizing your Airbnb profit potential in Barmera.
Seasonal Strategies for Maximizing Profit
- Peak Season: Maximize revenue through premium pricing and potentially longer minimum stays. Ensure high availability.
- Low Season: Offer competitive pricing, special promotions (e.g., extended stay discounts), and flexible cancellation policies. Target off-season travelers like remote workers or budget-conscious guests.
- Shoulder Seasons: Implement dynamic pricing that balances peak and low rates. Target weekend travelers or specific events. Offer slightly more flexible terms than peak season.
- Regularly analyze your own performance against these Barmera seasonality benchmarks and adjust your pricing and availability strategy accordingly.
Best Areas for Airbnb Investment in Barmera (2026)
Exploring the top neighborhoods for short-term rentals in Barmera? This section highlights key areas, outlining why they are attractive for hosts and guests, along with notable local attractions. Consider these locations based on your target guest profile and investment strategy.
| Neighborhood / Area | Why Host Here? (Target Guests & Appeal) | Key Attractions & Landmarks |
|---|---|---|
| Barmera Lakeside | Picturesque location beside Lake Bonney, popular for water sports and outdoor activities. Ideal for families and vacationers looking for a relaxing lakeside getaway. | Lake Bonney, Barmera Lakefront, Water sports and fishing, Picnic areas and parks, Walking trails |
| Barmera Town Center | Strategically located in the heart of Barmera, providing easy access to shopping, dining, and local amenities. Great for travelers who want to explore the local culture. | Local markets, Grocery stores, Restaurants and cafes, Nearby parks, Community events |
| Riverland Wine Region | Famous for its wineries and vineyards, the Riverland attracts wine enthusiasts and travelers seeking unique regional experiences. Perfect for wine tours and tastings. | Local wineries, Wine tours, Vineyard experiences, River views, Culinary events |
| Monash | A quieter area close to Barmera, known for its nature and parks. Ideal for guests looking for peace and nature while still being close to amenities. | Monash Adventure Park, Nature reserves, Walking and cycling trails, Picnic spots |
| Berri | Nearby town offering additional amenities and attractions, making it a good alternative for guests who want to explore the wider Riverland region. | Berri Riverfront, Local shops and restaurants, Berri Hotel, Riverland Cultural Center, Outdoor activities |
| Renmark | Another nearby town with rich history and river activities. Attracts visitors looking to explore the Murray River's charm and enjoy various water activities. | Renmark Riverfront, Murray River cruises, Historical sites, Shopping and dining options, Botanic Gardens |
| Lakeside Drive | Residential area with close proximity to the lake, providing opportunities for outdoor activities and relaxation for guests seeking nature. | Walking paths along the lake, Fishing spots, Picnic areas, Nature walks |
| Sunnydale | A tranquil suburb of Barmera, ideal for relaxation seekers and those looking for a peaceful atmosphere while still being a short drive from attractions. | Local parks, Community facilities, Quiet residential area, Nearby nature reserves |
Understanding Airbnb License Requirements & STR Laws in Barmera (2026)
While Barmera, South Australia, Australia currently shows low STR regulations, specific Airbnb license requirements might still exist or change. Always verify the latest short term rental regulations and Airbnb license requirements directly with local government authorities for Barmera to ensure full compliance before hosting.
(Source: AirROI data, 2026, finding no licensed listings among those analyzed)
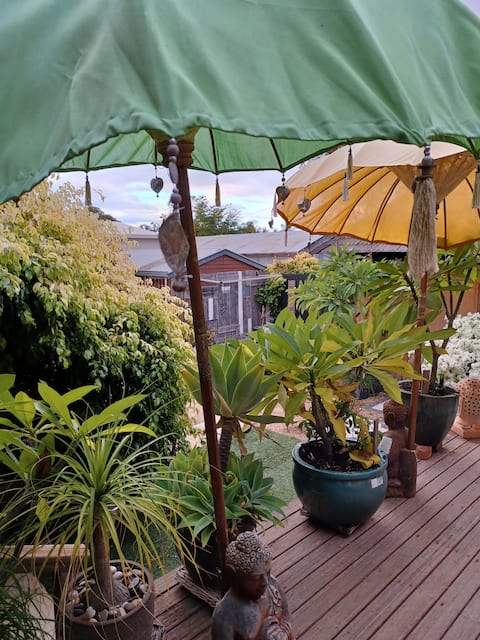
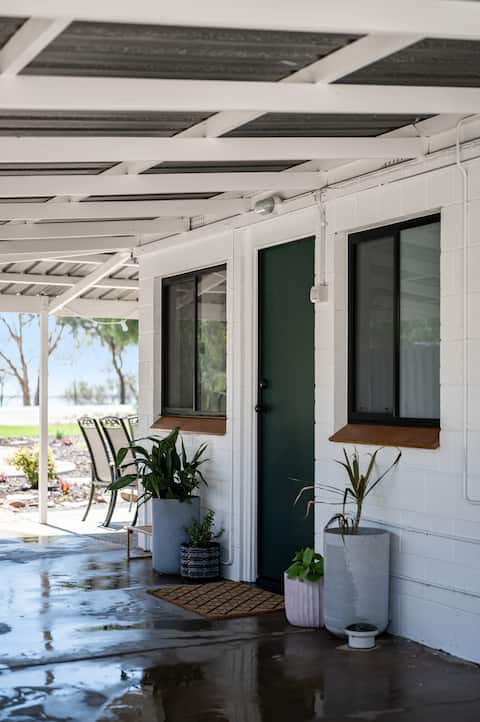
Top Performing Airbnb Properties in Barmera (2026)
Benchmark your potential! Explore examples of top-performing Airbnb properties in Barmerabased on Trailing Twelve Month (TTM) revenue. Analyze their characteristics, revenue, occupancy rate, and ADR to understand what drives success in this market.
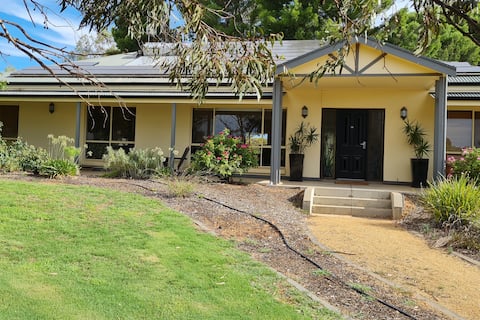
Golf Luxury Barmera, Open Plan with 4 Bedrooms
Entire Place • 4 bedrooms
Villa34
Entire Place • 2 bedrooms
Cally's Lake House | Pet Friendly with Lake Views
Entire Place • 2 bedrooms

Fairway views - golf luxury with stunning sunsets
Entire Place • 4 bedrooms
The Lake House Lake Bonney
Entire Place • 4 bedrooms
The Jetty House - Water Front Stay Riverland
Entire Place • 3 bedrooms
Note: Performance varies based on location, size, amenities, seasonality, and management quality. Data reflects the past 12 months.
Top Performing Airbnb Hosts in Barmera (2026)
Learn from the best! This table showcases top-performing Airbnb hosts in Barmera based on the number of properties managed and estimated total revenue over the past year. Analyze their scale and performance metrics.
| Host Name | Properties | Grossing Revenue | Stay Reviews | Avg Rating |
|---|---|---|---|---|
| Jo | 2 | $55,134 | 61 | 4.98/5.0 |
| Wendy | 1 | $53,817 | 81 | 4.91/5.0 |
| Jane | 1 | $52,369 | 93 | 4.91/5.0 |
| Ann | 2 | $51,063 | 127 | 4.97/5.0 |
| Daniella | 1 | $46,543 | 44 | 4.82/5.0 |
| Des | 1 | $44,456 | 11 | 5.00/5.0 |
| Tam | 1 | $35,923 | 58 | 4.66/5.0 |
| Paul And Leanne | 2 | $34,374 | 87 | 4.93/5.0 |
| Rachel | 1 | $33,684 | 258 | 4.95/5.0 |
| David | 1 | $32,136 | 74 | 4.77/5.0 |
Analyzing the strategies of top hosts, such as their property selection, pricing, and guest communication, can offer valuable lessons for optimizing your own Airbnb operations in Barmera.
Dive Deeper: Advanced Barmera STR Market Data (2026)
Ready to unlock more insights? AirROI provides access to advanced metrics and comprehensive Airbnb data for Barmera. Explore detailed analytics beyond this report to refine your investment strategy, optimize pricing, and maximize your vacation rental profits.
Explore Advanced MetricsBarmera Short-Term Rental Market Composition (2026): Property & Room Types
Room Type Distribution
Property Type Distribution
Market Composition Insights for Barmera
- The Barmera Airbnb market composition is heavily skewed towards Entire Home/Apt listings, which make up 100% of the 18 active rentals. This indicates strong guest preference for privacy and space.
- Looking at the property type distribution in Barmera, House properties are the most common (100%), reflecting the local real estate landscape.
- Houses represent a significant 100% portion, catering likely to families or larger groups.
Barmera Airbnb Room Capacity Analysis (2026): Bedroom Distribution
Distribution of Listings by Number of Bedrooms
Room Capacity Insights for Barmera
- The dominant room capacity in Barmera is 2 bedrooms listings, making up 33.3% of the market. This suggests a strong demand for properties suitable for couples or solo travelers.
- Together, 2 bedrooms and 4 bedrooms properties represent 55.5% of the active Airbnb listings in Barmera, indicating a high concentration in these sizes.
- A significant 44.4% of listings offer 3+ bedrooms, catering to larger groups and families seeking more space in Barmera.
Barmera Vacation Rental Guest Capacity Trends (2026)
Distribution of Listings by Guest Capacity
Guest Capacity Insights for Barmera
- The most common guest capacity trend in Barmera vacation rentals is listings accommodating 6 guests (22.2%). This suggests the primary traveler segment is likely larger groups.
- Properties designed for 6 guests and 2 guests dominate the Barmera STR market, accounting for 44.4% of listings.
- 44.5% of properties accommodate 6+ guests, serving the market segment for larger families or group travel in Barmera.
- On average, properties in Barmera are equipped to host 5.1 guests.
Barmera Airbnb Booking Patterns (2026): Available vs. Booked Days
Available Days Distribution
Booked Days Distribution
Booking Pattern Insights for Barmera
- The most common availability pattern in Barmera falls within the 181-270 days range, representing 50% of listings. This suggests many properties have significant open periods on their calendars.
- Approximately 61.1% of listings show high availability (181+ days open annually), indicating potential for increased bookings or specific owner usage patterns.
- For booked days, the 91-180 days range is most frequent in Barmera (50%), reflecting common guest stay durations or potential owner blocking patterns.
- A notable 38.9% of properties secure long booking periods (181+ days booked per year), highlighting successful long-term rental strategies or significant owner usage.
Barmera Airbnb Minimum Stay Requirements Analysis
Distribution of Listings by Minimum Night Requirement
1 Night
3 listings
16.7% of total
2 Nights
13 listings
72.2% of total
30+ Nights
2 listings
11.1% of total
Key Insights
- The most prevalent minimum stay requirement in Barmera is 2 Nights, adopted by 72.2% of listings. This highlights the market's preference for shorter, flexible bookings.
- A strong majority (88.9%) of the Barmera Airbnb data shows acceptance of very short stays (1-2 nights), indicating a dynamic, high-turnover market.
- A significant segment (11.1%) caters to monthly stays (30+ nights) in Barmera, pointing to opportunities in the extended-stay market.
Recommendations
- Align with the market by considering a 2 Nights minimum stay, as 72.2% of Barmera hosts use this setting.
- If feasible, allowing 1-night stays, especially midweek or during low season, could capture last-minute bookings, as only 16.7% currently do.
- A 2-night minimum appears standard (72.2%). Consider this for weekends or peak periods.
- Explore offering discounts for stays of 30+ nights to attract the 11.1% of the market seeking extended stays.
- Adjust minimum nights based on seasonality – potentially shorter during low season and longer during peak demand periods in Barmera.
Barmera Airbnb Cancellation Policy Trends Analysis (2026)
Flexible
5 listings
27.8% of total
Moderate
4 listings
22.2% of total
Firm
8 listings
44.4% of total
Strict
1 listings
5.6% of total
Cancellation Policy Insights for Barmera
- The prevailing Airbnb cancellation policy trend in Barmera is Firm, used by 44.4% of listings.
- There's a relatively balanced mix between guest-friendly (50.0%) and stricter (50.0%) policies, offering choices for different guest needs.
- Strict cancellation policies are quite rare (5.6%), potentially making listings with this policy less competitive unless justified by high demand or property type.
Recommendations for Hosts
- Consider adopting a Firm policy to align with the 44.4% market standard in Barmera.
- Using a Strict policy might deter some guests, as only 5.6% of listings use it. Evaluate if potential revenue protection outweighs possible lower booking rates.
- Regularly review your cancellation policy against competitors and market demand shifts in Barmera.
Barmera STR Booking Lead Time Analysis (2026)
Average Booking Lead Time by Month
Booking Lead Time Insights for Barmera
- The overall average booking lead time for vacation rentals in Barmera is 73 days.
- Guests book furthest in advance for stays during January (average 122 days), likely coinciding with peak travel demand or local events.
- The shortest booking windows occur for stays in May (average 33 days), indicating more last-minute travel plans during this time.
- Seasonally, Winter (92 days avg.) sees the longest lead times, while Summer (47 days avg.) has the shortest, reflecting typical travel planning cycles.
Recommendations for Hosts
- Use the overall average lead time (73 days) as a baseline for your pricing and availability strategy in Barmera.
- For January stays, consider implementing length-of-stay discounts or slightly higher rates for bookings made less than 122 days out to capitalize on advance planning.
- Target marketing efforts for the Winter season well in advance (at least 92 days) to capture early planners.
- Monitor your own booking lead times against these Barmera averages to identify opportunities for dynamic pricing adjustments.
Popular & Essential Airbnb Amenities in Barmera (2026)
Amenity Prevalence
Amenity Insights for Barmera
- Essential amenities in Barmera that guests expect include: Air conditioning, Kitchen, TV. Lacking these (any) could significantly impact bookings.
- Popular amenities like Washer, Heating, Free parking on premises are common but not universal. Offering these can provide a competitive edge.
Recommendations for Hosts
- Ensure your listing includes all essential amenities for Barmera: Air conditioning, Kitchen, TV.
- Consider adding popular differentiators like Washer or Heating to increase appeal.
- Highlight unique or less common amenities you offer (e.g., hot tub, dedicated workspace, EV charger) in your listing description and photos.
- Regularly check competitor amenities in Barmera to stay competitive.
Barmera Airbnb Guest Demographics & Profile Analysis (2026)
Guest Profile Summary for Barmera
- The typical guest profile for Airbnb in Barmera consists of primarily domestic travelers (97%), often arriving from nearby Adelaide, typically belonging to the Post-2000s (Gen Z/Alpha) group (50%), primarily speaking English or German.
- Domestic travelers account for 97.2% of guests.
- Key international markets include Australia (97.2%) and United States (1.4%).
- Top languages spoken are English (85.7%) followed by German (3.6%).
- A significant demographic segment is the Post-2000s (Gen Z/Alpha) group, representing 50% of guests.
Recommendations for Hosts
- Target domestic marketing efforts towards travelers from Adelaide and South Australia.
- Tailor amenities and listing descriptions to appeal to the dominant Post-2000s (Gen Z/Alpha) demographic (e.g., highlight fast WiFi, smart home features, local guides).
- Highlight unique local experiences or amenities relevant to the primary guest profile.
- Consider seasonal promotions aligned with peak travel times for key origin markets.
Nearby Short-Term Rental Market Comparison
How does the Barmera Airbnb market stack up against its neighbors? Compare key performance metrics like average monthly revenue, ADR, and occupancy rates in surrounding areas to understand the broader regional STR landscape.
| Market | Active Properties | Monthly Revenue | Daily Rate | Avg. Occupancy |
|---|---|---|---|---|
| White Sands | 10 | $3,491 | $253.98 | 51% |
| Angaston | 49 | $3,050 | $258.37 | 41% |
| Wellington East | 22 | $3,012 | $327.58 | 39% |
| Renmark | 16 | $2,485 | $232.75 | 41% |
| Mannum | 21 | $2,261 | $257.54 | 39% |
| Meningie | 17 | $2,049 | $214.93 | 42% |
| Murray Bridge | 16 | $1,990 | $159.81 | 54% |
| Tailem Bend | 24 | $1,955 | $179.47 | 36% |
| Paringa | 17 | $1,694 | $268.71 | 31% |