Lyndoch Airbnb Market Analysis 2026: Short Term Rental Data & Vacation Rental Statistics in South Australia, Australia
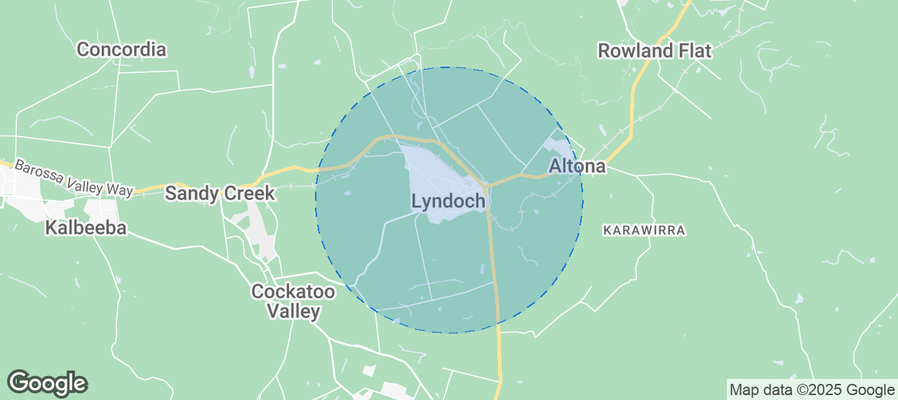
Is Airbnb profitable in Lyndoch in 2026? Explore comprehensive Airbnb analytics for Lyndoch, South Australia, Australia to uncover income potential. This 2026 STR market report for Lyndoch, based on AirROI data from February 2025 to January 2026, reveals key trends in the niche market of 22 active listings.
Whether you're considering an Airbnb investment in Lyndoch, optimizing your existing vacation rental, or exploring rental arbitrage opportunities, understanding the Lyndoch Airbnb data is crucial. Leveraging the low regulation environment is key to maximizing your short term rental income potential. Let's dive into the specifics.
Key Lyndoch Airbnb Performance Metrics Overview
Monthly Airbnb Revenue Variations & Income Potential in Lyndoch (2026)
Understanding the monthly revenue variations for Airbnb listings in Lyndoch is key to maximizing your short term rental income potential. Seasonality significantly impacts earnings. Our analysis, based on data from the past 12 months, shows that the peak revenue month for STRs in Lyndoch is typically April, while February often presents the lowest earnings, highlighting opportunities for strategic pricing adjustments during shoulder and low seasons. Explore the typical Airbnb income in Lyndoch across different performance tiers:
- Best-in-class properties (Top 10%) achieve $8,672+ monthly, often utilizing dynamic pricing and superior guest experiences.
- Strong performing properties (Top 25%) earn $5,251 or more, indicating effective management and desirable locations/amenities.
- Typical properties (Median) generate around $3,231 per month, representing the average market performance.
- Entry-level properties (Bottom 25%) see earnings around $1,965, often with potential for optimization.
Average Monthly Airbnb Earnings Trend in Lyndoch
Lyndoch Airbnb Occupancy Rate Trends (2026)
Maximize your bookings by understanding the Lyndoch STR occupancy trends. Seasonal demand shifts significantly influence how often properties are booked. Typically, Aprilsees the highest demand (peak season occupancy), while February experiences the lowest (low season). Effective strategies, like adjusting minimum stays or offering promotions, can boost occupancy during slower periods. Here's how different property tiers perform in Lyndoch:
- Best-in-class properties (Top 10%) achieve 68%+ occupancy, indicating high desirability and potentially optimized availability.
- Strong performing properties (Top 25%) maintain 55% or higher occupancy, suggesting good market fit and guest satisfaction.
- Typical properties (Median) have an occupancy rate around 36%.
- Entry-level properties (Bottom 25%) average 23% occupancy, potentially facing higher vacancy.
Average Monthly Occupancy Rate Trend in Lyndoch
Average Daily Rate (ADR) Airbnb Trends in Lyndoch (2026)
Effective short term rental pricing strategy in Lyndoch involves understanding monthly ADR fluctuations. The Average Daily Rate (ADR) for Airbnb in Lyndoch typically peaks in April and dips lowest during November. Leveraging Airbnb dynamic pricing tools or strategies based on this seasonality can significantly boost revenue. Here's a look at the typical nightly rates achieved:
- Best-in-class properties (Top 10%) command rates of $554+ per night, often due to premium features or locations.
- Strong performing properties (Top 25%) achieve nightly rates of $425 or more.
- Typical properties (Median) charge around $276 per night.
- Entry-level properties (Bottom 25%) earn around $197 per night.
Average Daily Rate (ADR) Trend by Month in Lyndoch
Get Live Lyndoch Market Intelligence 👇
Explore Real-time Analytics
Airbnb Seasonality Analysis & Trends in Lyndoch (2026)
Peak Season (April, October, March)
- Revenue averages $5,844 per month
- Occupancy rates average 49.8%
- Daily rates average $365
Shoulder Season
- Revenue averages $4,466 per month
- Occupancy maintains around 39.8%
- Daily rates hold near $368
Low Season (January, February, July)
- Revenue drops to average $3,179 per month
- Occupancy decreases to average 32.4%
- Daily rates adjust to average $362
Seasonality Insights for Lyndoch
- The Airbnb seasonality in Lyndoch shows highly seasonal trends requiring careful strategy. While the sections above show seasonal averages, it's also insightful to look at the extremes:
- During the high season, the absolute peak month showcases Lyndoch's highest earning potential, with monthly revenues capable of climbing to $6,359, occupancy reaching a high of 56.8%, and ADRs peaking at $381.
- Conversely, the slowest single month of the year, typically falling within the low season, marks the market's lowest point. In this month, revenue might dip to $2,332, occupancy could drop to 25.8%, and ADRs may adjust down to $355.
- Understanding both the seasonal averages and these monthly peaks and troughs in revenue, occupancy, and ADR is crucial for maximizing your Airbnb profit potential in Lyndoch.
Seasonal Strategies for Maximizing Profit
- Peak Season: Maximize revenue through premium pricing and potentially longer minimum stays. Ensure high availability.
- Low Season: Offer competitive pricing, special promotions (e.g., extended stay discounts), and flexible cancellation policies. Target off-season travelers like remote workers or budget-conscious guests.
- Shoulder Seasons: Implement dynamic pricing that balances peak and low rates. Target weekend travelers or specific events. Offer slightly more flexible terms than peak season.
- Regularly analyze your own performance against these Lyndoch seasonality benchmarks and adjust your pricing and availability strategy accordingly.
Best Areas for Airbnb Investment in Lyndoch (2026)
Exploring the top neighborhoods for short-term rentals in Lyndoch? This section highlights key areas, outlining why they are attractive for hosts and guests, along with notable local attractions. Consider these locations based on your target guest profile and investment strategy.
| Neighborhood / Area | Why Host Here? (Target Guests & Appeal) | Key Attractions & Landmarks |
|---|---|---|
| Lyndoch Valley | A picturesque valley known for its stunning vineyards and wineries, making it a prime location for wine enthusiasts and tourists looking for a peaceful getaway. | Barossa Valley wineries, Lyndoch Lavender Farm, Kellermeister Winery, Chateau Yaldara, Lyndoch Hill, Lyndoch Village Tours |
| Barossa Valley | Famous for its wine production, the Barossa Valley attracts tourists year-round for its beautiful landscapes and cultural experiences related to winemaking. | Jacob's Creek Visitor Centre, Seppeltsfield Winery, Penfolds Barossa Valley, Barossa Farmers Market, Barossa Valley Chocolate Company, Angaston |
| South Para Reservoir | Ideal for outdoor enthusiasts, the reservoir offers recreational activities such as hiking, biking, and fishing, attracting nature lovers and adventure seekers. | South Para Reservoir Park, Walking Trails, Fishing Spots, Picnic Areas |
| Lyndoch Village | A charming village atmosphere with historic buildings and local shops. Great for visitors looking to experience local culture and cuisine. | Historic Lyndoch Church, Local Cafes and Restaurants, Heritage Walk |
| Tanunda | Just a short drive from Lyndoch, Tanunda is a bustling town in the heart of the Barossa Valley, known for its wine culture and food scene. | Barossa Valley Brewing, Maggie Beer's Farm Shop, Tanunda Pines Golf Club |
| Norton Summit | An excellent location for those seeking stunning views and hiking trails, along with proximity to Adelaide, making it attractive for both tourists and expats. | Mount Lofty Summit, Piccadilly Valley, Adelaide Hills wineries |
| Gawler | The gateway to the Barossa region, Gawler offers historical sites and easy access to both rural and urban attractions, appealing to a diverse range of visitors. | Gawler Caravan Park, Historic Sites, Gawler Marketplace |
| Stone Well | A quiet, scenic area offering beautiful vineyard views and a relaxed atmosphere, perfect for those looking for a tranquil retreat. | Stone Well Winery, Scenic Vineyards, Culinary Experiences |
Understanding Airbnb License Requirements & STR Laws in Lyndoch (2026)
While Lyndoch, South Australia, Australia currently shows low STR regulations, specific Airbnb license requirements might still exist or change. Always verify the latest short term rental regulations and Airbnb license requirements directly with local government authorities for Lyndoch to ensure full compliance before hosting.
(Source: AirROI data, 2026, finding no licensed listings among those analyzed)
Top Performing Airbnb Properties in Lyndoch (2026)
Benchmark your potential! Explore examples of top-performing Airbnb properties in Lyndochbased on Trailing Twelve Month (TTM) revenue. Analyze their characteristics, revenue, occupancy rate, and ADR to understand what drives success in this market.
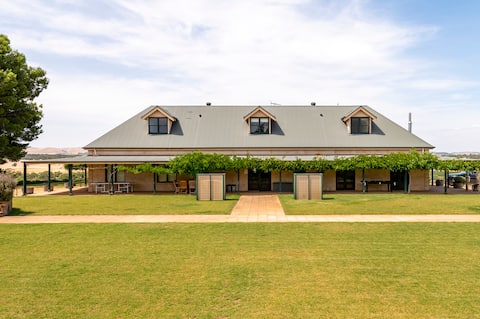
Abbotsford Country House - Magnificent Views
Entire Place • 12 bedrooms
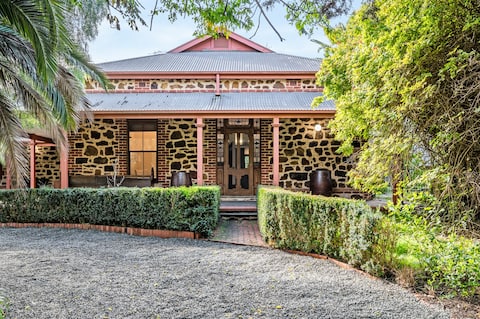
Cimicky House: SA's Finest Group Getaway
Entire Place • 4 bedrooms

Barossa Shiraz Estate The Barn
Entire Place • 2 bedrooms

Yaldara House - House next to a Chateau
Entire Place • 5 bedrooms
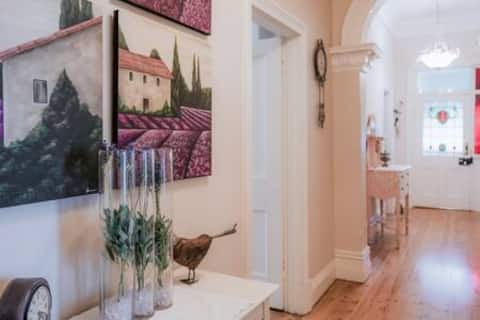
Azalea Cedar-Rose Barossa Vineyard Views Villa
Entire Place • 4 bedrooms

Norms Farm - Private Barossa Country Escape
Private Room • 4 bedrooms
Note: Performance varies based on location, size, amenities, seasonality, and management quality. Data reflects the past 12 months.
Top Performing Airbnb Hosts in Lyndoch (2026)
Learn from the best! This table showcases top-performing Airbnb hosts in Lyndoch based on the number of properties managed and estimated total revenue over the past year. Analyze their scale and performance metrics.
| Host Name | Properties | Grossing Revenue | Stay Reviews | Avg Rating |
|---|---|---|---|---|
| Julieanne | 4 | $202,041 | 86 | 5.00/5.0 |
| Andrew | 1 | $186,405 | 13 | 5.00/5.0 |
| OC Short Stays | 1 | $132,512 | 39 | 4.72/5.0 |
| Suzie | 2 | $86,995 | 149 | 4.96/5.0 |
| Nelly | 3 | $69,619 | 91 | 4.90/5.0 |
| Heather | 2 | $64,594 | 280 | 4.96/5.0 |
| Awesome | 1 | $58,449 | 33 | 4.85/5.0 |
| Billie-Jo | 1 | $51,238 | 4 | 5.00/5.0 |
| Darren | 1 | $48,024 | 44 | 5.00/5.0 |
| Mark And Fiona | 2 | $45,198 | 80 | 4.74/5.0 |
Analyzing the strategies of top hosts, such as their property selection, pricing, and guest communication, can offer valuable lessons for optimizing your own Airbnb operations in Lyndoch.
Dive Deeper: Advanced Lyndoch STR Market Data (2026)
Ready to unlock more insights? AirROI provides access to advanced metrics and comprehensive Airbnb data for Lyndoch. Explore detailed analytics beyond this report to refine your investment strategy, optimize pricing, and maximize your vacation rental profits.
Explore Advanced MetricsLyndoch Short-Term Rental Market Composition (2026): Property & Room Types
Room Type Distribution
Property Type Distribution
Market Composition Insights for Lyndoch
- The Lyndoch Airbnb market composition is heavily skewed towards Entire Home/Apt listings, which make up 95.5% of the 22 active rentals. This indicates strong guest preference for privacy and space.
- Looking at the property type distribution in Lyndoch, House properties are the most common (95.5%), reflecting the local real estate landscape.
- Houses represent a significant 95.5% portion, catering likely to families or larger groups.
- Smaller segments like hotel/boutique (combined 4.5%) offer potential for unique stay experiences.
Lyndoch Airbnb Room Capacity Analysis (2026): Bedroom Distribution
Distribution of Listings by Number of Bedrooms
Room Capacity Insights for Lyndoch
- The dominant room capacity in Lyndoch is 3 bedrooms listings, making up 31.8% of the market. This suggests a strong demand for properties suitable for families or small groups.
- Together, 3 bedrooms and 4 bedrooms properties represent 50.0% of the active Airbnb listings in Lyndoch, indicating a high concentration in these sizes.
- A significant 63.6% of listings offer 3+ bedrooms, catering to larger groups and families seeking more space in Lyndoch.
Lyndoch Vacation Rental Guest Capacity Trends (2026)
Distribution of Listings by Guest Capacity
Guest Capacity Insights for Lyndoch
- The most common guest capacity trend in Lyndoch vacation rentals is listings accommodating 8+ guests (36.4%). This suggests the primary traveler segment is likely larger groups.
- Properties designed for 8+ guests and 6 guests dominate the Lyndoch STR market, accounting for 59.1% of listings.
- 59.1% of properties accommodate 6+ guests, serving the market segment for larger families or group travel in Lyndoch.
- On average, properties in Lyndoch are equipped to host 5.6 guests.
Lyndoch Airbnb Booking Patterns (2026): Available vs. Booked Days
Available Days Distribution
Booked Days Distribution
Booking Pattern Insights for Lyndoch
- The most common availability pattern in Lyndoch falls within the 181-270 days range, representing 54.5% of listings. This suggests many properties have significant open periods on their calendars.
- Approximately 81.8% of listings show high availability (181+ days open annually), indicating potential for increased bookings or specific owner usage patterns.
- For booked days, the 91-180 days range is most frequent in Lyndoch (54.5%), reflecting common guest stay durations or potential owner blocking patterns.
- A notable 18.1% of properties secure long booking periods (181+ days booked per year), highlighting successful long-term rental strategies or significant owner usage.
Lyndoch Airbnb Minimum Stay Requirements Analysis
Distribution of Listings by Minimum Night Requirement
1 Night
4 listings
18.2% of total
2 Nights
17 listings
77.3% of total
30+ Nights
1 listings
4.5% of total
Key Insights
- The most prevalent minimum stay requirement in Lyndoch is 2 Nights, adopted by 77.3% of listings. This highlights the market's preference for shorter, flexible bookings.
- A strong majority (95.5%) of the Lyndoch Airbnb data shows acceptance of very short stays (1-2 nights), indicating a dynamic, high-turnover market.
Recommendations
- Align with the market by considering a 2 Nights minimum stay, as 77.3% of Lyndoch hosts use this setting.
- If feasible, allowing 1-night stays, especially midweek or during low season, could capture last-minute bookings, as only 18.2% currently do.
- A 2-night minimum appears standard (77.3%). Consider this for weekends or peak periods.
- Adjust minimum nights based on seasonality – potentially shorter during low season and longer during peak demand periods in Lyndoch.
Lyndoch Airbnb Cancellation Policy Trends Analysis (2026)
Limited
1 listings
4.5% of total
Flexible
6 listings
27.3% of total
Moderate
6 listings
27.3% of total
Firm
8 listings
36.4% of total
Strict
1 listings
4.5% of total
Cancellation Policy Insights for Lyndoch
- The prevailing Airbnb cancellation policy trend in Lyndoch is Firm, used by 36.4% of listings.
- There's a relatively balanced mix between guest-friendly (54.6%) and stricter (40.9%) policies, offering choices for different guest needs.
- Strict cancellation policies are quite rare (4.5%), potentially making listings with this policy less competitive unless justified by high demand or property type.
Recommendations for Hosts
- Consider adopting a Firm policy to align with the 36.4% market standard in Lyndoch.
- Using a Strict policy might deter some guests, as only 4.5% of listings use it. Evaluate if potential revenue protection outweighs possible lower booking rates.
- Regularly review your cancellation policy against competitors and market demand shifts in Lyndoch.
Lyndoch STR Booking Lead Time Analysis (2026)
Average Booking Lead Time by Month
Booking Lead Time Insights for Lyndoch
- The overall average booking lead time for vacation rentals in Lyndoch is 86 days.
- Guests book furthest in advance for stays during April (average 103 days), likely coinciding with peak travel demand or local events.
- The shortest booking windows occur for stays in July (average 61 days), indicating more last-minute travel plans during this time.
- Seasonally, Fall (91 days avg.) sees the longest lead times, while Summer (71 days avg.) has the shortest, reflecting typical travel planning cycles.
Recommendations for Hosts
- Use the overall average lead time (86 days) as a baseline for your pricing and availability strategy in Lyndoch.
- For April stays, consider implementing length-of-stay discounts or slightly higher rates for bookings made less than 103 days out to capitalize on advance planning.
- Target marketing efforts for the Fall season well in advance (at least 91 days) to capture early planners.
- Monitor your own booking lead times against these Lyndoch averages to identify opportunities for dynamic pricing adjustments.
Popular & Essential Airbnb Amenities in Lyndoch (2026)
Amenity Prevalence
No amenities with partial availability (less than 100%) were found to display in the chart. All essential amenities might be present in all listings. Check insights below.
Amenity Insights for Lyndoch
- Essential amenities in Lyndoch that guests expect include: Kitchen, Air conditioning, Heating, Refrigerator, Hair dryer, Coffee maker, Wifi, Iron, Dishes and silverware, Washer. Lacking these (any) could significantly impact bookings.
Recommendations for Hosts
- Ensure your listing includes all essential amenities for Lyndoch: Kitchen, Air conditioning, Heating, Refrigerator, Hair dryer, Coffee maker, Wifi, Iron, Dishes and silverware, Washer.
- Highlight unique or less common amenities you offer (e.g., hot tub, dedicated workspace, EV charger) in your listing description and photos.
- Regularly check competitor amenities in Lyndoch to stay competitive.
Lyndoch Airbnb Guest Demographics & Profile Analysis (2026)
Guest Profile Summary for Lyndoch
- The typical guest profile for Airbnb in Lyndoch consists of primarily domestic travelers (91%), often arriving from nearby Adelaide, typically belonging to the Post-2000s (Gen Z/Alpha) group (50%), primarily speaking English or French.
- Domestic travelers account for 90.8% of guests.
- Key international markets include Australia (90.8%) and Germany (2.3%).
- Top languages spoken are English (72.7%) followed by French (6.1%).
- A significant demographic segment is the Post-2000s (Gen Z/Alpha) group, representing 50% of guests.
Recommendations for Hosts
- Target domestic marketing efforts towards travelers from Adelaide and South Australia.
- Tailor amenities and listing descriptions to appeal to the dominant Post-2000s (Gen Z/Alpha) demographic (e.g., highlight fast WiFi, smart home features, local guides).
- Highlight unique local experiences or amenities relevant to the primary guest profile.
- Consider seasonal promotions aligned with peak travel times for key origin markets.
Nearby Short-Term Rental Market Comparison
How does the Lyndoch Airbnb market stack up against its neighbors? Compare key performance metrics like average monthly revenue, ADR, and occupancy rates in surrounding areas to understand the broader regional STR landscape.
| Market | Active Properties | Monthly Revenue | Daily Rate | Avg. Occupancy |
|---|---|---|---|---|
| Lenswood | 11 | $5,799 | $292.82 | 67% |
| Middle River | 20 | $4,462 | $392.49 | 50% |
| Myponga Beach | 10 | $3,949 | $437.11 | 38% |
| Nuriootpa | 20 | $3,876 | $326.60 | 43% |
| White Sands | 10 | $3,491 | $253.98 | 51% |
| Tanunda | 86 | $3,400 | $270.56 | 45% |
| Light Regional Council | 17 | $3,330 | $309.28 | 41% |
| Stirling | 43 | $3,195 | $296.40 | 43% |
| Hahndorf | 47 | $3,067 | $226.59 | 50% |
| Angaston | 49 | $3,050 | $258.37 | 41% |