Paringa Airbnb Market Analysis 2025: Short Term Rental Data & Vacation Rental Statistics in South Australia, Australia
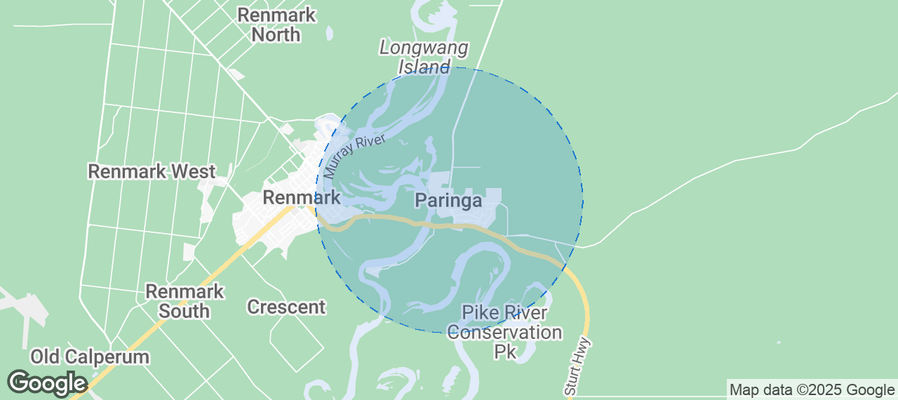
Is Airbnb profitable in Paringa in 2025? Explore comprehensive Airbnb analytics for Paringa, South Australia, Australia to uncover income potential. This 2025 STR market report for Paringa, based on AirROI data from November 2024 to October 2025, reveals key trends in the niche market of 17 active listings.
Whether you're considering an Airbnb investment in Paringa, optimizing your existing vacation rental, or exploring rental arbitrage opportunities, understanding the Paringa Airbnb data is crucial. Leveraging the low regulation environment is key to maximizing your short term rental income potential. Let's dive into the specifics.
Key Paringa Airbnb Performance Metrics Overview
Monthly Airbnb Revenue Variations & Income Potential in Paringa (2025)
Understanding the monthly revenue variations for Airbnb listings in Paringa is key to maximizing your short term rental income potential. Seasonality significantly impacts earnings. Our analysis, based on data from the past 12 months, shows that the peak revenue month for STRs in Paringa is typically December, while September often presents the lowest earnings, highlighting opportunities for strategic pricing adjustments during shoulder and low seasons. Explore the typical Airbnb income in Paringa across different performance tiers:
- Best-in-class properties (Top 10%) achieve $5,051+ monthly, often utilizing dynamic pricing and superior guest experiences.
- Strong performing properties (Top 25%) earn $3,414 or more, indicating effective management and desirable locations/amenities.
- Typical properties (Median) generate around $1,576 per month, representing the average market performance.
- Entry-level properties (Bottom 25%) see earnings around $911, often with potential for optimization.
Average Monthly Airbnb Earnings Trend in Paringa
Paringa Airbnb Occupancy Rate Trends (2025)
Maximize your bookings by understanding the Paringa STR occupancy trends. Seasonal demand shifts significantly influence how often properties are booked. Typically, Aprilsees the highest demand (peak season occupancy), while February experiences the lowest (low season). Effective strategies, like adjusting minimum stays or offering promotions, can boost occupancy during slower periods. Here's how different property tiers perform in Paringa:
- Best-in-class properties (Top 10%) achieve 65%+ occupancy, indicating high desirability and potentially optimized availability.
- Strong performing properties (Top 25%) maintain 43% or higher occupancy, suggesting good market fit and guest satisfaction.
- Typical properties (Median) have an occupancy rate around 23%.
- Entry-level properties (Bottom 25%) average 13% occupancy, potentially facing higher vacancy.
Average Monthly Occupancy Rate Trend in Paringa
Average Daily Rate (ADR) Airbnb Trends in Paringa (2025)
Effective short term rental pricing strategy in Paringa involves understanding monthly ADR fluctuations. The Average Daily Rate (ADR) for Airbnb in Paringa typically peaks in December and dips lowest during August. Leveraging Airbnb dynamic pricing tools or strategies based on this seasonality can significantly boost revenue. Here's a look at the typical nightly rates achieved:
- Best-in-class properties (Top 10%) command rates of $854+ per night, often due to premium features or locations.
- Strong performing properties (Top 25%) achieve nightly rates of $294 or more.
- Typical properties (Median) charge around $217 per night.
- Entry-level properties (Bottom 25%) earn around $117 per night.
Average Daily Rate (ADR) Trend by Month in Paringa
Get Live Paringa Market Intelligence 👇
Explore Real-time Analytics
Airbnb Seasonality Analysis & Trends in Paringa (2025)
Peak Season (December, January, May)
- Revenue averages $3,217 per month
- Occupancy rates average 37.2%
- Daily rates average $285
Shoulder Season
- Revenue averages $2,430 per month
- Occupancy maintains around 31.0%
- Daily rates hold near $271
Low Season (February, June, September)
- Revenue drops to average $1,551 per month
- Occupancy decreases to average 24.0%
- Daily rates adjust to average $270
Seasonality Insights for Paringa
- The Airbnb seasonality in Paringa shows highly seasonal trends requiring careful strategy. While the sections above show seasonal averages, it's also insightful to look at the extremes:
- During the high season, the absolute peak month showcases Paringa's highest earning potential, with monthly revenues capable of climbing to $3,467, occupancy reaching a high of 41.9%, and ADRs peaking at $290.
- Conversely, the slowest single month of the year, typically falling within the low season, marks the market's lowest point. In this month, revenue might dip to $1,362, occupancy could drop to 21.7%, and ADRs may adjust down to $261.
- Understanding both the seasonal averages and these monthly peaks and troughs in revenue, occupancy, and ADR is crucial for maximizing your Airbnb profit potential in Paringa.
Seasonal Strategies for Maximizing Profit
- Peak Season: Maximize revenue through premium pricing and potentially longer minimum stays. Ensure high availability.
- Low Season: Offer competitive pricing, special promotions (e.g., extended stay discounts), and flexible cancellation policies. Target off-season travelers like remote workers or budget-conscious guests.
- Shoulder Seasons: Implement dynamic pricing that balances peak and low rates. Target weekend travelers or specific events. Offer slightly more flexible terms than peak season.
- Regularly analyze your own performance against these Paringa seasonality benchmarks and adjust your pricing and availability strategy accordingly.
Best Areas for Airbnb Investment in Paringa (2025)
Exploring the top neighborhoods for short-term rentals in Paringa? This section highlights key areas, outlining why they are attractive for hosts and guests, along with notable local attractions. Consider these locations based on your target guest profile and investment strategy.
| Neighborhood / Area | Why Host Here? (Target Guests & Appeal) | Key Attractions & Landmarks |
|---|---|---|
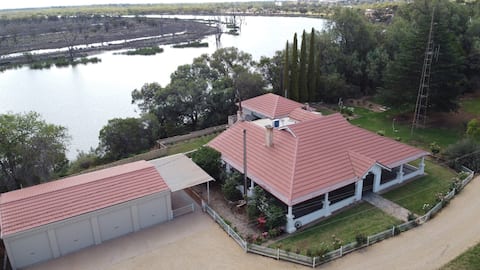
| Paringa Riverfront | Scenic location along the Murray River, perfect for nature lovers and those seeking a tranquil getaway. Attracts travelers interested in fishing, boating, and relaxing by the river. | Murray River, Riverland Wine Region, Berri and Barmera, Katarapko Creek, Loxton Historical Village |
| Nearby Renmark | Close to Paringa, Renmark offers a vibrant shopping and dining scene while still being close to natural attractions. Ideal for families and those wanting more amenities. | Renmark Riverfront, Chowilla Game Reserve, Renmark Paringa Council, Renmark Hotel, Local markets |
| Coorong National Park | A picturesque national park known for its wetlands and diverse wildlife, attracting eco-tourists and outdoor enthusiasts. | Coorong Lagoon, Birdwatching opportunities, Scenic hiking trails, Fishing spots, Historical sites |
| Riverland National Park | Another stunning natural area, great for camping and exploring the outdoors. Popular with nature lovers and those looking for adventure activities. | Walking trails, Wildlife spotting, Camping areas, Fishing and kayaking spots, Riverside picnic areas |
| Local Wineries | The Riverland region is known for its vineyards and wineries, attracting wine enthusiasts and tourists looking for wine tasting experiences. | Riverland wineries, Wine tours, Local vineyards, Wine tasting events, Gourmet food experiences |
| Paringa Historic Sites | Rich in history and heritage, Paringa and its surroundings offer historical attractions for those interested in cultural tourism. | Historic Paringa Bridge, Loxton Historical Society, Local museums, Heritage gardens, Cultural events |
| Murray-Darling Basin | A region known for its rich biodiversity and cultural heritage, appealing to travelers interested in nature and Indigenous culture. | Murray-Darling river system, Nature reserves, Cultural tours, Biodiversity experiences, Agricultural tours |
| Berri | A nearby town with a growing tourism infrastructure, offering good amenities and close access to the Riverland's attractions. | Berri Resort Hotel, Riverland Cultural Centre, Berri's Riverfront, Local shopping areas, Parks and recreational spaces |
Understanding Airbnb License Requirements & STR Laws in Paringa (2025)
While Paringa, South Australia, Australia currently shows low STR regulations, specific Airbnb license requirements might still exist or change. Always verify the latest short term rental regulations and Airbnb license requirements directly with local government authorities for Paringa to ensure full compliance before hosting.
(Source: AirROI data, 2025, finding no licensed listings among those analyzed)
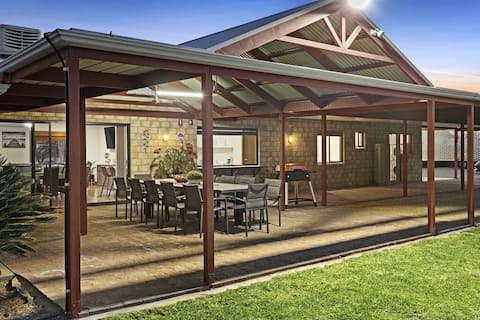
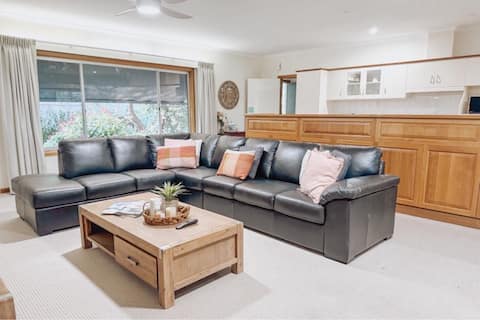
Top Performing Airbnb Properties in Paringa (2025)
Benchmark your potential! Explore examples of top-performing Airbnb properties in Paringabased on Trailing Twelve Month (TTM) revenue. Analyze their characteristics, revenue, occupancy rate, and ADR to understand what drives success in this market.

Warwilla Cliff Home
Entire Place • 4 bedrooms
THE SHAMROCK LUXURY RETREAT
Entire Place • 4 bedrooms
Paringa Riverview Resort
Entire Place • 4 bedrooms
Mundic Homestead - Water Views, Large Private Home
Entire Place • 4 bedrooms

The Frames Luxury Accommodation- Pastiche Retreat
Entire Place • 1 bedroom
The Frames Luxury Accommodation- Collage Retreat
Entire Place • 2 bedrooms
Note: Performance varies based on location, size, amenities, seasonality, and management quality. Data reflects the past 12 months.
Top Performing Airbnb Hosts in Paringa (2025)
Learn from the best! This table showcases top-performing Airbnb hosts in Paringa based on the number of properties managed and estimated total revenue over the past year. Analyze their scale and performance metrics.
| Host Name | Properties | Grossing Revenue | Stay Reviews | Avg Rating |
|---|---|---|---|---|
| Amalia | 1 | $70,357 | 22 | 5.00/5.0 |
| Sally | 3 | $65,523 | 111 | 4.71/5.0 |
| Cathy | 2 | $55,332 | 2 | Not Rated |
| Sally | 1 | $40,937 | 89 | 4.98/5.0 |
| Kristen | 1 | $36,119 | 7 | 5.00/5.0 |
| Leanne | 4 | $31,962 | 149 | 4.84/5.0 |
| Jan | 2 | $29,553 | 425 | 4.84/5.0 |
| Mandy | 1 | $19,636 | 134 | 4.87/5.0 |
| Ravinder | 1 | $1,711 | 2 | Not Rated |
| Jarrad | 1 | $621 | 49 | 4.41/5.0 |
Analyzing the strategies of top hosts, such as their property selection, pricing, and guest communication, can offer valuable lessons for optimizing your own Airbnb operations in Paringa.
Dive Deeper: Advanced Paringa STR Market Data (2025)
Ready to unlock more insights? AirROI provides access to advanced metrics and comprehensive Airbnb data for Paringa. Explore detailed analytics beyond this report to refine your investment strategy, optimize pricing, and maximize your vacation rental profits.
Explore Advanced MetricsParinga Short-Term Rental Market Composition (2025): Property & Room Types
Room Type Distribution
Property Type Distribution
Market Composition Insights for Paringa
- The Paringa Airbnb market composition is heavily skewed towards Entire Home/Apt listings, which make up 94.1% of the 17 active rentals. This indicates strong guest preference for privacy and space.
- Looking at the property type distribution in Paringa, House properties are the most common (58.8%), reflecting the local real estate landscape.
- Houses represent a significant 58.8% portion, catering likely to families or larger groups.
- The presence of 11.8% Hotel/Boutique listings indicates integration with traditional hospitality.
Paringa Airbnb Room Capacity Analysis (2025): Bedroom Distribution
Distribution of Listings by Number of Bedrooms
Room Capacity Insights for Paringa
- The dominant room capacity in Paringa is 2 bedrooms listings, making up 29.4% of the market. This suggests a strong demand for properties suitable for couples or solo travelers.
- Together, 2 bedrooms and 4 bedrooms properties represent 58.8% of the active Airbnb listings in Paringa, indicating a high concentration in these sizes.
- A significant 47.0% of listings offer 3+ bedrooms, catering to larger groups and families seeking more space in Paringa.
Paringa Vacation Rental Guest Capacity Trends (2025)
Distribution of Listings by Guest Capacity
Guest Capacity Insights for Paringa
- The most common guest capacity trend in Paringa vacation rentals is listings accommodating 8+ guests (35.3%). This suggests the primary traveler segment is likely larger groups.
- Properties designed for 8+ guests and 4 guests dominate the Paringa STR market, accounting for 70.6% of listings.
- 41.2% of properties accommodate 6+ guests, serving the market segment for larger families or group travel in Paringa.
- On average, properties in Paringa are equipped to host 5.4 guests.
Paringa Airbnb Booking Patterns (2025): Available vs. Booked Days
Available Days Distribution
Booked Days Distribution
Booking Pattern Insights for Paringa
- The most common availability pattern in Paringa falls within the 271-366 days range, representing 64.7% of listings. This suggests many properties have significant open periods on their calendars.
- Approximately 88.2% of listings show high availability (181+ days open annually), indicating potential for increased bookings or specific owner usage patterns.
- For booked days, the 31-90 days range is most frequent in Paringa (35.3%), reflecting common guest stay durations or potential owner blocking patterns.
- A notable 11.8% of properties secure long booking periods (181+ days booked per year), highlighting successful long-term rental strategies or significant owner usage.
Paringa Airbnb Minimum Stay Requirements Analysis
Distribution of Listings by Minimum Night Requirement
1 Night
3 listings
17.6% of total
2 Nights
6 listings
35.3% of total
30+ Nights
8 listings
47.1% of total
Key Insights
- The most prevalent minimum stay requirement in Paringa is 30+ Nights, adopted by 47.1% of listings. This highlights the market's preference for longer commitments.
- A significant segment (47.1%) caters to monthly stays (30+ nights) in Paringa, pointing to opportunities in the extended-stay market.
Recommendations
- Align with the market by considering a 30+ Nights minimum stay, as 47.1% of Paringa hosts use this setting.
- If feasible, allowing 1-night stays, especially midweek or during low season, could capture last-minute bookings, as only 17.6% currently do.
- A 2-night minimum appears standard (35.3%). Consider this for weekends or peak periods.
- Explore offering discounts for stays of 30+ nights to attract the 47.1% of the market seeking extended stays.
- Adjust minimum nights based on seasonality – potentially shorter during low season and longer during peak demand periods in Paringa.
Paringa Airbnb Cancellation Policy Trends Analysis (2025)
Flexible
2 listings
11.8% of total
Moderate
8 listings
47.1% of total
Firm
5 listings
29.4% of total
Strict
2 listings
11.8% of total
Cancellation Policy Insights for Paringa
- The prevailing Airbnb cancellation policy trend in Paringa is Moderate, used by 47.1% of listings.
- There's a relatively balanced mix between guest-friendly (58.9%) and stricter (41.2%) policies, offering choices for different guest needs.
Recommendations for Hosts
- Consider adopting a Moderate policy to align with the 47.1% market standard in Paringa.
- Using a Strict policy might deter some guests, as only 11.8% of listings use it. Evaluate if potential revenue protection outweighs possible lower booking rates.
- Regularly review your cancellation policy against competitors and market demand shifts in Paringa.
Paringa STR Booking Lead Time Analysis (2025)
Average Booking Lead Time by Month
Booking Lead Time Insights for Paringa
- The overall average booking lead time for vacation rentals in Paringa is 82 days.
- Guests book furthest in advance for stays during April (average 121 days), likely coinciding with peak travel demand or local events.
- The shortest booking windows occur for stays in July (average 32 days), indicating more last-minute travel plans during this time.
- Seasonally, Spring (86 days avg.) sees the longest lead times, while Summer (47 days avg.) has the shortest, reflecting typical travel planning cycles.
Recommendations for Hosts
- Use the overall average lead time (82 days) as a baseline for your pricing and availability strategy in Paringa.
- For April stays, consider implementing length-of-stay discounts or slightly higher rates for bookings made less than 121 days out to capitalize on advance planning.
- Target marketing efforts for the Spring season well in advance (at least 86 days) to capture early planners.
- Monitor your own booking lead times against these Paringa averages to identify opportunities for dynamic pricing adjustments.
Popular & Essential Airbnb Amenities in Paringa (2025)
Amenity Prevalence
Amenity Insights for Paringa
- Essential amenities in Paringa that guests expect include: Air conditioning, Free parking on premises, TV. Lacking these (any) could significantly impact bookings.
- Popular amenities like Smoke alarm, Microwave, Heating are common but not universal. Offering these can provide a competitive edge.
Recommendations for Hosts
- Ensure your listing includes all essential amenities for Paringa: Air conditioning, Free parking on premises, TV.
- Consider adding popular differentiators like Smoke alarm or Microwave to increase appeal.
- Highlight unique or less common amenities you offer (e.g., hot tub, dedicated workspace, EV charger) in your listing description and photos.
- Regularly check competitor amenities in Paringa to stay competitive.
Paringa Airbnb Guest Demographics & Profile Analysis (2025)
Guest Profile Summary for Paringa
- The typical guest profile for Airbnb in Paringa consists of primarily domestic travelers (95%), often arriving from nearby Adelaide, typically belonging to the Post-2000s (Gen Z/Alpha) group (50%), primarily speaking English or Spanish.
- Domestic travelers account for 94.9% of guests.
- Key international markets include Australia (94.9%) and Singapore (1.3%).
- Top languages spoken are English (74.3%) followed by Spanish (8.6%).
- A significant demographic segment is the Post-2000s (Gen Z/Alpha) group, representing 50% of guests.
Recommendations for Hosts
- Target domestic marketing efforts towards travelers from Adelaide and South Australia.
- Tailor amenities and listing descriptions to appeal to the dominant Post-2000s (Gen Z/Alpha) demographic (e.g., highlight fast WiFi, smart home features, local guides).
- Highlight unique local experiences or amenities relevant to the primary guest profile.
- Consider seasonal promotions aligned with peak travel times for key origin markets.
Nearby Short-Term Rental Market Comparison
How does the Paringa Airbnb market stack up against its neighbors? Compare key performance metrics like average monthly revenue, ADR, and occupancy rates in surrounding areas to understand the broader regional STR landscape.
| Market | Active Properties | Monthly Revenue | Daily Rate | Avg. Occupancy |
|---|---|---|---|---|
| White Sands | 10 | $3,533 | $270.26 | 49% |
| Angaston | 48 | $3,300 | $278.63 | 42% |
| Wellington East | 21 | $2,912 | $344.75 | 35% |
| Renmark | 16 | $2,865 | $240.87 | 44% |
| Mannum | 19 | $2,559 | $263.84 | 41% |
| Barmera | 17 | $2,380 | $165.86 | 49% |
| Tailem Bend | 21 | $2,296 | $172.18 | 39% |
| Murray Bridge | 16 | $2,204 | $156.46 | 55% |
| Meningie | 17 | $2,015 | $216.11 | 39% |