Quorn Airbnb Market Analysis 2026: Short Term Rental Data & Vacation Rental Statistics in South Australia, Australia
Is Airbnb profitable in Quorn in 2026? Explore comprehensive Airbnb analytics for Quorn, South Australia, Australia to uncover income potential. This 2026 STR market report for Quorn, based on AirROI data from May 2024 to April 2025, reveals key trends in the niche market of 17 active listings.
Whether you're considering an Airbnb investment in Quorn, optimizing your existing vacation rental, or exploring rental arbitrage opportunities, understanding the Quorn Airbnb data is crucial. Leveraging the low regulation environment is key to maximizing your short term rental income potential. Let's dive into the specifics.
Key Quorn Airbnb Performance Metrics Overview
Monthly Airbnb Revenue Variations & Income Potential in Quorn (2026)
Understanding the monthly revenue variations for Airbnb listings in Quorn is key to maximizing your short term rental income potential. Seasonality significantly impacts earnings. Our analysis, based on data from the past 12 months, shows that the peak revenue month for STRs in Quorn is typically May, while February often presents the lowest earnings, highlighting opportunities for strategic pricing adjustments during shoulder and low seasons. Explore the typical Airbnb income in Quorn across different performance tiers:
- Best-in-class properties (Top 10%) achieve $1,783+ monthly, often utilizing dynamic pricing and superior guest experiences.
- Strong performing properties (Top 25%) earn $899 or more, indicating effective management and desirable locations/amenities.
- Typical properties (Median) generate around $577 per month, representing the average market performance.
- Entry-level properties (Bottom 25%) see earnings around $438, often with potential for optimization.
Average Monthly Airbnb Earnings Trend in Quorn
Quorn Airbnb Occupancy Rate Trends (2026)
Maximize your bookings by understanding the Quorn STR occupancy trends. Seasonal demand shifts significantly influence how often properties are booked. Typically, Maysees the highest demand (peak season occupancy), while February experiences the lowest (low season). Effective strategies, like adjusting minimum stays or offering promotions, can boost occupancy during slower periods. Here's how different property tiers perform in Quorn:
- Best-in-class properties (Top 10%) achieve 41%+ occupancy, indicating high desirability and potentially optimized availability.
- Strong performing properties (Top 25%) maintain 33% or higher occupancy, suggesting good market fit and guest satisfaction.
- Typical properties (Median) have an occupancy rate around 21%.
- Entry-level properties (Bottom 25%) average 15% occupancy, potentially facing higher vacancy.
Average Monthly Occupancy Rate Trend in Quorn
Average Daily Rate (ADR) Airbnb Trends in Quorn (2026)
Effective short term rental pricing strategy in Quorn involves understanding monthly ADR fluctuations. The Average Daily Rate (ADR) for Airbnb in Quorn typically peaks in December and dips lowest during September. Leveraging Airbnb dynamic pricing tools or strategies based on this seasonality can significantly boost revenue. Here's a look at the typical nightly rates achieved:
- Best-in-class properties (Top 10%) command rates of $121+ per night, often due to premium features or locations.
- Strong performing properties (Top 25%) achieve nightly rates of $94 or more.
- Typical properties (Median) charge around $78 per night.
- Entry-level properties (Bottom 25%) earn around $54 per night.
Average Daily Rate (ADR) Trend by Month in Quorn
Get Live Quorn Market Intelligence 👇

Explore Real-time Analytics
Airbnb Seasonality Analysis & Trends in Quorn (2025)
Peak Season (May, July, June)
- Revenue averages $1,322 per month
- Occupancy rates average 38.8%
- Daily rates average $80
Shoulder Season
- Revenue averages $890 per month
- Occupancy maintains around 26.1%
- Daily rates hold near $84
Low Season (February, March, December)
- Revenue drops to average $355 per month
- Occupancy decreases to average 11.9%
- Daily rates adjust to average $92
Seasonality Insights for Quorn
- The Airbnb seasonality in Quorn shows highly seasonal trends requiring careful strategy. While the sections above show seasonal averages, it's also insightful to look at the extremes:
- During the high season, the absolute peak month showcases Quorn's highest earning potential, with monthly revenues capable of climbing to $1,592, occupancy reaching a high of 55.6%, and ADRs peaking at $94.
- Conversely, the slowest single month of the year, typically falling within the low season, marks the market's lowest point. In this month, revenue might dip to $204, occupancy could drop to 8.7%, and ADRs may adjust down to $79.
- Understanding both the seasonal averages and these monthly peaks and troughs in revenue, occupancy, and ADR is crucial for maximizing your Airbnb profit potential in Quorn.
Seasonal Strategies for Maximizing Profit
- Peak Season: Maximize revenue through premium pricing and potentially longer minimum stays. Ensure high availability.
- Low Season: Offer competitive pricing, special promotions (e.g., extended stay discounts), and flexible cancellation policies. Target off-season travelers like remote workers or budget-conscious guests.
- Shoulder Seasons: Implement dynamic pricing that balances peak and low rates. Target weekend travelers or specific events. Offer slightly more flexible terms than peak season.
- Regularly analyze your own performance against these Quorn seasonality benchmarks and adjust your pricing and availability strategy accordingly.
Best Areas for Airbnb Investment in Quorn (2026)
Exploring the top neighborhoods for short-term rentals in Quorn? This section highlights key areas, outlining why they are attractive for hosts and guests, along with notable local attractions. Consider these locations based on your target guest profile and investment strategy.
| Neighborhood / Area | Why Host Here? (Target Guests & Appeal) | Key Attractions & Landmarks |
|---|---|---|
| Quorn Town Centre | The heart of Quorn, filled with charming heritage buildings and local shops. A great base for visitors exploring the Flinders Ranges and the famous Pichi Richi Railway. | Flinders Ranges National Park, Pichi Richi Railway, Quorn Heritage Walk, Quorn Railway Station, Mount Brown Lookout |
| Flinders Ranges | A stunning mountain range offering breathtaking views and nature experiences. It's popular with hikers, photographers, and adventure seekers. | Wilpena Pound, Brachina Gorge, Skytrek, Quorn Historical Society, Stuart Range |
| Woolshed Restaurant | A unique dining experience in a converted shearing shed, attracting visitors for its local food and rich history. Ideal for guests wanting to enjoy local cuisine. | Woolshed Restaurant, Quorn Historical Walks, Nature walks, Local Wine Tasting |
| Pichi Richi Pass | A scenic pass that provides access to various hiking trails and breathtaking views. Highly sought after for outdoor enthusiasts and nature lovers. | Pichi Richi Pass, Historical Trains, Flinders Ranges Hikes, Scenic Lookouts |
| Kanyaka Homestead | An old pastoral station that offers a glimpse into South Australia's pastoral history. It attracts history buffs and photographers. | Kanyaka Homestead Ruins, Historical Walks, Local Wildlife, Scenic Views |
| Coonatto Farmstay | A working farm that offers guests a unique experience of rural life in the Flinders Ranges. Great for families and travelers looking for authentic farm experiences. | Farm Tours, Bushwalking, Wildlife Spotting, Stargazing |
| Hawker | A small town close to the Flinders Ranges, serving as a gateway for visitors. It's known for its art galleries and scenic landscapes. | Hawker Gallery, Flinders Ranges National Park Access, Local Crafts, Scenic Drives |
| Cradock | A quiet, historical village that provides an authentic experience of rural South Australia. Perfect for guests looking for peace and solitude amidst nature. | Cradock Historic Sites, Marble Range, Local Walks, Nature Retreats |
Understanding Airbnb License Requirements & STR Laws in Quorn (2026)
While Quorn, South Australia, Australia currently shows low STR regulations, specific Airbnb license requirements might still exist or change. Always verify the latest short term rental regulations and Airbnb license requirements directly with local government authorities for Quorn to ensure full compliance before hosting.
(Source: AirROI data, 2026, finding no licensed listings among those analyzed)
Top Performing Airbnb Properties in Quorn (2026)
Benchmark your potential! Explore examples of top-performing Airbnb properties in Quornbased on Trailing Twelve Month (TTM) revenue. Analyze their characteristics, revenue, occupancy rate, and ADR to understand what drives success in this market.
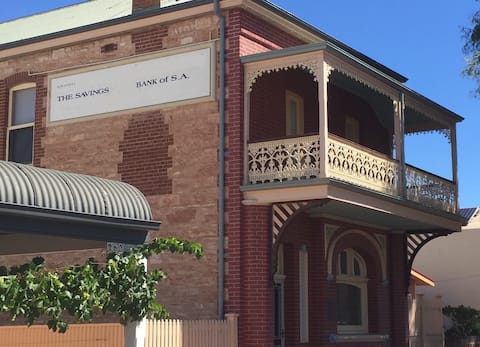
Historic Bank built in 1895, in centre of Quorn
Entire Place • 3 bedrooms
Birdsong Gardens
Private Room • 2 bedrooms
The Quorn-er House --
Entire Place • 3 bedrooms

Shearers Quarters - Dutchmans Stern
Entire Place • 3 bedrooms
Room 4 | Austral Inn | Quorn
Private Room • 1 bedroom
Room 3 | Austral Inn | Quorn
Private Room • 1 bedroom
Note: Performance varies based on location, size, amenities, seasonality, and management quality. Data reflects the past 12 months.
Top Performing Airbnb Hosts in Quorn (2026)
Learn from the best! This table showcases top-performing Airbnb hosts in Quorn based on the number of properties managed and estimated total revenue over the past year. Analyze their scale and performance metrics.
| Host Name | Properties | Grossing Revenue | Stay Reviews | Avg Rating |
|---|---|---|---|---|
| Host #129383698 | 11 | $36,960 | 1 | 0.00/5.0 |
| Vicki | 1 | $26,151 | 62 | 4.77/5.0 |
| Clarinda | 1 | $12,464 | 16 | 4.94/5.0 |
| Margaret | 1 | $11,417 | 124 | 4.90/5.0 |
| National Parks Wildlife Servic | 1 | $10,228 | 8 | 4.75/5.0 |
| Host #442827672 | 1 | $2,957 | 32 | 5.00/5.0 |
| Benjamin | 1 | $641 | 21 | 4.76/5.0 |
Analyzing the strategies of top hosts, such as their property selection, pricing, and guest communication, can offer valuable lessons for optimizing your own Airbnb operations in Quorn.
Dive Deeper: Advanced Quorn STR Market Data (2026)
Ready to unlock more insights? AirROI provides access to advanced metrics and comprehensive Airbnb data for Quorn. Explore detailed analytics beyond this report to refine your investment strategy, optimize pricing, and maximize your vacation rental profits.
Explore Advanced MetricsQuorn Short-Term Rental Market Composition (2026): Property & Room Types
Room Type Distribution
Property Type Distribution
Market Composition Insights for Quorn
- The Quorn Airbnb market composition is heavily skewed towards Private Room listings, which make up 76.5% of the 17 active rentals. This indicates strong guest preference for privacy and space.
- Looking at the property type distribution in Quorn, Hotel/Boutique properties are the most common (64.7%), reflecting the local real estate landscape.
- Houses represent a significant 35.3% portion, catering likely to families or larger groups.
- The presence of 64.7% Hotel/Boutique listings indicates integration with traditional hospitality.
Quorn Airbnb Room Capacity Analysis (2026): Bedroom Distribution
Distribution of Listings by Number of Bedrooms
Room Capacity Insights for Quorn
- The dominant room capacity in Quorn is 1 bedroom listings, making up 70.6% of the market. This suggests a strong demand for properties suitable for couples or solo travelers.
- Together, 1 bedroom and 3 bedrooms properties represent 94.1% of the active Airbnb listings in Quorn, indicating a high concentration in these sizes.
- With over half the market (70.6%) consisting of studios or 1-bedroom units, Quorn is particularly well-suited for individuals or couples.
- A significant 23.5% of listings offer 3+ bedrooms, catering to larger groups and families seeking more space in Quorn.
Quorn Vacation Rental Guest Capacity Trends (2026)
Distribution of Listings by Guest Capacity
Guest Capacity Insights for Quorn
- The most common guest capacity trend in Quorn vacation rentals is listings accommodating 4 guests (29.4%). This suggests the primary traveler segment is likely small families or groups.
- Properties designed for 4 guests and 2 guests dominate the Quorn STR market, accounting for 58.8% of listings.
- 17.7% of properties accommodate 6+ guests, serving the market segment for larger families or group travel in Quorn.
- On average, properties in Quorn are equipped to host 3.7 guests.
Quorn Airbnb Booking Patterns (2026): Available vs. Booked Days
Available Days Distribution
Booked Days Distribution
Booking Pattern Insights for Quorn
- The most common availability pattern in Quorn falls within the 271-366 days range, representing 82.4% of listings. This suggests many properties have significant open periods on their calendars.
- Approximately 100.0% of listings show high availability (181+ days open annually), indicating potential for increased bookings or specific owner usage patterns.
- For booked days, the 31-90 days range is most frequent in Quorn (64.7%), reflecting common guest stay durations or potential owner blocking patterns.
Quorn Airbnb Minimum Stay Requirements Analysis
Distribution of Listings by Minimum Night Requirement
1 Night
12 listings
75% of total
2 Nights
4 listings
25% of total
Key Insights
- The most prevalent minimum stay requirement in Quorn is 1 Night, adopted by 75% of listings. This highlights the market's preference for shorter, flexible bookings.
- A strong majority (100.0%) of the Quorn Airbnb data shows acceptance of very short stays (1-2 nights), indicating a dynamic, high-turnover market.
Recommendations
- Align with the market by considering a 1 Night minimum stay, as 75% of Quorn hosts use this setting.
- Adjust minimum nights based on seasonality – potentially shorter during low season and longer during peak demand periods in Quorn.
Quorn Airbnb Cancellation Policy Trends Analysis (2026)
Flexible
3 listings
60% of total
Firm
2 listings
40% of total
Cancellation Policy Insights for Quorn
- The prevailing Airbnb cancellation policy trend in Quorn is Flexible, used by 60% of listings.
- There's a relatively balanced mix between guest-friendly (60.0%) and stricter (40.0%) policies, offering choices for different guest needs.
Recommendations for Hosts
- Consider adopting a Flexible policy to align with the 60% market standard in Quorn.
- Given the high prevalence of Flexible policies (60%), offering this can enhance booking appeal, especially during shoulder seasons.
- Regularly review your cancellation policy against competitors and market demand shifts in Quorn.
Quorn STR Booking Lead Time Analysis (2026)
Average Booking Lead Time by Month
Booking Lead Time Insights for Quorn
- The overall average booking lead time for vacation rentals in Quorn is 42 days.
- Guests book furthest in advance for stays during June (average 96 days), likely coinciding with peak travel demand or local events.
- The shortest booking windows occur for stays in February (average 6 days), indicating more last-minute travel plans during this time.
- Seasonally, Spring (58 days avg.) sees the longest lead times, while Winter (33 days avg.) has the shortest, reflecting typical travel planning cycles.
Recommendations for Hosts
- Use the overall average lead time (42 days) as a baseline for your pricing and availability strategy in Quorn.
- For June stays, consider implementing length-of-stay discounts or slightly higher rates for bookings made less than 96 days out to capitalize on advance planning.
- During February, focus on last-minute booking availability and promotions, as guests book with very short notice (6 days avg.).
- Target marketing efforts for the Spring season well in advance (at least 58 days) to capture early planners.
- Monitor your own booking lead times against these Quorn averages to identify opportunities for dynamic pricing adjustments.
Popular & Essential Airbnb Amenities in Quorn (2026)
Amenity Prevalence
Amenity Insights for Quorn
- Essential amenities in Quorn that guests expect include: Heating, Free parking on premises. Lacking these (any) could significantly impact bookings.
- Popular amenities like Hot water, Washer, Essentials are common but not universal. Offering these can provide a competitive edge.
- Warning: Wifi is not universally provided but is considered essential globally. Ensure reliable Wifi is offered.
Recommendations for Hosts
- Ensure your listing includes all essential amenities for Quorn: Heating, Free parking on premises.
- Consider adding popular differentiators like Hot water or Washer to increase appeal.
- Highlight unique or less common amenities you offer (e.g., hot tub, dedicated workspace, EV charger) in your listing description and photos.
- Regularly check competitor amenities in Quorn to stay competitive.
Quorn Airbnb Guest Demographics & Profile Analysis (2026)
Guest Profile Summary for Quorn
- The typical guest profile for Airbnb in Quorn consists of primarily domestic travelers (95%), often arriving from nearby Eden Hills, typically belonging to the Post-2000s (Gen Z/Alpha) group (50%), primarily speaking English or German.
- Domestic travelers account for 95.0% of guests.
- Key international markets include Australia (95%) and United Kingdom (5%).
- Top languages spoken are English (90%) followed by German (10%).
- A significant demographic segment is the Post-2000s (Gen Z/Alpha) group, representing 50% of guests.
Recommendations for Hosts
- Target domestic marketing efforts towards travelers from Eden Hills and Adelaide.
- Tailor amenities and listing descriptions to appeal to the dominant Post-2000s (Gen Z/Alpha) demographic (e.g., highlight fast WiFi, smart home features, local guides).
- Highlight unique local experiences or amenities relevant to the primary guest profile.
- Consider seasonal promotions aligned with peak travel times for key origin markets.
Nearby Short-Term Rental Market Comparison
How does the Quorn Airbnb market stack up against its neighbors? Compare key performance metrics like average monthly revenue, ADR, and occupancy rates in surrounding areas to understand the broader regional STR landscape.
| Market | Active Properties | Monthly Revenue | Daily Rate | Avg. Occupancy |
|---|---|---|---|---|
| Clare and Gilbert Valleys Council | 33 | $3,096 | $237.45 | 45% |
| Sevenhill | 10 | $3,093 | $186.81 | 56% |
| Clare | 37 | $2,368 | $175.38 | 51% |
| Mintaro | 26 | $2,222 | $234.24 | 40% |
| Hawker | 23 | $2,174 | $220.81 | 44% |
| Wallaroo | 55 | $2,174 | $249.21 | 38% |
| Watervale | 12 | $1,903 | $154.14 | 42% |
| Melrose | 15 | $1,609 | $137.90 | 46% |
| Burra | 12 | $1,550 | $133.42 | 41% |
| Port Pirie Regional Council | 18 | $1,343 | $130.31 | 43% |