Fremantle Airbnb Market Analysis 2026: Short Term Rental Data & Vacation Rental Statistics in Western Australia, Australia
Is Airbnb profitable in Fremantle in 2026? Explore comprehensive Airbnb analytics for Fremantle, Western Australia, Australia to uncover income potential. This 2026 STR market report for Fremantle, based on AirROI data from February 2025 to January 2026, reveals key trends in the market of 318 active listings.
Whether you're considering an Airbnb investment in Fremantle, optimizing your existing vacation rental, or exploring rental arbitrage opportunities, understanding the Fremantle Airbnb data is crucial. Navigating the high regulation landscape is key to maximizing your short term rental income potential. Let's dive into the specifics.
Key Fremantle Airbnb Performance Metrics Overview
Monthly Airbnb Revenue Variations & Income Potential in Fremantle (2026)
Understanding the monthly revenue variations for Airbnb listings in Fremantle is key to maximizing your short term rental income potential. Seasonality significantly impacts earnings. Our analysis, based on data from the past 12 months, shows that the peak revenue month for STRs in Fremantle is typically December, while May often presents the lowest earnings, highlighting opportunities for strategic pricing adjustments during shoulder and low seasons. Explore the typical Airbnb income in Fremantle across different performance tiers:
- Best-in-class properties (Top 10%) achieve $5,824+ monthly, often utilizing dynamic pricing and superior guest experiences.
- Strong performing properties (Top 25%) earn $4,512 or more, indicating effective management and desirable locations/amenities.
- Typical properties (Median) generate around $3,221 per month, representing the average market performance.
- Entry-level properties (Bottom 25%) see earnings around $2,184, often with potential for optimization.
Average Monthly Airbnb Earnings Trend in Fremantle
Fremantle Airbnb Occupancy Rate Trends (2026)
Maximize your bookings by understanding the Fremantle STR occupancy trends. Seasonal demand shifts significantly influence how often properties are booked. Typically, Novembersees the highest demand (peak season occupancy), while August experiences the lowest (low season). Effective strategies, like adjusting minimum stays or offering promotions, can boost occupancy during slower periods. Here's how different property tiers perform in Fremantle:
- Best-in-class properties (Top 10%) achieve 92%+ occupancy, indicating high desirability and potentially optimized availability.
- Strong performing properties (Top 25%) maintain 85% or higher occupancy, suggesting good market fit and guest satisfaction.
- Typical properties (Median) have an occupancy rate around 72%.
- Entry-level properties (Bottom 25%) average 50% occupancy, potentially facing higher vacancy.
Average Monthly Occupancy Rate Trend in Fremantle
Average Daily Rate (ADR) Airbnb Trends in Fremantle (2026)
Effective short term rental pricing strategy in Fremantle involves understanding monthly ADR fluctuations. The Average Daily Rate (ADR) for Airbnb in Fremantle typically peaks in December and dips lowest during May. Leveraging Airbnb dynamic pricing tools or strategies based on this seasonality can significantly boost revenue. Here's a look at the typical nightly rates achieved:
- Best-in-class properties (Top 10%) command rates of $264+ per night, often due to premium features or locations.
- Strong performing properties (Top 25%) achieve nightly rates of $207 or more.
- Typical properties (Median) charge around $155 per night.
- Entry-level properties (Bottom 25%) earn around $116 per night.
Average Daily Rate (ADR) Trend by Month in Fremantle
Get Live Fremantle Market Intelligence 👇

Explore Real-time Analytics
Airbnb Seasonality Analysis & Trends in Fremantle (2026)
Peak Season (December, October, November)
- Revenue averages $4,186 per month
- Occupancy rates average 73.6%
- Daily rates average $186
Shoulder Season
- Revenue averages $3,344 per month
- Occupancy maintains around 64.6%
- Daily rates hold near $170
Low Season (May, June, August)
- Revenue drops to average $2,897 per month
- Occupancy decreases to average 58.0%
- Daily rates adjust to average $162
Seasonality Insights for Fremantle
- The Airbnb seasonality in Fremantle shows moderate seasonality with distinct peak and low periods. While the sections above show seasonal averages, it's also insightful to look at the extremes:
- During the high season, the absolute peak month showcases Fremantle's highest earning potential, with monthly revenues capable of climbing to $4,270, occupancy reaching a high of 75.6%, and ADRs peaking at $192.
- Conversely, the slowest single month of the year, typically falling within the low season, marks the market's lowest point. In this month, revenue might dip to $2,844, occupancy could drop to 56.7%, and ADRs may adjust down to $160.
- Understanding both the seasonal averages and these monthly peaks and troughs in revenue, occupancy, and ADR is crucial for maximizing your Airbnb profit potential in Fremantle.
Seasonal Strategies for Maximizing Profit
- Peak Season: Maximize revenue through premium pricing and potentially longer minimum stays. Ensure high availability.
- Low Season: Offer competitive pricing, special promotions (e.g., extended stay discounts), and flexible cancellation policies. Target off-season travelers like remote workers or budget-conscious guests.
- Shoulder Seasons: Implement dynamic pricing that balances peak and low rates. Target weekend travelers or specific events. Offer slightly more flexible terms than peak season.
- Regularly analyze your own performance against these Fremantle seasonality benchmarks and adjust your pricing and availability strategy accordingly.
Best Areas for Airbnb Investment in Fremantle (2026)
Exploring the top neighborhoods for short-term rentals in Fremantle? This section highlights key areas, outlining why they are attractive for hosts and guests, along with notable local attractions. Consider these locations based on your target guest profile and investment strategy.
| Neighborhood / Area | Why Host Here? (Target Guests & Appeal) | Key Attractions & Landmarks |
|---|---|---|
| South Fremantle | A vibrant coastal suburb with a bohemian vibe, known for its cafes, markets, and proximity to the beach. Perfect for tourists looking for a relaxed atmosphere and local culture. | South Beach, Fremantle Markets, Cappuccino Strip, Bathers Beach, Fremantle Prison |
| Fremantle City Centre | The historic heart of Fremantle, filled with heritage buildings, restaurants, and cultural attractions. A must-visit for those seeking local history and vibrant nightlife. | Fremantle Markets, Fremantle Prison, Fishing Boat Harbour, Maritime Museum, Round House |
| East Fremantle | A charming suburb with a mix of modern and historic homes, offering a quiet retreat with easy access to the city. Ideal for families and couples. | Bicton Baths, George Stadium, East Fremantle Yacht Club, Richmond Quarter, Kangaroo and Wildlife Tours |
| North Fremantle | An eclectic waterfront area known for its laid-back vibe and stunning views of the Swan River. Great for outdoor enthusiasts and those seeking a peaceful stay. | Leighton Beach, North Fremantle Foreshore, The Leighton, Cafes and Bars along the river, Kakulas Sisters |
| Gilbert Street | A quieter residential street that offers a local feel with proximity to public transport and amenities. Appeals to guests looking for a homely experience. | Local parks, Shopping centre, Coffee shops and bakeries, Community events, Art galleries nearby |
| Victoria Quay | A prime waterfront area with easy access to ferries, dining, and shopping. Perfect for those wanting to explore the coast and local attractions. | Fremantle Sailing Club, Maritime Museum, The Train Station, Public Art installations, Nearby beaches |
| Mossman Park | A leafy, residential area with family-friendly amenities, parks, and cafes. Offers a relaxed setting while still close to Fremantle’s main attractions. | Parks and playgrounds, Cafes and restaurants, Easy access to public transport, Local markets, Fremantle Golf Course |
| Bathers Beach | The only protected swimming beach in Fremantle, ideal for tourists looking for beach activities and relaxation. A vibrant area with nearby cafes and events. | Bathers Beach, Fremantle Fishermen's Harbour, Beachfront cafes, Water sports, Art installations along the beach |
Understanding Airbnb License Requirements & STR Laws in Fremantle (2026)
Yes, Fremantle, Western Australia, Australia enforces high STR regulations. Obtaining a license and ensuring compliance is almost certainly required according to current 2026 STR laws. Always verify the latest short term rental regulations and Airbnb license requirements directly with local government authorities for Fremantle to ensure full compliance before hosting.
(Source: AirROI data, 2026, based on 94% licensed listings)
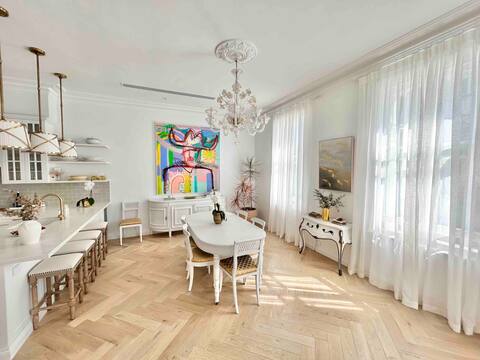
Top Performing Airbnb Properties in Fremantle (2026)
Benchmark your potential! Explore examples of top-performing Airbnb properties in Fremantlebased on Trailing Twelve Month (TTM) revenue. Analyze their characteristics, revenue, occupancy rate, and ADR to understand what drives success in this market.
Elegant apartment in Fremantle
Entire Place • 3 bedrooms
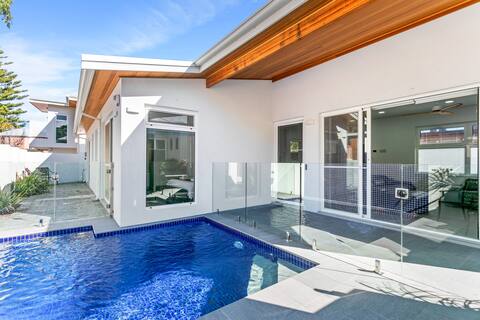
Luxury Villa with Pool in Central Fremantle
Entire Place • 3 bedrooms

Ralph’s Place - in Fremantle’s West End.
Entire Place • 4 bedrooms

Freo Family Oasis + Private Studio – Sleeps 10
Entire Place • 5 bedrooms

Luxury 2BR Large Apartment Walk to Shops & Beach
Entire Place • 2 bedrooms

Charming cottage on Carnac
Entire Place • 3 bedrooms
Note: Performance varies based on location, size, amenities, seasonality, and management quality. Data reflects the past 12 months.
Top Performing Airbnb Hosts in Fremantle (2026)
Learn from the best! This table showcases top-performing Airbnb hosts in Fremantle based on the number of properties managed and estimated total revenue over the past year. Analyze their scale and performance metrics.
| Host Name | Properties | Grossing Revenue | Stay Reviews | Avg Rating |
|---|---|---|---|---|
| Nicole | 30 | $1,571,159 | 2773 | 4.83/5.0 |
| SmartStayWA | 29 | $872,322 | 1690 | 4.56/5.0 |
| Alison | 15 | $369,780 | 1122 | 4.73/5.0 |
| Justine & Lan | 5 | $366,314 | 423 | 4.89/5.0 |
| Mary | 7 | $286,631 | 418 | 4.77/5.0 |
| Claire | 6 | $247,578 | 890 | 4.78/5.0 |
| Rachel | 3 | $231,931 | 109 | 4.92/5.0 |
| Dan | 7 | $215,889 | 442 | 4.61/5.0 |
| Linda | 9 | $147,783 | 268 | 4.92/5.0 |
| Candie | 2 | $138,647 | 289 | 4.94/5.0 |
Analyzing the strategies of top hosts, such as their property selection, pricing, and guest communication, can offer valuable lessons for optimizing your own Airbnb operations in Fremantle.
Dive Deeper: Advanced Fremantle STR Market Data (2026)
Ready to unlock more insights? AirROI provides access to advanced metrics and comprehensive Airbnb data for Fremantle. Explore detailed analytics beyond this report to refine your investment strategy, optimize pricing, and maximize your vacation rental profits.
Explore Advanced MetricsFremantle Short-Term Rental Market Composition (2026): Property & Room Types
Room Type Distribution
Property Type Distribution
Market Composition Insights for Fremantle
- The Fremantle Airbnb market composition is heavily skewed towards Entire Home/Apt listings, which make up 91.2% of the 318 active rentals. This indicates strong guest preference for privacy and space.
- Looking at the property type distribution in Fremantle, Apartment/Condo properties are the most common (63.2%), reflecting the local real estate landscape.
- Houses represent a significant 23.9% portion, catering likely to families or larger groups.
- The presence of 8.8% Hotel/Boutique listings indicates integration with traditional hospitality.
- Smaller segments like others (combined 4.1%) offer potential for unique stay experiences.
Fremantle Airbnb Room Capacity Analysis (2026): Bedroom Distribution
Distribution of Listings by Number of Bedrooms
Room Capacity Insights for Fremantle
- The dominant room capacity in Fremantle is 1 bedroom listings, making up 45.6% of the market. This suggests a strong demand for properties suitable for couples or solo travelers.
- Together, 1 bedroom and 2 bedrooms properties represent 77.0% of the active Airbnb listings in Fremantle, indicating a high concentration in these sizes.
Fremantle Vacation Rental Guest Capacity Trends (2026)
Distribution of Listings by Guest Capacity
Guest Capacity Insights for Fremantle
- The most common guest capacity trend in Fremantle vacation rentals is listings accommodating 2 guests (44%). This suggests the primary traveler segment is likely couples or solo travelers.
- Properties designed for 2 guests and 4 guests dominate the Fremantle STR market, accounting for 75.1% of listings.
- A significant 44.3% of listings cater specifically to 1-2 guests, highlighting strong demand from couples and solo travelers in Fremantle.
- 14.1% of properties accommodate 6+ guests, serving the market segment for larger families or group travel in Fremantle.
- On average, properties in Fremantle are equipped to host 3.2 guests.
Fremantle Airbnb Booking Patterns (2026): Available vs. Booked Days
Available Days Distribution
Booked Days Distribution
Booking Pattern Insights for Fremantle
- The most common availability pattern in Fremantle falls within the 31-90 days range, representing 30.2% of listings. This suggests many properties have significant open periods on their calendars.
- Approximately 39.6% of listings show high availability (181+ days open annually), indicating potential for increased bookings or specific owner usage patterns.
- For booked days, the 271-366 days range is most frequent in Fremantle (34%), reflecting common guest stay durations or potential owner blocking patterns.
- A notable 62.0% of properties secure long booking periods (181+ days booked per year), highlighting successful long-term rental strategies or significant owner usage.
Fremantle Airbnb Minimum Stay Requirements Analysis
Distribution of Listings by Minimum Night Requirement
1 Night
17 listings
5.3% of total
2 Nights
70 listings
22% of total
3 Nights
49 listings
15.4% of total
4-6 Nights
32 listings
10.1% of total
7-29 Nights
20 listings
6.3% of total
30+ Nights
130 listings
40.9% of total
Key Insights
- The most prevalent minimum stay requirement in Fremantle is 30+ Nights, adopted by 40.9% of listings. This highlights the market's preference for longer commitments.
- A significant segment (40.9%) caters to monthly stays (30+ nights) in Fremantle, pointing to opportunities in the extended-stay market.
Recommendations
- Align with the market by considering a 30+ Nights minimum stay, as 40.9% of Fremantle hosts use this setting.
- If feasible, allowing 1-night stays, especially midweek or during low season, could capture last-minute bookings, as only 5.3% currently do.
- Explore offering discounts for stays of 30+ nights to attract the 40.9% of the market seeking extended stays.
- Adjust minimum nights based on seasonality – potentially shorter during low season and longer during peak demand periods in Fremantle.
Fremantle Airbnb Cancellation Policy Trends Analysis (2026)
Limited
3 listings
0.9% of total
Super Strict 30 Days
5 listings
1.6% of total
Super Strict 60 Days
28 listings
8.8% of total
Flexible
47 listings
14.8% of total
Moderate
110 listings
34.6% of total
Firm
65 listings
20.4% of total
Strict
60 listings
18.9% of total
Cancellation Policy Insights for Fremantle
- The prevailing Airbnb cancellation policy trend in Fremantle is Moderate, used by 34.6% of listings.
- There's a relatively balanced mix between guest-friendly (49.4%) and stricter (39.3%) policies, offering choices for different guest needs.
Recommendations for Hosts
- Consider adopting a Moderate policy to align with the 34.6% market standard in Fremantle.
- Regularly review your cancellation policy against competitors and market demand shifts in Fremantle.
Fremantle STR Booking Lead Time Analysis (2026)
Average Booking Lead Time by Month
Booking Lead Time Insights for Fremantle
- The overall average booking lead time for vacation rentals in Fremantle is 60 days.
- Guests book furthest in advance for stays during November (average 84 days), likely coinciding with peak travel demand or local events.
- The shortest booking windows occur for stays in July (average 39 days), indicating more last-minute travel plans during this time.
- Seasonally, Fall (73 days avg.) sees the longest lead times, while Summer (42 days avg.) has the shortest, reflecting typical travel planning cycles.
Recommendations for Hosts
- Use the overall average lead time (60 days) as a baseline for your pricing and availability strategy in Fremantle.
- For November stays, consider implementing length-of-stay discounts or slightly higher rates for bookings made less than 84 days out to capitalize on advance planning.
- Target marketing efforts for the Fall season well in advance (at least 73 days) to capture early planners.
- Monitor your own booking lead times against these Fremantle averages to identify opportunities for dynamic pricing adjustments.
Popular & Essential Airbnb Amenities in Fremantle (2026)
Amenity Prevalence
Amenity Insights for Fremantle
- Essential amenities in Fremantle that guests expect include: Wifi, TV, Smoke alarm, Kitchen. Lacking these (any) could significantly impact bookings.
- Popular amenities like Hair dryer, Iron, Heating are common but not universal. Offering these can provide a competitive edge.
Recommendations for Hosts
- Ensure your listing includes all essential amenities for Fremantle: Wifi, TV, Smoke alarm, Kitchen.
- Prioritize adding missing essentials: Wifi, TV, Smoke alarm, Kitchen.
- Consider adding popular differentiators like Hair dryer or Iron to increase appeal.
- Highlight unique or less common amenities you offer (e.g., hot tub, dedicated workspace, EV charger) in your listing description and photos.
- Regularly check competitor amenities in Fremantle to stay competitive.
Fremantle Airbnb Guest Demographics & Profile Analysis (2026)
Guest Profile Summary for Fremantle
- The typical guest profile for Airbnb in Fremantle consists of a mix of domestic (65%) and international guests, often arriving from nearby Perth, typically belonging to the Post-2000s (Gen Z/Alpha) group (50%), primarily speaking English or French.
- Domestic travelers account for 64.9% of guests.
- Key international markets include Australia (64.9%) and United Kingdom (12%).
- Top languages spoken are English (65.3%) followed by French (6.8%).
- A significant demographic segment is the Post-2000s (Gen Z/Alpha) group, representing 50% of guests.
Recommendations for Hosts
- Target domestic marketing efforts towards travelers from Perth and Melbourne.
- Tailor amenities and listing descriptions to appeal to the dominant Post-2000s (Gen Z/Alpha) demographic (e.g., highlight fast WiFi, smart home features, local guides).
- Highlight unique local experiences or amenities relevant to the primary guest profile.
- Consider seasonal promotions aligned with peak travel times for key origin markets.
Nearby Short-Term Rental Market Comparison
How does the Fremantle Airbnb market stack up against its neighbors? Compare key performance metrics like average monthly revenue, ADR, and occupancy rates in surrounding areas to understand the broader regional STR landscape.
| Market | Active Properties | Monthly Revenue | Daily Rate | Avg. Occupancy |
|---|---|---|---|---|
| Gracetown | 39 | $4,612 | $393.93 | 44% |
| Cottesloe | 143 | $4,049 | $242.67 | 66% |
| Yallingup | 249 | $4,011 | $371.66 | 45% |
| Margaret River | 427 | $3,939 | $230.54 | 60% |
| Gnarabup | 94 | $3,814 | $276.21 | 50% |
| City of Joondalup | 52 | $3,605 | $252.97 | 57% |
| Peppermint Grove Beach | 38 | $3,549 | $342.65 | 41% |
| Prevelly | 43 | $3,508 | $237.69 | 57% |
| City Of Busselton | 558 | $3,499 | $313.72 | 42% |
| Cowaramup | 44 | $3,370 | $224.59 | 54% |