Kalgoorlie Airbnb Market Analysis 2026: Short Term Rental Data & Vacation Rental Statistics in Western Australia, Australia
Is Airbnb profitable in Kalgoorlie in 2026? Explore comprehensive Airbnb analytics for Kalgoorlie, Western Australia, Australia to uncover income potential. This 2026 STR market report for Kalgoorlie, based on AirROI data from February 2025 to January 2026, reveals key trends in the niche market of 74 active listings.
Whether you're considering an Airbnb investment in Kalgoorlie, optimizing your existing vacation rental, or exploring rental arbitrage opportunities, understanding the Kalgoorlie Airbnb data is crucial. Navigating the high regulation landscape is key to maximizing your short term rental income potential. Let's dive into the specifics.
Key Kalgoorlie Airbnb Performance Metrics Overview
Monthly Airbnb Revenue Variations & Income Potential in Kalgoorlie (2026)
Understanding the monthly revenue variations for Airbnb listings in Kalgoorlie is key to maximizing your short term rental income potential. Seasonality significantly impacts earnings. Our analysis, based on data from the past 12 months, shows that the peak revenue month for STRs in Kalgoorlie is typically October, while February often presents the lowest earnings, highlighting opportunities for strategic pricing adjustments during shoulder and low seasons. Explore the typical Airbnb income in Kalgoorlie across different performance tiers:
- Best-in-class properties (Top 10%) achieve $5,367+ monthly, often utilizing dynamic pricing and superior guest experiences.
- Strong performing properties (Top 25%) earn $4,018 or more, indicating effective management and desirable locations/amenities.
- Typical properties (Median) generate around $2,657 per month, representing the average market performance.
- Entry-level properties (Bottom 25%) see earnings around $1,579, often with potential for optimization.
Average Monthly Airbnb Earnings Trend in Kalgoorlie
Kalgoorlie Airbnb Occupancy Rate Trends (2026)
Maximize your bookings by understanding the Kalgoorlie STR occupancy trends. Seasonal demand shifts significantly influence how often properties are booked. Typically, Octobersees the highest demand (peak season occupancy), while February experiences the lowest (low season). Effective strategies, like adjusting minimum stays or offering promotions, can boost occupancy during slower periods. Here's how different property tiers perform in Kalgoorlie:
- Best-in-class properties (Top 10%) achieve 88%+ occupancy, indicating high desirability and potentially optimized availability.
- Strong performing properties (Top 25%) maintain 75% or higher occupancy, suggesting good market fit and guest satisfaction.
- Typical properties (Median) have an occupancy rate around 56%.
- Entry-level properties (Bottom 25%) average 32% occupancy, potentially facing higher vacancy.
Average Monthly Occupancy Rate Trend in Kalgoorlie
Average Daily Rate (ADR) Airbnb Trends in Kalgoorlie (2026)
Effective short term rental pricing strategy in Kalgoorlie involves understanding monthly ADR fluctuations. The Average Daily Rate (ADR) for Airbnb in Kalgoorlie typically peaks in August and dips lowest during September. Leveraging Airbnb dynamic pricing tools or strategies based on this seasonality can significantly boost revenue. Here's a look at the typical nightly rates achieved:
- Best-in-class properties (Top 10%) command rates of $389+ per night, often due to premium features or locations.
- Strong performing properties (Top 25%) achieve nightly rates of $214 or more.
- Typical properties (Median) charge around $165 per night.
- Entry-level properties (Bottom 25%) earn around $132 per night.
Average Daily Rate (ADR) Trend by Month in Kalgoorlie
Get Live Kalgoorlie Market Intelligence 👇

Explore Real-time Analytics
Airbnb Seasonality Analysis & Trends in Kalgoorlie (2026)
Peak Season (October, August, July)
- Revenue averages $3,729 per month
- Occupancy rates average 55.0%
- Daily rates average $258
Shoulder Season
- Revenue averages $3,031 per month
- Occupancy maintains around 55.5%
- Daily rates hold near $242
Low Season (January, February, March)
- Revenue drops to average $2,336 per month
- Occupancy decreases to average 47.8%
- Daily rates adjust to average $240
Seasonality Insights for Kalgoorlie
- The Airbnb seasonality in Kalgoorlie shows moderate seasonality with distinct peak and low periods. While the sections above show seasonal averages, it's also insightful to look at the extremes:
- During the high season, the absolute peak month showcases Kalgoorlie's highest earning potential, with monthly revenues capable of climbing to $3,939, occupancy reaching a high of 63.1%, and ADRs peaking at $276.
- Conversely, the slowest single month of the year, typically falling within the low season, marks the market's lowest point. In this month, revenue might dip to $2,090, occupancy could drop to 45.6%, and ADRs may adjust down to $232.
- Understanding both the seasonal averages and these monthly peaks and troughs in revenue, occupancy, and ADR is crucial for maximizing your Airbnb profit potential in Kalgoorlie.
Seasonal Strategies for Maximizing Profit
- Peak Season: Maximize revenue through premium pricing and potentially longer minimum stays. Ensure high availability.
- Low Season: Offer competitive pricing, special promotions (e.g., extended stay discounts), and flexible cancellation policies. Target off-season travelers like remote workers or budget-conscious guests.
- Shoulder Seasons: Implement dynamic pricing that balances peak and low rates. Target weekend travelers or specific events. Offer slightly more flexible terms than peak season.
- Regularly analyze your own performance against these Kalgoorlie seasonality benchmarks and adjust your pricing and availability strategy accordingly.
Best Areas for Airbnb Investment in Kalgoorlie (2026)
Exploring the top neighborhoods for short-term rentals in Kalgoorlie? This section highlights key areas, outlining why they are attractive for hosts and guests, along with notable local attractions. Consider these locations based on your target guest profile and investment strategy.
| Neighborhood / Area | Why Host Here? (Target Guests & Appeal) | Key Attractions & Landmarks |
|---|---|---|
| Kalgoorlie CBD | The central business district of Kalgoorlie is vibrant and busy, offering a range of services, restaurants, and attractions. It's the hub for visitors exploring the gold mining history and local culture. | Goldfields Museum, Kalgoorlie Miner statue, Golden Mile, Hannan Street, Super Pit |
| Boulder | Boulder is a historic suburb of Kalgoorlie, rich in mining heritage. It’s an attractive area for tourists interested in the gold rush history and the mining community. | Boulder Historical Society, The Great Boulder Range, Boulder Town Hall, Eureka Hotel |
| Mcgowan | This area is known for its proximity to local amenities and schools, making it convenient for families and longer-term visitors. It's a quiet area with parks and spacious living. | Local parks, Schools, Convenience stores, Community centers |
| Hannans | Hannans is a residential area that attracts workers in the mining industry. It’s close to both amenities and key mining sites, making it ideal for short-term rentals for mine workers. | Hannans North Tourist Mine, Local shopping centres, Parks |
| Somerville | A newer residential area that is popular with families and professionals. It offers modern housing and is close to schools, shops, and recreational facilities. | Somerville Park, Schools, Gym facilities, Shopping centres |
| Kambalda | Located nearby Kalgoorlie, Kambalda offers a beautiful landscape and is known for its mining heritage. It attracts a niche market of visitors interested in this aspect of Australian history. | Kambalda West Oval, Kambalda Townsite, Local mines |
| West Lamington | This suburb is known for its higher-end homes and green spaces. It attracts families and visitors looking for a quieter, more suburban experience while still close to the city. | Lamington National Park, Bowls Club, Local cafes |
| South Kalgoorlie | A mixed-use area that includes both residential and light industrial properties. It is accessible and offers affordable accommodation options for budget-conscious travelers. | Local shops, Community facilities, Parks |
Understanding Airbnb License Requirements & STR Laws in Kalgoorlie (2026)
Yes, Kalgoorlie, Western Australia, Australia enforces high STR regulations. Obtaining a license and ensuring compliance is almost certainly required according to current 2026 STR laws. Always verify the latest short term rental regulations and Airbnb license requirements directly with local government authorities for Kalgoorlie to ensure full compliance before hosting.
(Source: AirROI data, 2026, based on 86% licensed listings)
Top Performing Airbnb Properties in Kalgoorlie (2026)
Benchmark your potential! Explore examples of top-performing Airbnb properties in Kalgoorliebased on Trailing Twelve Month (TTM) revenue. Analyze their characteristics, revenue, occupancy rate, and ADR to understand what drives success in this market.
Oasis in the outback
Entire Place • 4 bedrooms
Diggers and Dealers Full House Available
Entire Place • 4 bedrooms
Large 5 bed house across Spudshed and golf course
Entire Place • 5 bedrooms
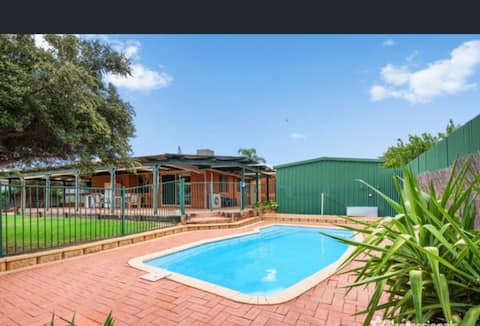
Secluded oasis & inground pool
Entire Place • 4 bedrooms

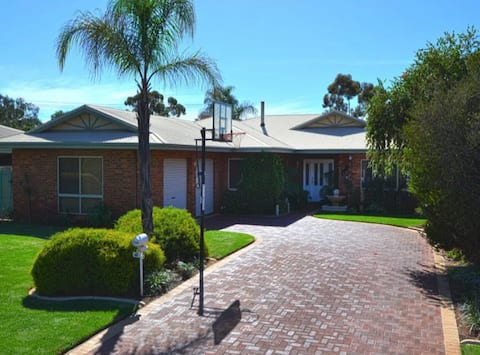
Super House, Super Host
Entire Place • 4 bedrooms

Pet friendly + Yard | BBQ + Dining | 2min Hospital
Entire Place • 3 bedrooms
Note: Performance varies based on location, size, amenities, seasonality, and management quality. Data reflects the past 12 months.
Top Performing Airbnb Hosts in Kalgoorlie (2026)
Learn from the best! This table showcases top-performing Airbnb hosts in Kalgoorlie based on the number of properties managed and estimated total revenue over the past year. Analyze their scale and performance metrics.
| Host Name | Properties | Grossing Revenue | Stay Reviews | Avg Rating |
|---|---|---|---|---|
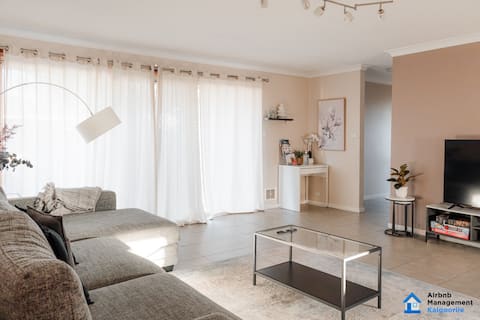
| Airbnb Management Kalgoorlie | 4 | $133,774 | 86 | 4.78/5.0 |
| Tracey And Adrian | 2 | $96,401 | 131 | 4.99/5.0 |
| Bec | 1 | $80,976 | 42 | 4.95/5.0 |
| Kirstyn | 1 | $74,551 | 2 | Not Rated |
| Biljana | 1 | $73,747 | 31 | 4.81/5.0 |
| Kristen | 2 | $72,605 | 52 | 4.68/5.0 |
| Allison And Carl | 4 | $69,145 | 201 | 4.94/5.0 |
| Grant | 2 | $65,672 | 179 | 4.97/5.0 |
| Sid | 2 | $65,334 | 200 | 4.75/5.0 |
| Sandeep | 4 | $61,711 | 111 | 4.34/5.0 |
Analyzing the strategies of top hosts, such as their property selection, pricing, and guest communication, can offer valuable lessons for optimizing your own Airbnb operations in Kalgoorlie.
Dive Deeper: Advanced Kalgoorlie STR Market Data (2026)
Ready to unlock more insights? AirROI provides access to advanced metrics and comprehensive Airbnb data for Kalgoorlie. Explore detailed analytics beyond this report to refine your investment strategy, optimize pricing, and maximize your vacation rental profits.
Explore Advanced MetricsKalgoorlie Short-Term Rental Market Composition (2026): Property & Room Types
Room Type Distribution
Property Type Distribution
Market Composition Insights for Kalgoorlie
- The Kalgoorlie Airbnb market composition is heavily skewed towards Entire Home/Apt listings, which make up 85.1% of the 74 active rentals. This indicates strong guest preference for privacy and space.
- Looking at the property type distribution in Kalgoorlie, House properties are the most common (66.2%), reflecting the local real estate landscape.
- Houses represent a significant 66.2% portion, catering likely to families or larger groups.
- The presence of 14.9% Hotel/Boutique listings indicates integration with traditional hospitality.
- Smaller segments like others (combined 1.4%) offer potential for unique stay experiences.
Kalgoorlie Airbnb Room Capacity Analysis (2026): Bedroom Distribution
Distribution of Listings by Number of Bedrooms
Room Capacity Insights for Kalgoorlie
- The dominant room capacity in Kalgoorlie is 3 bedrooms listings, making up 37.8% of the market. This suggests a strong demand for properties suitable for families or small groups.
- Together, 3 bedrooms and 2 bedrooms properties represent 60.8% of the active Airbnb listings in Kalgoorlie, indicating a high concentration in these sizes.
- A significant 58.1% of listings offer 3+ bedrooms, catering to larger groups and families seeking more space in Kalgoorlie.
Kalgoorlie Vacation Rental Guest Capacity Trends (2026)
Distribution of Listings by Guest Capacity
Guest Capacity Insights for Kalgoorlie
- The most common guest capacity trend in Kalgoorlie vacation rentals is listings accommodating 6 guests (36.5%). This suggests the primary traveler segment is likely larger groups.
- Properties designed for 6 guests and 2 guests dominate the Kalgoorlie STR market, accounting for 56.8% of listings.
- 51.4% of properties accommodate 6+ guests, serving the market segment for larger families or group travel in Kalgoorlie.
- On average, properties in Kalgoorlie are equipped to host 4.8 guests.
Kalgoorlie Airbnb Booking Patterns (2026): Available vs. Booked Days
Available Days Distribution
Booked Days Distribution
Booking Pattern Insights for Kalgoorlie
- The most common availability pattern in Kalgoorlie falls within the 91-180 days range, representing 35.1% of listings. This suggests many properties have significant open periods on their calendars.
- Approximately 52.7% of listings show high availability (181+ days open annually), indicating potential for increased bookings or specific owner usage patterns.
- For booked days, the 181-270 days range is most frequent in Kalgoorlie (35.1%), reflecting common guest stay durations or potential owner blocking patterns.
- A notable 48.6% of properties secure long booking periods (181+ days booked per year), highlighting successful long-term rental strategies or significant owner usage.
Kalgoorlie Airbnb Minimum Stay Requirements Analysis
Distribution of Listings by Minimum Night Requirement
1 Night
13 listings
17.6% of total
2 Nights
8 listings
10.8% of total
3 Nights
7 listings
9.5% of total
4-6 Nights
5 listings
6.8% of total
7-29 Nights
7 listings
9.5% of total
30+ Nights
34 listings
45.9% of total
Key Insights
- The most prevalent minimum stay requirement in Kalgoorlie is 30+ Nights, adopted by 45.9% of listings. This highlights the market's preference for longer commitments.
- A significant segment (45.9%) caters to monthly stays (30+ nights) in Kalgoorlie, pointing to opportunities in the extended-stay market.
Recommendations
- Align with the market by considering a 30+ Nights minimum stay, as 45.9% of Kalgoorlie hosts use this setting.
- If feasible, allowing 1-night stays, especially midweek or during low season, could capture last-minute bookings, as only 17.6% currently do.
- Explore offering discounts for stays of 30+ nights to attract the 45.9% of the market seeking extended stays.
- Adjust minimum nights based on seasonality – potentially shorter during low season and longer during peak demand periods in Kalgoorlie.
Kalgoorlie Airbnb Cancellation Policy Trends Analysis (2026)
Limited
1 listings
1.4% of total
Super Strict 30 Days
1 listings
1.4% of total
Flexible
15 listings
20.5% of total
Moderate
23 listings
31.5% of total
Firm
28 listings
38.4% of total
Strict
5 listings
6.8% of total
Cancellation Policy Insights for Kalgoorlie
- The prevailing Airbnb cancellation policy trend in Kalgoorlie is Firm, used by 38.4% of listings.
- There's a relatively balanced mix between guest-friendly (52.0%) and stricter (45.2%) policies, offering choices for different guest needs.
- Strict cancellation policies are quite rare (6.8%), potentially making listings with this policy less competitive unless justified by high demand or property type.
Recommendations for Hosts
- Consider adopting a Firm policy to align with the 38.4% market standard in Kalgoorlie.
- Using a Strict policy might deter some guests, as only 6.8% of listings use it. Evaluate if potential revenue protection outweighs possible lower booking rates.
- Regularly review your cancellation policy against competitors and market demand shifts in Kalgoorlie.
Kalgoorlie STR Booking Lead Time Analysis (2026)
Average Booking Lead Time by Month
Booking Lead Time Insights for Kalgoorlie
- The overall average booking lead time for vacation rentals in Kalgoorlie is 48 days.
- Guests book furthest in advance for stays during August (average 85 days), likely coinciding with peak travel demand or local events.
- The shortest booking windows occur for stays in March (average 23 days), indicating more last-minute travel plans during this time.
- Seasonally, Fall (52 days avg.) sees the longest lead times, while Spring (29 days avg.) has the shortest, reflecting typical travel planning cycles.
Recommendations for Hosts
- Use the overall average lead time (48 days) as a baseline for your pricing and availability strategy in Kalgoorlie.
- For August stays, consider implementing length-of-stay discounts or slightly higher rates for bookings made less than 85 days out to capitalize on advance planning.
- Target marketing efforts for the Fall season well in advance (at least 52 days) to capture early planners.
- Monitor your own booking lead times against these Kalgoorlie averages to identify opportunities for dynamic pricing adjustments.
Popular & Essential Airbnb Amenities in Kalgoorlie (2026)
Amenity Prevalence
Amenity Insights for Kalgoorlie
- Essential amenities in Kalgoorlie that guests expect include: TV, Air conditioning. Lacking these (any) could significantly impact bookings.
- Popular amenities like Wifi, Heating, Smoke alarm are common but not universal. Offering these can provide a competitive edge.
- Warning: Wifi is not universally provided but is considered essential globally. Ensure reliable Wifi is offered.
Recommendations for Hosts
- Ensure your listing includes all essential amenities for Kalgoorlie: TV, Air conditioning.
- Prioritize adding missing essentials: TV, Air conditioning.
- Consider adding popular differentiators like Wifi or Heating to increase appeal.
- Highlight unique or less common amenities you offer (e.g., hot tub, dedicated workspace, EV charger) in your listing description and photos.
- Regularly check competitor amenities in Kalgoorlie to stay competitive.
Kalgoorlie Airbnb Guest Demographics & Profile Analysis (2026)
Guest Profile Summary for Kalgoorlie
- The typical guest profile for Airbnb in Kalgoorlie consists of primarily domestic travelers (90%), often arriving from nearby Perth, typically belonging to the Post-2000s (Gen Z/Alpha) group (50%), primarily speaking English or Hindi.
- Domestic travelers account for 89.8% of guests.
- Key international markets include Australia (89.8%) and United States (1.8%).
- Top languages spoken are English (71.6%) followed by Hindi (4.5%).
- A significant demographic segment is the Post-2000s (Gen Z/Alpha) group, representing 50% of guests.
Recommendations for Hosts
- Target domestic marketing efforts towards travelers from Perth and Western Australia.
- Tailor amenities and listing descriptions to appeal to the dominant Post-2000s (Gen Z/Alpha) demographic (e.g., highlight fast WiFi, smart home features, local guides).
- Highlight unique local experiences or amenities relevant to the primary guest profile.
- Consider seasonal promotions aligned with peak travel times for key origin markets.
Nearby Short-Term Rental Market Comparison
How does the Kalgoorlie Airbnb market stack up against its neighbors? Compare key performance metrics like average monthly revenue, ADR, and occupancy rates in surrounding areas to understand the broader regional STR landscape.
| Market | Active Properties | Monthly Revenue | Daily Rate | Avg. Occupancy |
|---|---|---|---|---|
| Boulder | 10 | $1,379 | $248.40 | 35% |