Mosman Park Airbnb Market Analysis 2026: Short Term Rental Data & Vacation Rental Statistics in Western Australia, Australia
Is Airbnb profitable in Mosman Park in 2026? Explore comprehensive Airbnb analytics for Mosman Park, Western Australia, Australia to uncover income potential. This 2026 STR market report for Mosman Park, based on AirROI data from February 2025 to January 2026, reveals key trends in the niche market of 48 active listings.
Whether you're considering an Airbnb investment in Mosman Park, optimizing your existing vacation rental, or exploring rental arbitrage opportunities, understanding the Mosman Park Airbnb data is crucial. Navigating the high regulation landscape is key to maximizing your short term rental income potential. Let's dive into the specifics.
Key Mosman Park Airbnb Performance Metrics Overview
Monthly Airbnb Revenue Variations & Income Potential in Mosman Park (2026)
Understanding the monthly revenue variations for Airbnb listings in Mosman Park is key to maximizing your short term rental income potential. Seasonality significantly impacts earnings. Our analysis, based on data from the past 12 months, shows that the peak revenue month for STRs in Mosman Park is typically November, while August often presents the lowest earnings, highlighting opportunities for strategic pricing adjustments during shoulder and low seasons. Explore the typical Airbnb income in Mosman Park across different performance tiers:
- Best-in-class properties (Top 10%) achieve $6,630+ monthly, often utilizing dynamic pricing and superior guest experiences.
- Strong performing properties (Top 25%) earn $4,607 or more, indicating effective management and desirable locations/amenities.
- Typical properties (Median) generate around $2,999 per month, representing the average market performance.
- Entry-level properties (Bottom 25%) see earnings around $1,843, often with potential for optimization.
Average Monthly Airbnb Earnings Trend in Mosman Park
Mosman Park Airbnb Occupancy Rate Trends (2026)
Maximize your bookings by understanding the Mosman Park STR occupancy trends. Seasonal demand shifts significantly influence how often properties are booked. Typically, Marchsees the highest demand (peak season occupancy), while August experiences the lowest (low season). Effective strategies, like adjusting minimum stays or offering promotions, can boost occupancy during slower periods. Here's how different property tiers perform in Mosman Park:
- Best-in-class properties (Top 10%) achieve 91%+ occupancy, indicating high desirability and potentially optimized availability.
- Strong performing properties (Top 25%) maintain 85% or higher occupancy, suggesting good market fit and guest satisfaction.
- Typical properties (Median) have an occupancy rate around 69%.
- Entry-level properties (Bottom 25%) average 44% occupancy, potentially facing higher vacancy.
Average Monthly Occupancy Rate Trend in Mosman Park
Average Daily Rate (ADR) Airbnb Trends in Mosman Park (2026)
Effective short term rental pricing strategy in Mosman Park involves understanding monthly ADR fluctuations. The Average Daily Rate (ADR) for Airbnb in Mosman Park typically peaks in December and dips lowest during May. Leveraging Airbnb dynamic pricing tools or strategies based on this seasonality can significantly boost revenue. Here's a look at the typical nightly rates achieved:
- Best-in-class properties (Top 10%) command rates of $515+ per night, often due to premium features or locations.
- Strong performing properties (Top 25%) achieve nightly rates of $260 or more.
- Typical properties (Median) charge around $148 per night.
- Entry-level properties (Bottom 25%) earn around $111 per night.
Average Daily Rate (ADR) Trend by Month in Mosman Park
Get Live Mosman Park Market Intelligence 👇

Explore Real-time Analytics
Airbnb Seasonality Analysis & Trends in Mosman Park (2026)
Peak Season (November, October, December)
- Revenue averages $4,348 per month
- Occupancy rates average 68.9%
- Daily rates average $224
Shoulder Season
- Revenue averages $3,421 per month
- Occupancy maintains around 63.1%
- Daily rates hold near $218
Low Season (May, June, August)
- Revenue drops to average $2,923 per month
- Occupancy decreases to average 56.3%
- Daily rates adjust to average $210
Seasonality Insights for Mosman Park
- The Airbnb seasonality in Mosman Park shows moderate seasonality with distinct peak and low periods. While the sections above show seasonal averages, it's also insightful to look at the extremes:
- During the high season, the absolute peak month showcases Mosman Park's highest earning potential, with monthly revenues capable of climbing to $4,515, occupancy reaching a high of 73.8%, and ADRs peaking at $233.
- Conversely, the slowest single month of the year, typically falling within the low season, marks the market's lowest point. In this month, revenue might dip to $2,514, occupancy could drop to 50.3%, and ADRs may adjust down to $207.
- Understanding both the seasonal averages and these monthly peaks and troughs in revenue, occupancy, and ADR is crucial for maximizing your Airbnb profit potential in Mosman Park.
Seasonal Strategies for Maximizing Profit
- Peak Season: Maximize revenue through premium pricing and potentially longer minimum stays. Ensure high availability.
- Low Season: Offer competitive pricing, special promotions (e.g., extended stay discounts), and flexible cancellation policies. Target off-season travelers like remote workers or budget-conscious guests.
- Shoulder Seasons: Implement dynamic pricing that balances peak and low rates. Target weekend travelers or specific events. Offer slightly more flexible terms than peak season.
- Regularly analyze your own performance against these Mosman Park seasonality benchmarks and adjust your pricing and availability strategy accordingly.
Best Areas for Airbnb Investment in Mosman Park (2026)
Exploring the top neighborhoods for short-term rentals in Mosman Park? This section highlights key areas, outlining why they are attractive for hosts and guests, along with notable local attractions. Consider these locations based on your target guest profile and investment strategy.
| Neighborhood / Area | Why Host Here? (Target Guests & Appeal) | Key Attractions & Landmarks |
|---|---|---|
| Mosman Beach | A stunning beach area that offers a relaxed lifestyle, beautiful views, and access to ocean activities. Great for families and tourists seeking a coastal escape. | Mosman Beach, Perth Sailing Club, Cottesloe Beach, Swan River, Local cafes and dining options |
| Greenwood Street | A quiet residential area that is appealing to families and long-term guests due to its affordability and community vibe. Offers proximity to schools and parks. | Local parks, Community center, Children's playground, Nearby shops and markets |
| Swanbourne | An affluent suburb known for its luxurious homes and proximity to the beach. Attracts affluent travelers looking for a high-end experience. | Swanbourne Beach, Local boutiques, Restaurants and cafes, Swanbourne Village |
| Cottesloe | A popular destination for both locals and tourists due to its iconic beaches and vibrant dining scene. Perfect for short-term rentals aimed at beachgoers. | Cottesloe Beach, Cottesloe Hotel, The Nautical Market, Local art galleries |
| Peppermint Grove | One of the wealthiest suburbs in Australia, offering luxury accommodation options that appeal to high-end guests and those seeking upscale experiences. | Peppers Centre for Maritime History, Local gardens and parks, Proximity to Perth city |
| Claremont | Known for its shopping and dining facilities, Claremont attracts a mix of tourists and business travelers, making it a lucrative location for Airbnb hosts. | Claremont Quarter, Lake Claremont, Local cafes and shops, Stuart Street parkland |
| Dalkeith | An exclusive suburb that offers high-end properties, ideal for luxury short-term rentals for affluent guests and corporate clients. | Richmond Reserve, Local golf clubs, Perth National Park, Proximity to Swan River |
| Mosman Park Town Centre | A vibrant hub with restaurants and shops, attracting visitors who prefer a more localized experience while still being close to beaches. | Mosman Park Shopping Centre, Local eateries, Public transport connections, Cafes and nightlife |
Understanding Airbnb License Requirements & STR Laws in Mosman Park (2026)
Yes, Mosman Park, Western Australia, Australia enforces high STR regulations. Obtaining a license and ensuring compliance is almost certainly required according to current 2026 STR laws. Always verify the latest short term rental regulations and Airbnb license requirements directly with local government authorities for Mosman Park to ensure full compliance before hosting.
(Source: AirROI data, 2026, based on 90% licensed listings)
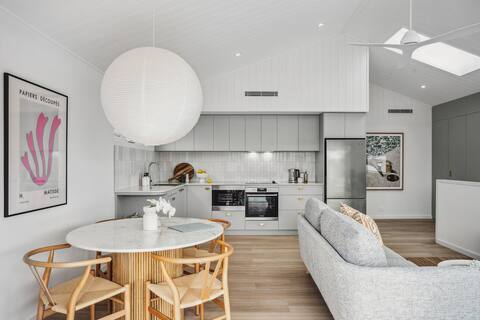
Top Performing Airbnb Properties in Mosman Park (2026)
Benchmark your potential! Explore examples of top-performing Airbnb properties in Mosman Parkbased on Trailing Twelve Month (TTM) revenue. Analyze their characteristics, revenue, occupancy rate, and ADR to understand what drives success in this market.

Family Oasis with Pool & Playground
Entire Place • 3 bedrooms

Live like a local Mosman Park between river & sea
Entire Place • 3 bedrooms
Amuse-Bouche - Brand New Apartment by River & Sea
Entire Place • 2 bedrooms

Ripper on Swan!
Entire Place • 3 bedrooms

1904 Cot Beach Worker's Cottage
Entire Place • 2 bedrooms

A Luxurious Tuscan Escape
Entire Place • 4 bedrooms
Note: Performance varies based on location, size, amenities, seasonality, and management quality. Data reflects the past 12 months.
Top Performing Airbnb Hosts in Mosman Park (2026)
Learn from the best! This table showcases top-performing Airbnb hosts in Mosman Park based on the number of properties managed and estimated total revenue over the past year. Analyze their scale and performance metrics.
| Host Name | Properties | Grossing Revenue | Stay Reviews | Avg Rating |
|---|---|---|---|---|
| Rachel | 1 | $111,246 | 42 | 4.88/5.0 |
| Vivians Stayz | 3 | $107,399 | 49 | 4.76/5.0 |
| Amber | 1 | $77,723 | 71 | 5.00/5.0 |
| Bree | 1 | $76,685 | 74 | 4.96/5.0 |
| Phyllis | 2 | $76,206 | 62 | 4.99/5.0 |
| Short Stay WA | 3 | $76,102 | 109 | 4.71/5.0 |
| Monica | 1 | $61,700 | 23 | 4.61/5.0 |
| Taylor | 1 | $58,929 | 3 | 5.00/5.0 |
| SBStays | 1 | $54,028 | 29 | 4.83/5.0 |
| Christopher | 1 | $52,607 | 11 | 5.00/5.0 |
Analyzing the strategies of top hosts, such as their property selection, pricing, and guest communication, can offer valuable lessons for optimizing your own Airbnb operations in Mosman Park.
Dive Deeper: Advanced Mosman Park STR Market Data (2026)
Ready to unlock more insights? AirROI provides access to advanced metrics and comprehensive Airbnb data for Mosman Park. Explore detailed analytics beyond this report to refine your investment strategy, optimize pricing, and maximize your vacation rental profits.
Explore Advanced MetricsMosman Park Short-Term Rental Market Composition (2026): Property & Room Types
Room Type Distribution
Property Type Distribution
Market Composition Insights for Mosman Park
- The Mosman Park Airbnb market composition is heavily skewed towards Entire Home/Apt listings, which make up 87.5% of the 48 active rentals. This indicates strong guest preference for privacy and space.
- Looking at the property type distribution in Mosman Park, Apartment/Condo properties are the most common (47.9%), reflecting the local real estate landscape.
- Houses represent a significant 45.8% portion, catering likely to families or larger groups.
- Smaller segments like hotel/boutique, others (combined 6.3%) offer potential for unique stay experiences.
Mosman Park Airbnb Room Capacity Analysis (2026): Bedroom Distribution
Distribution of Listings by Number of Bedrooms
Room Capacity Insights for Mosman Park
- The dominant room capacity in Mosman Park is 2 bedrooms listings, making up 31.3% of the market. This suggests a strong demand for properties suitable for couples or solo travelers.
- Together, 2 bedrooms and 1 bedroom properties represent 60.5% of the active Airbnb listings in Mosman Park, indicating a high concentration in these sizes.
- A significant 27.1% of listings offer 3+ bedrooms, catering to larger groups and families seeking more space in Mosman Park.
Mosman Park Vacation Rental Guest Capacity Trends (2026)
Distribution of Listings by Guest Capacity
Guest Capacity Insights for Mosman Park
- The most common guest capacity trend in Mosman Park vacation rentals is listings accommodating 4 guests (25%). This suggests the primary traveler segment is likely small families or groups.
- Properties designed for 4 guests and 2 guests dominate the Mosman Park STR market, accounting for 50.0% of listings.
- 22.9% of properties accommodate 6+ guests, serving the market segment for larger families or group travel in Mosman Park.
- On average, properties in Mosman Park are equipped to host 3.7 guests.
Mosman Park Airbnb Booking Patterns (2026): Available vs. Booked Days
Available Days Distribution
Booked Days Distribution
Booking Pattern Insights for Mosman Park
- The most common availability pattern in Mosman Park falls within the 271-366 days range, representing 29.2% of listings. This suggests many properties have significant open periods on their calendars.
- Approximately 50.0% of listings show high availability (181+ days open annually), indicating potential for increased bookings or specific owner usage patterns.
- For booked days, the 271-366 days range is most frequent in Mosman Park (27.1%), reflecting common guest stay durations or potential owner blocking patterns.
- A notable 50.0% of properties secure long booking periods (181+ days booked per year), highlighting successful long-term rental strategies or significant owner usage.
Mosman Park Airbnb Minimum Stay Requirements Analysis
Distribution of Listings by Minimum Night Requirement
1 Night
1 listings
2.1% of total
2 Nights
5 listings
10.4% of total
3 Nights
5 listings
10.4% of total
4-6 Nights
8 listings
16.7% of total
7-29 Nights
1 listings
2.1% of total
30+ Nights
28 listings
58.3% of total
Key Insights
- The most prevalent minimum stay requirement in Mosman Park is 30+ Nights, adopted by 58.3% of listings. This highlights the market's preference for longer commitments.
- Very short stays (1-2 nights) are less common (12.5%), suggesting hosts prefer slightly longer bookings to optimize turnover.
- A significant segment (58.3%) caters to monthly stays (30+ nights) in Mosman Park, pointing to opportunities in the extended-stay market.
Recommendations
- Align with the market by considering a 30+ Nights minimum stay, as 58.3% of Mosman Park hosts use this setting.
- If feasible, allowing 1-night stays, especially midweek or during low season, could capture last-minute bookings, as only 2.1% currently do.
- Explore offering discounts for stays of 30+ nights to attract the 58.3% of the market seeking extended stays.
- Adjust minimum nights based on seasonality – potentially shorter during low season and longer during peak demand periods in Mosman Park.
Mosman Park Airbnb Cancellation Policy Trends Analysis (2026)
Super Strict 60 Days
1 listings
2.1% of total
Limited
1 listings
2.1% of total
Super Strict 30 Days
4 listings
8.3% of total
Flexible
4 listings
8.3% of total
Moderate
16 listings
33.3% of total
Firm
16 listings
33.3% of total
Strict
6 listings
12.5% of total
Cancellation Policy Insights for Mosman Park
- The prevailing Airbnb cancellation policy trend in Mosman Park is Moderate, used by 33.3% of listings.
- There's a relatively balanced mix between guest-friendly (41.6%) and stricter (45.8%) policies, offering choices for different guest needs.
Recommendations for Hosts
- Consider adopting a Moderate policy to align with the 33.3% market standard in Mosman Park.
- Using a Strict policy might deter some guests, as only 12.5% of listings use it. Evaluate if potential revenue protection outweighs possible lower booking rates.
- Regularly review your cancellation policy against competitors and market demand shifts in Mosman Park.
Mosman Park STR Booking Lead Time Analysis (2026)
Average Booking Lead Time by Month
Booking Lead Time Insights for Mosman Park
- The overall average booking lead time for vacation rentals in Mosman Park is 50 days.
- Guests book furthest in advance for stays during November (average 79 days), likely coinciding with peak travel demand or local events.
- The shortest booking windows occur for stays in August (average 23 days), indicating more last-minute travel plans during this time.
- Seasonally, Fall (63 days avg.) sees the longest lead times, while Summer (34 days avg.) has the shortest, reflecting typical travel planning cycles.
Recommendations for Hosts
- Use the overall average lead time (50 days) as a baseline for your pricing and availability strategy in Mosman Park.
- For November stays, consider implementing length-of-stay discounts or slightly higher rates for bookings made less than 79 days out to capitalize on advance planning.
- Target marketing efforts for the Fall season well in advance (at least 63 days) to capture early planners.
- Monitor your own booking lead times against these Mosman Park averages to identify opportunities for dynamic pricing adjustments.
Popular & Essential Airbnb Amenities in Mosman Park (2026)
Amenity Prevalence
Amenity Insights for Mosman Park
- Essential amenities in Mosman Park that guests expect include: Wifi, TV, Washer, Smoke alarm, Free parking on premises. Lacking these (any) could significantly impact bookings.
- Popular amenities like Dishes and silverware, Kitchen, Refrigerator are common but not universal. Offering these can provide a competitive edge.
Recommendations for Hosts
- Ensure your listing includes all essential amenities for Mosman Park: Wifi, TV, Washer, Smoke alarm, Free parking on premises.
- Prioritize adding missing essentials: TV, Washer, Smoke alarm, Free parking on premises.
- Consider adding popular differentiators like Dishes and silverware or Kitchen to increase appeal.
- Highlight unique or less common amenities you offer (e.g., hot tub, dedicated workspace, EV charger) in your listing description and photos.
- Regularly check competitor amenities in Mosman Park to stay competitive.
Mosman Park Airbnb Guest Demographics & Profile Analysis (2026)
Guest Profile Summary for Mosman Park
- The typical guest profile for Airbnb in Mosman Park consists of a mix of domestic (49%) and international guests, with top international origins including United Kingdom, typically belonging to the Post-2000s (Gen Z/Alpha) group (50%), primarily speaking English or Chinese.
- Domestic travelers account for 49.3% of guests.
- Key international markets include Australia (49.3%) and United Kingdom (14.1%).
- Top languages spoken are English (59.7%) followed by Chinese (7.7%).
- A significant demographic segment is the Post-2000s (Gen Z/Alpha) group, representing 50% of guests.
Recommendations for Hosts
- Balance marketing efforts between domestic and international channels based on the guest mix.
- Tailor amenities and listing descriptions to appeal to the dominant Post-2000s (Gen Z/Alpha) demographic (e.g., highlight fast WiFi, smart home features, local guides).
- Highlight unique local experiences or amenities relevant to the primary guest profile.
- Consider seasonal promotions aligned with peak travel times for key origin markets.
Nearby Short-Term Rental Market Comparison
How does the Mosman Park Airbnb market stack up against its neighbors? Compare key performance metrics like average monthly revenue, ADR, and occupancy rates in surrounding areas to understand the broader regional STR landscape.
| Market | Active Properties | Monthly Revenue | Daily Rate | Avg. Occupancy |
|---|---|---|---|---|
| Gracetown | 39 | $4,612 | $393.93 | 44% |
| Cottesloe | 143 | $4,049 | $242.67 | 66% |
| Yallingup | 249 | $4,011 | $371.66 | 45% |
| Margaret River | 427 | $3,939 | $230.54 | 60% |
| Gnarabup | 94 | $3,814 | $276.21 | 50% |
| City of Joondalup | 52 | $3,605 | $252.97 | 57% |
| Peppermint Grove Beach | 38 | $3,549 | $342.65 | 41% |
| Prevelly | 43 | $3,508 | $237.69 | 57% |
| City Of Busselton | 558 | $3,499 | $313.72 | 42% |
| Cowaramup | 44 | $3,370 | $224.59 | 54% |