Peppermint Grove Beach Airbnb Market Analysis 2026: Short Term Rental Data & Vacation Rental Statistics in Western Australia, Australia
Is Airbnb profitable in Peppermint Grove Beach in 2026? Explore comprehensive Airbnb analytics for Peppermint Grove Beach, Western Australia, Australia to uncover income potential. This 2026 STR market report for Peppermint Grove Beach, based on AirROI data from February 2025 to January 2026, reveals key trends in the niche market of 38 active listings.
Whether you're considering an Airbnb investment in Peppermint Grove Beach, optimizing your existing vacation rental, or exploring rental arbitrage opportunities, understanding the Peppermint Grove Beach Airbnb data is crucial. Navigating the high regulation landscape is key to maximizing your short term rental income potential. Let's dive into the specifics.
Key Peppermint Grove Beach Airbnb Performance Metrics Overview
Monthly Airbnb Revenue Variations & Income Potential in Peppermint Grove Beach (2026)
Understanding the monthly revenue variations for Airbnb listings in Peppermint Grove Beach is key to maximizing your short term rental income potential. Seasonality significantly impacts earnings. Our analysis, based on data from the past 12 months, shows that the peak revenue month for STRs in Peppermint Grove Beach is typically December, while August often presents the lowest earnings, highlighting opportunities for strategic pricing adjustments during shoulder and low seasons. Explore the typical Airbnb income in Peppermint Grove Beach across different performance tiers:
- Best-in-class properties (Top 10%) achieve $7,529+ monthly, often utilizing dynamic pricing and superior guest experiences.
- Strong performing properties (Top 25%) earn $5,229 or more, indicating effective management and desirable locations/amenities.
- Typical properties (Median) generate around $3,723 per month, representing the average market performance.
- Entry-level properties (Bottom 25%) see earnings around $1,850, often with potential for optimization.
Average Monthly Airbnb Earnings Trend in Peppermint Grove Beach
Peppermint Grove Beach Airbnb Occupancy Rate Trends (2026)
Maximize your bookings by understanding the Peppermint Grove Beach STR occupancy trends. Seasonal demand shifts significantly influence how often properties are booked. Typically, Decembersees the highest demand (peak season occupancy), while August experiences the lowest (low season). Effective strategies, like adjusting minimum stays or offering promotions, can boost occupancy during slower periods. Here's how different property tiers perform in Peppermint Grove Beach:
- Best-in-class properties (Top 10%) achieve 74%+ occupancy, indicating high desirability and potentially optimized availability.
- Strong performing properties (Top 25%) maintain 57% or higher occupancy, suggesting good market fit and guest satisfaction.
- Typical properties (Median) have an occupancy rate around 38%.
- Entry-level properties (Bottom 25%) average 21% occupancy, potentially facing higher vacancy.
Average Monthly Occupancy Rate Trend in Peppermint Grove Beach
Average Daily Rate (ADR) Airbnb Trends in Peppermint Grove Beach (2026)
Effective short term rental pricing strategy in Peppermint Grove Beach involves understanding monthly ADR fluctuations. The Average Daily Rate (ADR) for Airbnb in Peppermint Grove Beach typically peaks in January and dips lowest during August. Leveraging Airbnb dynamic pricing tools or strategies based on this seasonality can significantly boost revenue. Here's a look at the typical nightly rates achieved:
- Best-in-class properties (Top 10%) command rates of $577+ per night, often due to premium features or locations.
- Strong performing properties (Top 25%) achieve nightly rates of $406 or more.
- Typical properties (Median) charge around $289 per night.
- Entry-level properties (Bottom 25%) earn around $204 per night.
Average Daily Rate (ADR) Trend by Month in Peppermint Grove Beach
Get Live Peppermint Grove Beach Market Intelligence 👇

Explore Real-time Analytics
Airbnb Seasonality Analysis & Trends in Peppermint Grove Beach (2026)
Peak Season (December, January, April)
- Revenue averages $5,664 per month
- Occupancy rates average 50.9%
- Daily rates average $356
Shoulder Season
- Revenue averages $3,959 per month
- Occupancy maintains around 39.9%
- Daily rates hold near $328
Low Season (June, August, September)
- Revenue drops to average $2,831 per month
- Occupancy decreases to average 32.9%
- Daily rates adjust to average $315
Seasonality Insights for Peppermint Grove Beach
- The Airbnb seasonality in Peppermint Grove Beach shows highly seasonal trends requiring careful strategy. While the sections above show seasonal averages, it's also insightful to look at the extremes:
- During the high season, the absolute peak month showcases Peppermint Grove Beach's highest earning potential, with monthly revenues capable of climbing to $6,126, occupancy reaching a high of 55.8%, and ADRs peaking at $370.
- Conversely, the slowest single month of the year, typically falling within the low season, marks the market's lowest point. In this month, revenue might dip to $2,583, occupancy could drop to 32.1%, and ADRs may adjust down to $301.
- Understanding both the seasonal averages and these monthly peaks and troughs in revenue, occupancy, and ADR is crucial for maximizing your Airbnb profit potential in Peppermint Grove Beach.
Seasonal Strategies for Maximizing Profit
- Peak Season: Maximize revenue through premium pricing and potentially longer minimum stays. Ensure high availability.
- Low Season: Offer competitive pricing, special promotions (e.g., extended stay discounts), and flexible cancellation policies. Target off-season travelers like remote workers or budget-conscious guests.
- Shoulder Seasons: Implement dynamic pricing that balances peak and low rates. Target weekend travelers or specific events. Offer slightly more flexible terms than peak season.
- Regularly analyze your own performance against these Peppermint Grove Beach seasonality benchmarks and adjust your pricing and availability strategy accordingly.
Best Areas for Airbnb Investment in Peppermint Grove Beach (2026)
Exploring the top neighborhoods for short-term rentals in Peppermint Grove Beach? This section highlights key areas, outlining why they are attractive for hosts and guests, along with notable local attractions. Consider these locations based on your target guest profile and investment strategy.
| Neighborhood / Area | Why Host Here? (Target Guests & Appeal) | Key Attractions & Landmarks |
|---|---|---|
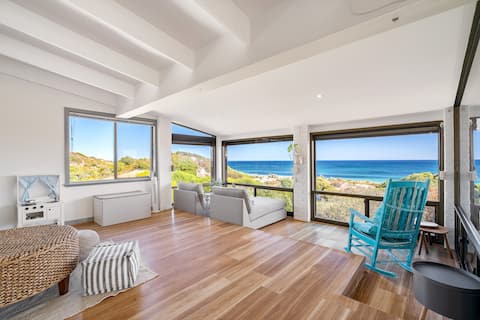
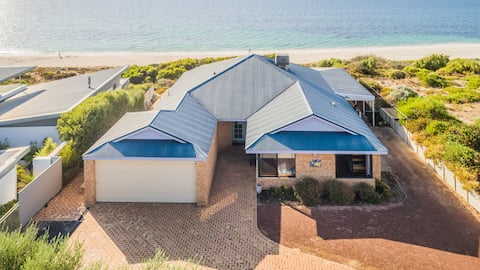
| Peppermint Grove Beach | A tranquil coastal location known for its beautiful beaches and relaxed atmosphere. Ideal for families, couples, and anyone looking to enjoy a peaceful getaway by the ocean. | Peppermint Grove Beach, Leschenault Estuary, Collie River, Binningup Beach, Local wildlife parks, Natural bushland walks |
| Binningup | A small coastal community known for its pristine beaches and friendly vibe. It offers great opportunities for swimming, fishing, and surfing, attracting visitors looking for outdoor adventures. | Binningup Beach, Binningup Surf Life Saving Club, Nearby natural reserves, Fishing spots, Picnic areas, Walking trails |
| Bunbury | The closest larger city with a vibrant arts scene, restaurants, and access to the famous dolphin sanctuary. Draws in tourists looking for urban amenities while still being near the coast. | Dolphin Discovery Centre, Bunbury Wildlife Park, Bunbury Regional Art Galleries, Koombana Bay, Leschenault Inlet |
| Dalyellup Beach | Known for its family-friendly atmosphere and beautiful beach, it attracts visitors seeking a relaxing coastal setting near Bunbury. | Dalyellup Beach, Dalyellup Regional Park, Local cafes and shops, Walk trails along the coast, Family playgrounds |
| Capel | A green, pastoral area with vineyards and wineries, appealing to those interested in wine tourism and scenic countryside retreats. | Capel Vale Winery, Capel Golf Club, Local markets, Walking trails, Beautiful scenery of vineyards |
| Margaret River | A global wine region famed for its stunning landscapes and adventurous activities. Appeals to tourists wanting gourmet experiences and natural beauty. | Margaret River Wine Region, Surf beaches, Caves and walking trails, Local tasting rooms and breweries, Margaret River township |
| Harvey | A charming town known for its agriculture and scenic drives. Attracts visitors interested in local produce and regional experiences. | Harvey Dam, Harvey Cheese Co., Local fruit farms, Scenic helicopter rides, Harvey Heritage Trail |
| Wellington National Park | A beautiful natural area offering outdoor adventures such as hiking, camping, and swimming. Great for ecotourism and nature lovers. | Wellington Dam, Hiking trails, Picnic areas, Camping spots, Wildlife watching opportunities |
Understanding Airbnb License Requirements & STR Laws in Peppermint Grove Beach (2026)
Yes, Peppermint Grove Beach, Western Australia, Australia enforces high STR regulations. Obtaining a license and ensuring compliance is almost certainly required according to current 2026 STR laws. Always verify the latest short term rental regulations and Airbnb license requirements directly with local government authorities for Peppermint Grove Beach to ensure full compliance before hosting.
(Source: AirROI data, 2026, based on 97% licensed listings)
Top Performing Airbnb Properties in Peppermint Grove Beach (2026)
Benchmark your potential! Explore examples of top-performing Airbnb properties in Peppermint Grove Beachbased on Trailing Twelve Month (TTM) revenue. Analyze their characteristics, revenue, occupancy rate, and ADR to understand what drives success in this market.
Beachfront Mansion by Peppy Beach Retreats®
Entire Place • 6 bedrooms

Seaview Residence by Peppy Beach Retreats®
Entire Place • 7 bedrooms
Oceanside beach house with Wifi
Entire Place • 4 bedrooms

Aurora Beach House @ Peppi Beach
Entire Place • 4 bedrooms

The Beach House - Holiday home with ocean views.
Entire Place • 3 bedrooms

Peppermint Rise
Entire Place • 4 bedrooms
Note: Performance varies based on location, size, amenities, seasonality, and management quality. Data reflects the past 12 months.
Top Performing Airbnb Hosts in Peppermint Grove Beach (2026)
Learn from the best! This table showcases top-performing Airbnb hosts in Peppermint Grove Beach based on the number of properties managed and estimated total revenue over the past year. Analyze their scale and performance metrics.
| Host Name | Properties | Grossing Revenue | Stay Reviews | Avg Rating |
|---|---|---|---|---|
| Peppy Beach Retreats | 9 | $511,084 | 195 | 4.95/5.0 |
| Jana | 4 | $174,320 | 93 | 4.77/5.0 |
| Geographe Holiday Homes | 3 | $137,313 | 47 | 4.81/5.0 |
| Shelley | 2 | $118,355 | 74 | 4.89/5.0 |
| Sarah | 1 | $71,271 | 178 | 4.94/5.0 |
| Craig | 1 | $67,639 | 82 | 4.98/5.0 |
| Victoria | 1 | $67,509 | 114 | 4.99/5.0 |
| Renee | 1 | $49,539 | 355 | 4.83/5.0 |
| Greg & Sabrina | 1 | $47,755 | 106 | 4.96/5.0 |
| DownSouth Holiday Homes | 1 | $46,333 | 11 | 4.82/5.0 |
Analyzing the strategies of top hosts, such as their property selection, pricing, and guest communication, can offer valuable lessons for optimizing your own Airbnb operations in Peppermint Grove Beach.
Dive Deeper: Advanced Peppermint Grove Beach STR Market Data (2026)
Ready to unlock more insights? AirROI provides access to advanced metrics and comprehensive Airbnb data for Peppermint Grove Beach. Explore detailed analytics beyond this report to refine your investment strategy, optimize pricing, and maximize your vacation rental profits.
Explore Advanced MetricsPeppermint Grove Beach Short-Term Rental Market Composition (2026): Property & Room Types
Room Type Distribution
Property Type Distribution
Market Composition Insights for Peppermint Grove Beach
- The Peppermint Grove Beach Airbnb market composition is heavily skewed towards Entire Home/Apt listings, which make up 97.4% of the 38 active rentals. This indicates strong guest preference for privacy and space.
- Looking at the property type distribution in Peppermint Grove Beach, House properties are the most common (94.7%), reflecting the local real estate landscape.
- Houses represent a significant 94.7% portion, catering likely to families or larger groups.
- Smaller segments like hotel/boutique, apartment/condo (combined 5.2%) offer potential for unique stay experiences.
Peppermint Grove Beach Airbnb Room Capacity Analysis (2026): Bedroom Distribution
Distribution of Listings by Number of Bedrooms
Room Capacity Insights for Peppermint Grove Beach
- The dominant room capacity in Peppermint Grove Beach is 4 bedrooms listings, making up 34.2% of the market. This suggests a strong demand for properties suitable for families or small groups.
- Together, 4 bedrooms and 5+ bedrooms properties represent 60.5% of the active Airbnb listings in Peppermint Grove Beach, indicating a high concentration in these sizes.
- A significant 78.9% of listings offer 3+ bedrooms, catering to larger groups and families seeking more space in Peppermint Grove Beach.
Peppermint Grove Beach Vacation Rental Guest Capacity Trends (2026)
Distribution of Listings by Guest Capacity
Guest Capacity Insights for Peppermint Grove Beach
- The most common guest capacity trend in Peppermint Grove Beach vacation rentals is listings accommodating 8+ guests (65.8%). This suggests the primary traveler segment is likely larger groups.
- Properties designed for 8+ guests and 6 guests dominate the Peppermint Grove Beach STR market, accounting for 86.9% of listings.
- 86.9% of properties accommodate 6+ guests, serving the market segment for larger families or group travel in Peppermint Grove Beach.
- On average, properties in Peppermint Grove Beach are equipped to host 6.9 guests.
Peppermint Grove Beach Airbnb Booking Patterns (2026): Available vs. Booked Days
Available Days Distribution
Booked Days Distribution
Booking Pattern Insights for Peppermint Grove Beach
- The most common availability pattern in Peppermint Grove Beach falls within the 181-270 days range, representing 39.5% of listings. This suggests many properties have significant open periods on their calendars.
- Approximately 76.3% of listings show high availability (181+ days open annually), indicating potential for increased bookings or specific owner usage patterns.
- For booked days, the 91-180 days range is most frequent in Peppermint Grove Beach (42.1%), reflecting common guest stay durations or potential owner blocking patterns.
- A notable 23.7% of properties secure long booking periods (181+ days booked per year), highlighting successful long-term rental strategies or significant owner usage.
Peppermint Grove Beach Airbnb Minimum Stay Requirements Analysis
Distribution of Listings by Minimum Night Requirement
1 Night
9 listings
23.7% of total
2 Nights
4 listings
10.5% of total
3 Nights
4 listings
10.5% of total
4-6 Nights
3 listings
7.9% of total
30+ Nights
18 listings
47.4% of total
Key Insights
- The most prevalent minimum stay requirement in Peppermint Grove Beach is 30+ Nights, adopted by 47.4% of listings. This highlights the market's preference for longer commitments.
- A significant segment (47.4%) caters to monthly stays (30+ nights) in Peppermint Grove Beach, pointing to opportunities in the extended-stay market.
Recommendations
- Align with the market by considering a 30+ Nights minimum stay, as 47.4% of Peppermint Grove Beach hosts use this setting.
- If feasible, allowing 1-night stays, especially midweek or during low season, could capture last-minute bookings, as only 23.7% currently do.
- Explore offering discounts for stays of 30+ nights to attract the 47.4% of the market seeking extended stays.
- Adjust minimum nights based on seasonality – potentially shorter during low season and longer during peak demand periods in Peppermint Grove Beach.
Peppermint Grove Beach Airbnb Cancellation Policy Trends Analysis (2026)
Super Strict 30 Days
3 listings
7.9% of total
Super Strict 60 Days
10 listings
26.3% of total
Moderate
9 listings
23.7% of total
Firm
14 listings
36.8% of total
Strict
2 listings
5.3% of total
Cancellation Policy Insights for Peppermint Grove Beach
- The prevailing Airbnb cancellation policy trend in Peppermint Grove Beach is Firm, used by 36.8% of listings.
- There's a relatively balanced mix between guest-friendly (23.7%) and stricter (42.1%) policies, offering choices for different guest needs.
- Strict cancellation policies are quite rare (5.3%), potentially making listings with this policy less competitive unless justified by high demand or property type.
Recommendations for Hosts
- Consider adopting a Firm policy to align with the 36.8% market standard in Peppermint Grove Beach.
- Using a Strict policy might deter some guests, as only 5.3% of listings use it. Evaluate if potential revenue protection outweighs possible lower booking rates.
- Regularly review your cancellation policy against competitors and market demand shifts in Peppermint Grove Beach.
Peppermint Grove Beach STR Booking Lead Time Analysis (2026)
Average Booking Lead Time by Month
Booking Lead Time Insights for Peppermint Grove Beach
- The overall average booking lead time for vacation rentals in Peppermint Grove Beach is 83 days.
- Guests book furthest in advance for stays during December (average 162 days), likely coinciding with peak travel demand or local events.
- The shortest booking windows occur for stays in August (average 54 days), indicating more last-minute travel plans during this time.
- Seasonally, Winter (123 days avg.) sees the longest lead times, while Summer (57 days avg.) has the shortest, reflecting typical travel planning cycles.
Recommendations for Hosts
- Use the overall average lead time (83 days) as a baseline for your pricing and availability strategy in Peppermint Grove Beach.
- For December stays, consider implementing length-of-stay discounts or slightly higher rates for bookings made less than 162 days out to capitalize on advance planning.
- Target marketing efforts for the Winter season well in advance (at least 123 days) to capture early planners.
- Monitor your own booking lead times against these Peppermint Grove Beach averages to identify opportunities for dynamic pricing adjustments.
Popular & Essential Airbnb Amenities in Peppermint Grove Beach (2026)
Amenity Prevalence
Amenity Insights for Peppermint Grove Beach
- Essential amenities in Peppermint Grove Beach that guests expect include: Free parking on premises, Heating. Lacking these (any) could significantly impact bookings.
- Popular amenities like Smoke alarm, TV, Refrigerator are common but not universal. Offering these can provide a competitive edge.
- Warning: Wifi is not universally provided but is considered essential globally. Ensure reliable Wifi is offered.
Recommendations for Hosts
- Ensure your listing includes all essential amenities for Peppermint Grove Beach: Free parking on premises, Heating.
- Prioritize adding missing essentials: Heating.
- Consider adding popular differentiators like Smoke alarm or TV to increase appeal.
- Highlight unique or less common amenities you offer (e.g., hot tub, dedicated workspace, EV charger) in your listing description and photos.
- Regularly check competitor amenities in Peppermint Grove Beach to stay competitive.
Peppermint Grove Beach Airbnb Guest Demographics & Profile Analysis (2026)
Guest Profile Summary for Peppermint Grove Beach
- The typical guest profile for Airbnb in Peppermint Grove Beach consists of primarily domestic travelers (83%), often arriving from nearby Perth, typically belonging to the Post-2000s (Gen Z/Alpha) group (50%), primarily speaking English or French.
- Domestic travelers account for 82.8% of guests.
- Key international markets include Australia (82.8%) and Singapore (4.3%).
- Top languages spoken are English (65.6%) followed by French (5.4%).
- A significant demographic segment is the Post-2000s (Gen Z/Alpha) group, representing 50% of guests.
Recommendations for Hosts
- Target domestic marketing efforts towards travelers from Perth and Western Australia.
- Tailor amenities and listing descriptions to appeal to the dominant Post-2000s (Gen Z/Alpha) demographic (e.g., highlight fast WiFi, smart home features, local guides).
- Highlight unique local experiences or amenities relevant to the primary guest profile.
- Consider seasonal promotions aligned with peak travel times for key origin markets.
Nearby Short-Term Rental Market Comparison
How does the Peppermint Grove Beach Airbnb market stack up against its neighbors? Compare key performance metrics like average monthly revenue, ADR, and occupancy rates in surrounding areas to understand the broader regional STR landscape.
| Market | Active Properties | Monthly Revenue | Daily Rate | Avg. Occupancy |
|---|---|---|---|---|
| Gracetown | 39 | $4,612 | $393.93 | 44% |
| Witchcliffe | 22 | $4,027 | $236.22 | 60% |
| Yallingup | 249 | $4,011 | $371.66 | 45% |
| Margaret River | 427 | $3,939 | $230.54 | 60% |
| Gnarabup | 94 | $3,814 | $276.21 | 50% |
| Shire Of Augusta Margaret River | 90 | $3,552 | $254.69 | 53% |
| Prevelly | 43 | $3,508 | $237.69 | 57% |
| City Of Busselton | 558 | $3,499 | $313.72 | 42% |
| Cowaramup | 44 | $3,370 | $224.59 | 54% |
| North Fremantle | 30 | $3,370 | $203.37 | 64% |