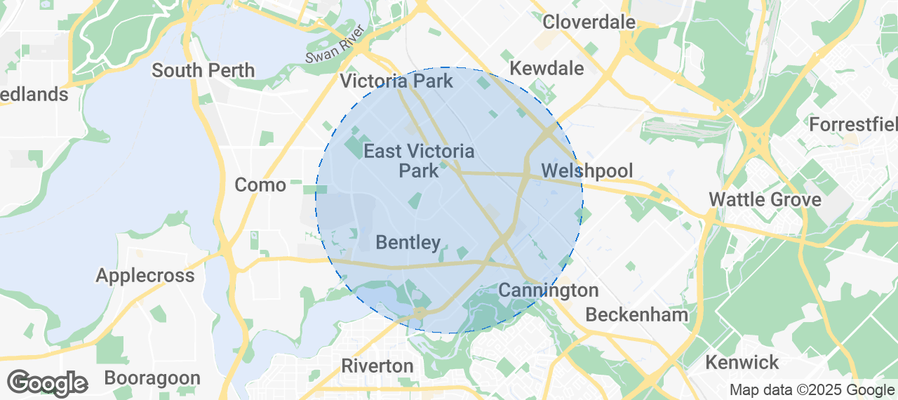
Saint James Airbnb Market Analysis 2026: Short Term Rental Data & Vacation Rental Statistics in Western Australia, Australia
Is Airbnb profitable in Saint James in 2026? Explore comprehensive Airbnb analytics for Saint James, Western Australia, Australia to uncover income potential. This 2026 STR market report for Saint James, based on AirROI data from February 2025 to January 2026, reveals key trends in the niche market of 25 active listings.
Whether you're considering an Airbnb investment in Saint James, optimizing your existing vacation rental, or exploring rental arbitrage opportunities, understanding the Saint James Airbnb data is crucial. Navigating the high regulation landscape is key to maximizing your short term rental income potential. Let's dive into the specifics.
Key Saint James Airbnb Performance Metrics Overview
Monthly Airbnb Revenue Variations & Income Potential in Saint James (2026)
Understanding the monthly revenue variations for Airbnb listings in Saint James is key to maximizing your short term rental income potential. Seasonality significantly impacts earnings. Our analysis, based on data from the past 12 months, shows that the peak revenue month for STRs in Saint James is typically March, while May often presents the lowest earnings, highlighting opportunities for strategic pricing adjustments during shoulder and low seasons. Explore the typical Airbnb income in Saint James across different performance tiers:
- Best-in-class properties (Top 10%) achieve $3,568+ monthly, often utilizing dynamic pricing and superior guest experiences.
- Strong performing properties (Top 25%) earn $2,128 or more, indicating effective management and desirable locations/amenities.
- Typical properties (Median) generate around $1,051 per month, representing the average market performance.
- Entry-level properties (Bottom 25%) see earnings around $628, often with potential for optimization.
Average Monthly Airbnb Earnings Trend in Saint James
Saint James Airbnb Occupancy Rate Trends (2026)
Maximize your bookings by understanding the Saint James STR occupancy trends. Seasonal demand shifts significantly influence how often properties are booked. Typically, Marchsees the highest demand (peak season occupancy), while January experiences the lowest (low season). Effective strategies, like adjusting minimum stays or offering promotions, can boost occupancy during slower periods. Here's how different property tiers perform in Saint James:
- Best-in-class properties (Top 10%) achieve 85%+ occupancy, indicating high desirability and potentially optimized availability.
- Strong performing properties (Top 25%) maintain 74% or higher occupancy, suggesting good market fit and guest satisfaction.
- Typical properties (Median) have an occupancy rate around 45%.
- Entry-level properties (Bottom 25%) average 31% occupancy, potentially facing higher vacancy.
Average Monthly Occupancy Rate Trend in Saint James
Average Daily Rate (ADR) Airbnb Trends in Saint James (2026)
Effective short term rental pricing strategy in Saint James involves understanding monthly ADR fluctuations. The Average Daily Rate (ADR) for Airbnb in Saint James typically peaks in November and dips lowest during August. Leveraging Airbnb dynamic pricing tools or strategies based on this seasonality can significantly boost revenue. Here's a look at the typical nightly rates achieved:
- Best-in-class properties (Top 10%) command rates of $245+ per night, often due to premium features or locations.
- Strong performing properties (Top 25%) achieve nightly rates of $107 or more.
- Typical properties (Median) charge around $79 per night.
- Entry-level properties (Bottom 25%) earn around $53 per night.
Average Daily Rate (ADR) Trend by Month in Saint James
Get Live Saint James Market Intelligence 👇
Explore Real-time Analytics
Airbnb Seasonality Analysis & Trends in Saint James (2026)
Peak Season (March, April, February)
- Revenue averages $1,863 per month
- Occupancy rates average 72.5%
- Daily rates average $88
Shoulder Season
- Revenue averages $1,528 per month
- Occupancy maintains around 46.0%
- Daily rates hold near $112
Low Season (May, August, October)
- Revenue drops to average $1,332 per month
- Occupancy decreases to average 42.9%
- Daily rates adjust to average $101
Seasonality Insights for Saint James
- The Airbnb seasonality in Saint James shows moderate seasonality with distinct peak and low periods. While the sections above show seasonal averages, it's also insightful to look at the extremes:
- During the high season, the absolute peak month showcases Saint James's highest earning potential, with monthly revenues capable of climbing to $1,975, occupancy reaching a high of 76.6%, and ADRs peaking at $134.
- Conversely, the slowest single month of the year, typically falling within the low season, marks the market's lowest point. In this month, revenue might dip to $1,146, occupancy could drop to 35.6%, and ADRs may adjust down to $87.
- Understanding both the seasonal averages and these monthly peaks and troughs in revenue, occupancy, and ADR is crucial for maximizing your Airbnb profit potential in Saint James.
Seasonal Strategies for Maximizing Profit
- Peak Season: Maximize revenue through premium pricing and potentially longer minimum stays. Ensure high availability.
- Low Season: Offer competitive pricing, special promotions (e.g., extended stay discounts), and flexible cancellation policies. Target off-season travelers like remote workers or budget-conscious guests.
- Shoulder Seasons: Implement dynamic pricing that balances peak and low rates. Target weekend travelers or specific events. Offer slightly more flexible terms than peak season.
- Regularly analyze your own performance against these Saint James seasonality benchmarks and adjust your pricing and availability strategy accordingly.
Best Areas for Airbnb Investment in Saint James (2026)
Exploring the top neighborhoods for short-term rentals in Saint James? This section highlights key areas, outlining why they are attractive for hosts and guests, along with notable local attractions. Consider these locations based on your target guest profile and investment strategy.
| Neighborhood / Area | Why Host Here? (Target Guests & Appeal) | Key Attractions & Landmarks |
|---|---|---|
| Dunsborough | A popular coastal town known for its stunning beaches and proximity to wine regions. Ideal for families and couples looking for a getaway in a scenic environment. | Meelup Beach, Cape Naturaliste Lighthouse, Dunsborough Beach, Busselton Jetty, Margaret River wineries, Ngilgi Cave |
| Busselton | Famous for its long jetty and beautiful coastline, Busselton attracts tourists looking for beach activities and nature excursions. A great spot for families and adventure seekers. | Busselton Jetty, Busselton Foreshore, Wonnerup House, Geographe Bay, Whale watching, Local restaurants and cafes |
| Margaret River | Renowned for its wineries and gourmet food scene, Margaret River draws tourists who appreciate fine dining, wine tasting, and scenic views. | Margaret River Wine Region, Cape Leeuwin Lighthouse, Margaret River Surf Beaches, Boranup Forest, Local Market, Prevail Surf Academy |
| Yallingup | A beautiful coastal area famous for its surf breaks and stunning natural scenery, attracting surfers and beach lovers alike. | Yallingup Beach, Canal Rocks, Ngilgi Cave, Yallingup Maze, Local wineries, Caves Road |
| Gracetown | A quaint township near Margaret River, popular for its surf breaks and relaxed atmosphere, making it appealing to both surfers and families. | Gracetown Beach, Cowaramup Bay, Surfers Point, Local wineries, Scenic walks along the coast, Cave exploration |
| Eagle Bay | Known for its pristine beaches and upscale holiday homes, Eagle Bay is sought after by those looking for luxury beachfront experiences. | Eagle Bay Beach, Bunker Bay, Cape Naturaliste National Park, Local art galleries, Fishing and water sports, Nearby wineries |
| Smiths Beach | A stunning beach location popular for its surfing and family-friendly environment, perfect for beach holidays and water sports. | Smiths Beach, Smiths Beach Resort, Nearby surf schools, Scenic coastal walks, Local dining options, Wildlife spotting |
| Northcliffe | A hidden gem in the South West, Northcliffe offers a tranquil rural experience and access to beautiful forests and beaches, suited for nature lovers. | Northcliffe Forest Park, Nearby beaches, Black Point, Crawley Beach, Wilderness trails, Local art and crafts |
Understanding Airbnb License Requirements & STR Laws in Saint James (2026)
Yes, Saint James, Western Australia, Australia enforces high STR regulations. Obtaining a license and ensuring compliance is almost certainly required according to current 2026 STR laws. Always verify the latest short term rental regulations and Airbnb license requirements directly with local government authorities for Saint James to ensure full compliance before hosting.
(Source: AirROI data, 2026, based on 100% licensed listings)
Top Performing Airbnb Properties in Saint James (2026)
Benchmark your potential! Explore examples of top-performing Airbnb properties in Saint Jamesbased on Trailing Twelve Month (TTM) revenue. Analyze their characteristics, revenue, occupancy rate, and ADR to understand what drives success in this market.

Clean&Comfy house C in Perth,close to CBD&Airport
Entire Place • 4 bedrooms

VJs Guesthouse
Entire Place • 2 bedrooms

Delightful Home short walk to Curtin University 3
Entire Place • 3 bedrooms

Whole House! | 3 bedrooms | Premium kitchen&living
Entire Place • 3 bedrooms

Family Suite nr Vic Pk,Curtin Uni,Airport & Perth
Entire Place • 2 bedrooms

2A Self-Contained Studio Apt. Vic Pk,Airport,Perth
Entire Place • 1 bedroom
Note: Performance varies based on location, size, amenities, seasonality, and management quality. Data reflects the past 12 months.
Top Performing Airbnb Hosts in Saint James (2026)
Learn from the best! This table showcases top-performing Airbnb hosts in Saint James based on the number of properties managed and estimated total revenue over the past year. Analyze their scale and performance metrics.
| Host Name | Properties | Grossing Revenue | Stay Reviews | Avg Rating |
|---|---|---|---|---|
| Acomm Australia | 12 | $116,850 | 164 | 4.85/5.0 |
| Nathan | 4 | $56,250 | 217 | 4.78/5.0 |
| Sau Chung | 1 | $44,380 | 53 | 4.85/5.0 |
| Michelle | 1 | $39,939 | 44 | 4.98/5.0 |
| Lisa | 4 | $30,137 | 127 | 4.88/5.0 |
| Chris | 1 | $21,872 | 174 | 4.63/5.0 |
| UC Stay | 1 | $17,349 | 47 | 4.91/5.0 |
| Live | 1 | $1,256 | 2 | Not Rated |
Analyzing the strategies of top hosts, such as their property selection, pricing, and guest communication, can offer valuable lessons for optimizing your own Airbnb operations in Saint James.
Dive Deeper: Advanced Saint James STR Market Data (2026)
Ready to unlock more insights? AirROI provides access to advanced metrics and comprehensive Airbnb data for Saint James. Explore detailed analytics beyond this report to refine your investment strategy, optimize pricing, and maximize your vacation rental profits.
Explore Advanced MetricsSaint James Short-Term Rental Market Composition (2026): Property & Room Types
Room Type Distribution
Property Type Distribution
Market Composition Insights for Saint James
- The Saint James Airbnb market composition is heavily skewed towards Private Room listings, which make up 68% of the 25 active rentals. This indicates strong guest preference for privacy and space.
- Looking at the property type distribution in Saint James, House properties are the most common (92%), reflecting the local real estate landscape.
- Houses represent a significant 92% portion, catering likely to families or larger groups.
- Smaller segments like others, hotel/boutique (combined 8.0%) offer potential for unique stay experiences.
Saint James Airbnb Room Capacity Analysis (2026): Bedroom Distribution
Distribution of Listings by Number of Bedrooms
Room Capacity Insights for Saint James
- The dominant room capacity in Saint James is 3 bedrooms listings, making up 16% of the market. This suggests a strong demand for properties suitable for families or small groups.
- Together, 3 bedrooms and 1 bedroom properties represent 24.0% of the active Airbnb listings in Saint James, indicating a high concentration in these sizes.
Saint James Vacation Rental Guest Capacity Trends (2026)
Distribution of Listings by Guest Capacity
Guest Capacity Insights for Saint James
- The most common guest capacity trend in Saint James vacation rentals is listings accommodating 4 guests (16%). This suggests the primary traveler segment is likely small families or groups.
- Properties designed for 4 guests and 6 guests dominate the Saint James STR market, accounting for 24.0% of listings.
- On average, properties in Saint James are equipped to host 1.5 guests.
Saint James Airbnb Booking Patterns (2026): Available vs. Booked Days
Available Days Distribution
Booked Days Distribution
Booking Pattern Insights for Saint James
- The most common availability pattern in Saint James falls within the 271-366 days range, representing 40% of listings. This suggests many properties have significant open periods on their calendars.
- Approximately 64.0% of listings show high availability (181+ days open annually), indicating potential for increased bookings or specific owner usage patterns.
- For booked days, the 31-90 days range is most frequent in Saint James (40%), reflecting common guest stay durations or potential owner blocking patterns.
- A notable 36.0% of properties secure long booking periods (181+ days booked per year), highlighting successful long-term rental strategies or significant owner usage.
Saint James Airbnb Minimum Stay Requirements Analysis
Distribution of Listings by Minimum Night Requirement
1 Night
6 listings
24% of total
2 Nights
1 listings
4% of total
3 Nights
1 listings
4% of total
4-6 Nights
1 listings
4% of total
30+ Nights
16 listings
64% of total
Key Insights
- The most prevalent minimum stay requirement in Saint James is 30+ Nights, adopted by 64% of listings. This highlights the market's preference for longer commitments.
- A significant segment (64%) caters to monthly stays (30+ nights) in Saint James, pointing to opportunities in the extended-stay market.
Recommendations
- Align with the market by considering a 30+ Nights minimum stay, as 64% of Saint James hosts use this setting.
- If feasible, allowing 1-night stays, especially midweek or during low season, could capture last-minute bookings, as only 24% currently do.
- Explore offering discounts for stays of 30+ nights to attract the 64% of the market seeking extended stays.
- Adjust minimum nights based on seasonality – potentially shorter during low season and longer during peak demand periods in Saint James.
Saint James Airbnb Cancellation Policy Trends Analysis (2026)
Flexible
12 listings
48% of total
Moderate
5 listings
20% of total
Firm
2 listings
8% of total
Strict
6 listings
24% of total
Cancellation Policy Insights for Saint James
- The prevailing Airbnb cancellation policy trend in Saint James is Flexible, used by 48% of listings.
- There's a relatively balanced mix between guest-friendly (68.0%) and stricter (32.0%) policies, offering choices for different guest needs.
Recommendations for Hosts
- Consider adopting a Flexible policy to align with the 48% market standard in Saint James.
- Regularly review your cancellation policy against competitors and market demand shifts in Saint James.
Saint James STR Booking Lead Time Analysis (2026)
Average Booking Lead Time by Month
Booking Lead Time Insights for Saint James
- The overall average booking lead time for vacation rentals in Saint James is 23 days.
- Guests book furthest in advance for stays during April (average 35 days), likely coinciding with peak travel demand or local events.
- The shortest booking windows occur for stays in May (average 17 days), indicating more last-minute travel plans during this time.
- Seasonally, Spring (25 days avg.) sees the longest lead times, while Summer (23 days avg.) has the shortest, reflecting typical travel planning cycles.
Recommendations for Hosts
- Use the overall average lead time (23 days) as a baseline for your pricing and availability strategy in Saint James.
- For April stays, consider implementing length-of-stay discounts or slightly higher rates for bookings made less than 35 days out to capitalize on advance planning.
- Target marketing efforts for the Spring season well in advance (at least 25 days) to capture early planners.
- Monitor your own booking lead times against these Saint James averages to identify opportunities for dynamic pricing adjustments.
Popular & Essential Airbnb Amenities in Saint James (2026)
Amenity Prevalence
Amenity Insights for Saint James
- Essential amenities in Saint James that guests expect include: Kitchen, Wifi, Smoke alarm, Washer, Free parking on premises. Lacking these (any) could significantly impact bookings.
- Popular amenities like Dishes and silverware, Hangers, Hair dryer are common but not universal. Offering these can provide a competitive edge.
Recommendations for Hosts
- Ensure your listing includes all essential amenities for Saint James: Kitchen, Wifi, Smoke alarm, Washer, Free parking on premises.
- Prioritize adding missing essentials: Free parking on premises.
- Consider adding popular differentiators like Dishes and silverware or Hangers to increase appeal.
- Highlight unique or less common amenities you offer (e.g., hot tub, dedicated workspace, EV charger) in your listing description and photos.
- Regularly check competitor amenities in Saint James to stay competitive.
Saint James Airbnb Guest Demographics & Profile Analysis (2026)
Guest Profile Summary for Saint James
- The typical guest profile for Airbnb in Saint James consists of a mix of domestic (52%) and international guests, often arriving from nearby Perth, typically belonging to the Post-2000s (Gen Z/Alpha) group (50%), primarily speaking English or Chinese.
- Domestic travelers account for 51.6% of guests.
- Key international markets include Australia (51.6%) and Singapore (9%).
- Top languages spoken are English (51.9%) followed by Chinese (9.3%).
- A significant demographic segment is the Post-2000s (Gen Z/Alpha) group, representing 50% of guests.
Recommendations for Hosts
- Balance marketing efforts between domestic and international channels based on the guest mix.
- Tailor amenities and listing descriptions to appeal to the dominant Post-2000s (Gen Z/Alpha) demographic (e.g., highlight fast WiFi, smart home features, local guides).
- Highlight unique local experiences or amenities relevant to the primary guest profile.
- Consider seasonal promotions aligned with peak travel times for key origin markets.
Nearby Short-Term Rental Market Comparison
How does the Saint James Airbnb market stack up against its neighbors? Compare key performance metrics like average monthly revenue, ADR, and occupancy rates in surrounding areas to understand the broader regional STR landscape.
| Market | Active Properties | Monthly Revenue | Daily Rate | Avg. Occupancy |
|---|---|---|---|---|
| Gracetown | 39 | $4,612 | $393.93 | 44% |
| Cottesloe | 143 | $4,049 | $242.67 | 66% |
| Yallingup | 249 | $4,011 | $371.66 | 45% |
| Margaret River | 427 | $3,939 | $230.54 | 60% |
| Gnarabup | 94 | $3,814 | $276.21 | 50% |
| City of Joondalup | 52 | $3,605 | $252.97 | 57% |
| Peppermint Grove Beach | 38 | $3,549 | $342.65 | 41% |
| Prevelly | 43 | $3,508 | $237.69 | 57% |
| City Of Busselton | 558 | $3,499 | $313.72 | 42% |
| Cowaramup | 44 | $3,370 | $224.59 | 54% |