Florianópolis Airbnb Market Analysis 2026: Short Term Rental Data & Vacation Rental Statistics in Santa Catarina, Brazil
Is Airbnb profitable in Florianópolis in 2026? Explore comprehensive Airbnb analytics for Florianópolis, Santa Catarina, Brazil to uncover income potential. This 2026 STR market report for Florianópolis, based on AirROI data from February 2025 to January 2026, reveals key trends in the bustling market of 17,260 active listings.
Whether you're considering an Airbnb investment in Florianópolis, optimizing your existing vacation rental, or exploring rental arbitrage opportunities, understanding the Florianópolis Airbnb data is crucial. Leveraging the low regulation environment is key to maximizing your short term rental income potential. Let's dive into the specifics.
Key Florianópolis Airbnb Performance Metrics Overview
Monthly Airbnb Revenue Variations & Income Potential in Florianópolis (2026)
Understanding the monthly revenue variations for Airbnb listings in Florianópolis is key to maximizing your short term rental income potential. Seasonality significantly impacts earnings. Our analysis, based on data from the past 12 months, shows that the peak revenue month for STRs in Florianópolis is typically February, while June often presents the lowest earnings, highlighting opportunities for strategic pricing adjustments during shoulder and low seasons. Explore the typical Airbnb income in Florianópolis across different performance tiers:
- Best-in-class properties (Top 10%) achieve $2,612+ monthly, often utilizing dynamic pricing and superior guest experiences.
- Strong performing properties (Top 25%) earn $1,491 or more, indicating effective management and desirable locations/amenities.
- Typical properties (Median) generate around $736 per month, representing the average market performance.
- Entry-level properties (Bottom 25%) see earnings around $318, often with potential for optimization.
Average Monthly Airbnb Earnings Trend in Florianópolis
Florianópolis Airbnb Occupancy Rate Trends (2026)
Maximize your bookings by understanding the Florianópolis STR occupancy trends. Seasonal demand shifts significantly influence how often properties are booked. Typically, Februarysees the highest demand (peak season occupancy), while June experiences the lowest (low season). Effective strategies, like adjusting minimum stays or offering promotions, can boost occupancy during slower periods. Here's how different property tiers perform in Florianópolis:
- Best-in-class properties (Top 10%) achieve 79%+ occupancy, indicating high desirability and potentially optimized availability.
- Strong performing properties (Top 25%) maintain 59% or higher occupancy, suggesting good market fit and guest satisfaction.
- Typical properties (Median) have an occupancy rate around 33%.
- Entry-level properties (Bottom 25%) average 15% occupancy, potentially facing higher vacancy.
Average Monthly Occupancy Rate Trend in Florianópolis
Average Daily Rate (ADR) Airbnb Trends in Florianópolis (2026)
Effective short term rental pricing strategy in Florianópolis involves understanding monthly ADR fluctuations. The Average Daily Rate (ADR) for Airbnb in Florianópolis typically peaks in January and dips lowest during April. Leveraging Airbnb dynamic pricing tools or strategies based on this seasonality can significantly boost revenue. Here's a look at the typical nightly rates achieved:
- Best-in-class properties (Top 10%) command rates of $203+ per night, often due to premium features or locations.
- Strong performing properties (Top 25%) achieve nightly rates of $124 or more.
- Typical properties (Median) charge around $78 per night.
- Entry-level properties (Bottom 25%) earn around $50 per night.
Average Daily Rate (ADR) Trend by Month in Florianópolis
Get Live Florianópolis Market Intelligence 👇

Explore Real-time Analytics
Airbnb Seasonality Analysis & Trends in Florianópolis (2026)
Peak Season (February, January, December)
- Revenue averages $1,904 per month
- Occupancy rates average 46.1%
- Daily rates average $133
Shoulder Season
- Revenue averages $1,041 per month
- Occupancy maintains around 38.3%
- Daily rates hold near $104
Low Season (June, July, August)
- Revenue drops to average $710 per month
- Occupancy decreases to average 29.9%
- Daily rates adjust to average $100
Seasonality Insights for Florianópolis
- The Airbnb seasonality in Florianópolis shows highly seasonal trends requiring careful strategy. While the sections above show seasonal averages, it's also insightful to look at the extremes:
- During the high season, the absolute peak month showcases Florianópolis's highest earning potential, with monthly revenues capable of climbing to $2,087, occupancy reaching a high of 62.6%, and ADRs peaking at $150.
- Conversely, the slowest single month of the year, typically falling within the low season, marks the market's lowest point. In this month, revenue might dip to $665, occupancy could drop to 26.8%, and ADRs may adjust down to $96.
- Understanding both the seasonal averages and these monthly peaks and troughs in revenue, occupancy, and ADR is crucial for maximizing your Airbnb profit potential in Florianópolis.
Seasonal Strategies for Maximizing Profit
- Peak Season: Maximize revenue through premium pricing and potentially longer minimum stays. Ensure high availability.
- Low Season: Offer competitive pricing, special promotions (e.g., extended stay discounts), and flexible cancellation policies. Target off-season travelers like remote workers or budget-conscious guests.
- Shoulder Seasons: Implement dynamic pricing that balances peak and low rates. Target weekend travelers or specific events. Offer slightly more flexible terms than peak season.
- Regularly analyze your own performance against these Florianópolis seasonality benchmarks and adjust your pricing and availability strategy accordingly.
Best Areas for Airbnb Investment in Florianópolis (2026)
Exploring the top neighborhoods for short-term rentals in Florianópolis? This section highlights key areas, outlining why they are attractive for hosts and guests, along with notable local attractions. Consider these locations based on your target guest profile and investment strategy.
| Neighborhood / Area | Why Host Here? (Target Guests & Appeal) | Key Attractions & Landmarks |
|---|---|---|
| Jurerê Internacional | One of the most famous neighborhoods in Florianópolis, known for its upscale beach clubs, beautiful homes, and vibrant nightlife. It's a hotspot for tourists looking for luxury and entertainment. | Jurerê Beach, P12 Parador Internacional, Beaches of Canasvieiras, nightclubs and beach bars, high-end restaurants |
| Lagoinha do Leste | A stunning natural area that attracts nature lovers and hikers. It's less commercialized, so it appeals to those looking for a tranquil getaway, making it great for eco-tourism. | Lagoinha do Leste Beach, hiking trails, natural reserve, secluded beaches, camping spots |
| Centro | The downtown area of Florianópolis, full of cultural attractions, shops, and restaurants. It offers an authentic urban experience and is a good base for exploring the island. | Catedral Metropolitana de Florianópolis, Mercado Público, Museu Histórico de Santa Catarina, public transportation hub, local shops and cafes |
| Campeche | A picturesque beach neighborhood known for its large sandy beach and powerful waves, attracting surfers and beachgoers alike. Ideal for those looking to enjoy the sun and sea. | Campeche Beach, Praia do Campeche, surfing spots, beachfront bars, walking trails |
| Praia dos Ingleses | A popular beach area with a mix of residential and tourist establishments. Known for its family-friendly atmosphere and various water sports available. | Ingleses Beach, water parks, shops and restaurants, local markets, beachside activities |
| Santinho | Famous for its preserved natural beauty and archaeological sites, it attracts visitors looking for both adventure and relaxation. It’s also popular among surfers. | Santinho Beach, archaeological sites, trailheads for hiking, surfing areas, nature preserves |
| Barra da Lagoa | A charming fishing village with a beautiful beach and a relaxed atmosphere. It's ideal for families and those looking for a peaceful vacation spot close to nature. | Barra da Lagoa Beach, natural pools, lagoon for kayaking, local seafood restaurants, fishing culture |
| Morros do Camapuã | A scenic area characterized by its hills and panoramic views. It's more secluded, offering a unique experience to guests who seek tranquility and nature. | hiking trails, breathtaking views, flora and fauna diversity, local artisan crafts, peaceful environment |
Understanding Airbnb License Requirements & STR Laws in Florianópolis (2026)
While Florianópolis, Santa Catarina, Brazil currently shows low STR regulations, specific Airbnb license requirements might still exist or change. Always verify the latest short term rental regulations and Airbnb license requirements directly with local government authorities for Florianópolis to ensure full compliance before hosting.
(Source: AirROI data, 2026, based on 1% licensed listings)
Top Performing Airbnb Properties in Florianópolis (2026)
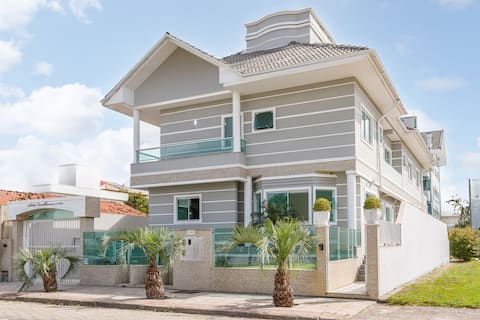
Benchmark your potential! Explore examples of top-performing Airbnb properties in Florianópolisbased on Trailing Twelve Month (TTM) revenue. Analyze their characteristics, revenue, occupancy rate, and ADR to understand what drives success in this market.
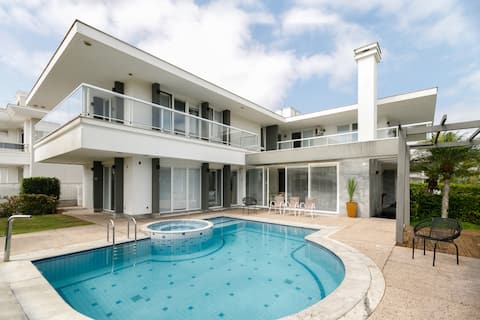
Sea View Mansion | Nightclub | Sauna | Swimming Pool 25 Hosp
Entire Place • 10 bedrooms

🏖Mansion 9 Rooms Jetski, Private Beach, 25 Guests
Entire Place • 9 bedrooms

Amazing place, panoramic view by the beach
Entire Place • 7 bedrooms

Jurerê Oceanfront, Hot Pool, 6 Suites, 20 Guests
Entire Place • 8 bedrooms
Jurerê 450m from the Sea, 10 Suites, Heated Pool 25 Guests
Entire Place • 10 bedrooms

Mansion 20 Guests, 6 Suites, Heated Pool, Jacuzzi
Entire Place • 7 bedrooms
Note: Performance varies based on location, size, amenities, seasonality, and management quality. Data reflects the past 12 months.
Top Performing Airbnb Hosts in Florianópolis (2026)
Learn from the best! This table showcases top-performing Airbnb hosts in Florianópolis based on the number of properties managed and estimated total revenue over the past year. Analyze their scale and performance metrics.
| Host Name | Properties | Grossing Revenue | Stay Reviews | Avg Rating |
|---|---|---|---|---|
| Seazone | 241 | $5,674,510 | 15193 | 4.77/5.0 |
| Me2 Rentals | 149 | $4,324,909 | 6232 | 4.76/5.0 |
| Anfitriões De Aluguel | 320 | $4,252,410 | 7623 | 4.74/5.0 |
| Leo Lopes Ramos | 9 | $1,559,640 | 529 | 4.89/5.0 |
| Gisela E Leandro | 33 | $892,368 | 464 | 4.87/5.0 |
| Marcelo | 68 | $885,235 | 839 | 4.79/5.0 |
| Quartum | 53 | $601,662 | 717 | 4.74/5.0 |
| Carla | 21 | $596,410 | 950 | 4.96/5.0 |
| KingStay, O Rei Da Estadia. | 21 | $583,179 | 1207 | 4.91/5.0 |
| Alba E Paulo - My Home | 27 | $533,103 | 1564 | 4.86/5.0 |
Analyzing the strategies of top hosts, such as their property selection, pricing, and guest communication, can offer valuable lessons for optimizing your own Airbnb operations in Florianópolis.
Dive Deeper: Advanced Florianópolis STR Market Data (2026)
Ready to unlock more insights? AirROI provides access to advanced metrics and comprehensive Airbnb data for Florianópolis. Explore detailed analytics beyond this report to refine your investment strategy, optimize pricing, and maximize your vacation rental profits.
Explore Advanced MetricsFlorianópolis Short-Term Rental Market Composition (2026): Property & Room Types
Room Type Distribution
Property Type Distribution
Market Composition Insights for Florianópolis
- The Florianópolis Airbnb market composition is heavily skewed towards Entire Home/Apt listings, which make up 90.5% of the 17,260 active rentals. This indicates strong guest preference for privacy and space.
- Looking at the property type distribution in Florianópolis, Apartment/Condo properties are the most common (63.5%), reflecting the local real estate landscape.
- Houses represent a significant 29.3% portion, catering likely to families or larger groups.
- Smaller segments like outdoor/unique, others, unique stays (combined 2.1%) offer potential for unique stay experiences.
Florianópolis Airbnb Room Capacity Analysis (2026): Bedroom Distribution
Distribution of Listings by Number of Bedrooms
Room Capacity Insights for Florianópolis
- The dominant room capacity in Florianópolis is 1 bedroom listings, making up 36.8% of the market. This suggests a strong demand for properties suitable for couples or solo travelers.
- Together, 1 bedroom and 2 bedrooms properties represent 71.2% of the active Airbnb listings in Florianópolis, indicating a high concentration in these sizes.
Florianópolis Vacation Rental Guest Capacity Trends (2026)
Distribution of Listings by Guest Capacity
Guest Capacity Insights for Florianópolis
- The most common guest capacity trend in Florianópolis vacation rentals is listings accommodating 4 guests (26.5%). This suggests the primary traveler segment is likely small families or groups.
- Properties designed for 4 guests and 2 guests dominate the Florianópolis STR market, accounting for 41.5% of listings.
- 29.5% of properties accommodate 6+ guests, serving the market segment for larger families or group travel in Florianópolis.
- On average, properties in Florianópolis are equipped to host 4.3 guests.
Florianópolis Airbnb Booking Patterns (2026): Available vs. Booked Days
Available Days Distribution
Booked Days Distribution
Booking Pattern Insights for Florianópolis
- The most common availability pattern in Florianópolis falls within the 271-366 days range, representing 69.2% of listings. This suggests many properties have significant open periods on their calendars.
- Approximately 89.3% of listings show high availability (181+ days open annually), indicating potential for increased bookings or specific owner usage patterns.
- For booked days, the 31-90 days range is most frequent in Florianópolis (38.3%), reflecting common guest stay durations or potential owner blocking patterns.
- A notable 11.2% of properties secure long booking periods (181+ days booked per year), highlighting successful long-term rental strategies or significant owner usage.
Florianópolis Airbnb Minimum Stay Requirements Analysis
Distribution of Listings by Minimum Night Requirement
1 Night
1842 listings
10.7% of total
2 Nights
2353 listings
13.6% of total
3 Nights
1555 listings
9% of total
4-6 Nights
3255 listings
18.9% of total
7-29 Nights
794 listings
4.6% of total
30+ Nights
7456 listings
43.2% of total
Key Insights
- The most prevalent minimum stay requirement in Florianópolis is 30+ Nights, adopted by 43.2% of listings. This highlights the market's preference for longer commitments.
- A significant segment (43.2%) caters to monthly stays (30+ nights) in Florianópolis, pointing to opportunities in the extended-stay market.
Recommendations
- Align with the market by considering a 30+ Nights minimum stay, as 43.2% of Florianópolis hosts use this setting.
- If feasible, allowing 1-night stays, especially midweek or during low season, could capture last-minute bookings, as only 10.7% currently do.
- Explore offering discounts for stays of 30+ nights to attract the 43.2% of the market seeking extended stays.
- Adjust minimum nights based on seasonality – potentially shorter during low season and longer during peak demand periods in Florianópolis.
Florianópolis Airbnb Cancellation Policy Trends Analysis (2026)
Super Strict 60 Days
267 listings
1.6% of total
Non-refundable
25 listings
0.1% of total
Limited
602 listings
3.5% of total
Super Strict 30 Days
106 listings
0.6% of total
Refundable
34 listings
0.2% of total
Flexible
2808 listings
16.3% of total
Moderate
2936 listings
17.1% of total
Firm
7384 listings
42.9% of total
Strict
3041 listings
17.7% of total
Cancellation Policy Insights for Florianópolis
- The prevailing Airbnb cancellation policy trend in Florianópolis is Firm, used by 42.9% of listings.
- A majority (60.6%) of hosts in Florianópolis utilize Firm or Strict policies, indicating a market where hosts prioritize booking security.
Recommendations for Hosts
- Consider adopting a Firm policy to align with the 42.9% market standard in Florianópolis.
- Regularly review your cancellation policy against competitors and market demand shifts in Florianópolis.
Florianópolis STR Booking Lead Time Analysis (2026)
Average Booking Lead Time by Month
Booking Lead Time Insights for Florianópolis
- The overall average booking lead time for vacation rentals in Florianópolis is 42 days.
- Guests book furthest in advance for stays during December (average 59 days), likely coinciding with peak travel demand or local events.
- The shortest booking windows occur for stays in June (average 17 days), indicating more last-minute travel plans during this time.
- Seasonally, Winter (52 days avg.) sees the longest lead times, while Summer (23 days avg.) has the shortest, reflecting typical travel planning cycles.
Recommendations for Hosts
- Use the overall average lead time (42 days) as a baseline for your pricing and availability strategy in Florianópolis.
- For December stays, consider implementing length-of-stay discounts or slightly higher rates for bookings made less than 59 days out to capitalize on advance planning.
- Target marketing efforts for the Winter season well in advance (at least 52 days) to capture early planners.
- Monitor your own booking lead times against these Florianópolis averages to identify opportunities for dynamic pricing adjustments.
Popular & Essential Airbnb Amenities in Florianópolis (2026)
Amenity Prevalence
Amenity Insights for Florianópolis
- Essential amenities in Florianópolis that guests expect include: Wifi, Kitchen. Lacking these (any) could significantly impact bookings.
- Popular amenities like TV, Air conditioning, Free parking on premises are common but not universal. Offering these can provide a competitive edge.
Recommendations for Hosts
- Ensure your listing includes all essential amenities for Florianópolis: Wifi, Kitchen.
- Prioritize adding missing essentials: Wifi, Kitchen.
- Consider adding popular differentiators like TV or Air conditioning to increase appeal.
- Highlight unique or less common amenities you offer (e.g., hot tub, dedicated workspace, EV charger) in your listing description and photos.
- Regularly check competitor amenities in Florianópolis to stay competitive.
Florianópolis Airbnb Guest Demographics & Profile Analysis (2026)
Guest Profile Summary for Florianópolis
- The typical guest profile for Airbnb in Florianópolis consists of primarily domestic travelers (71%), often arriving from nearby São Paulo, typically belonging to the Post-2000s (Gen Z/Alpha) group (50%), primarily speaking Portuguese or English.
- Domestic travelers account for 71.2% of guests.
- Key international markets include Brazil (71.2%) and Argentina (8.3%).
- Top languages spoken are Portuguese (35.1%) followed by English (31.6%).
- A significant demographic segment is the Post-2000s (Gen Z/Alpha) group, representing 50% of guests.
Recommendations for Hosts
- Target domestic marketing efforts towards travelers from São Paulo and Porto Alegre.
- Tailor amenities and listing descriptions to appeal to the dominant Post-2000s (Gen Z/Alpha) demographic (e.g., highlight fast WiFi, smart home features, local guides).
- Highlight unique local experiences or amenities relevant to the primary guest profile.
- Consider seasonal promotions aligned with peak travel times for key origin markets.
Nearby Short-Term Rental Market Comparison
How does the Florianópolis Airbnb market stack up against its neighbors? Compare key performance metrics like average monthly revenue, ADR, and occupancy rates in surrounding areas to understand the broader regional STR landscape.
| Market | Active Properties | Monthly Revenue | Daily Rate | Avg. Occupancy |
|---|---|---|---|---|
| Rancho Queimado | 177 | $1,169 | $156.09 | 28% |
| Angelina | 25 | $1,022 | $113.19 | 27% |
| Rio dos Cedros | 147 | $993 | $142.58 | 27% |
| Alfredo Wagner | 183 | $946 | $127.37 | 25% |
| Balneário Camboriú | 4,575 | $867 | $116.75 | 36% |
| Massaranduba | 11 | $844 | $86.77 | 36% |
| Anitápolis | 72 | $828 | $90.20 | 33% |
| Região Geográfica Imediata de Lages | 63 | $807 | $130.68 | 26% |
| Canelinha | 12 | $803 | $163.57 | 24% |
| Região Geográfica Imediata de Florianópolis | 21 | $774 | $120.71 | 22% |