Zagreb Airbnb Market Analysis 2026: Short Term Rental Data & Vacation Rental Statistics in Grad Zagreb, Croatia
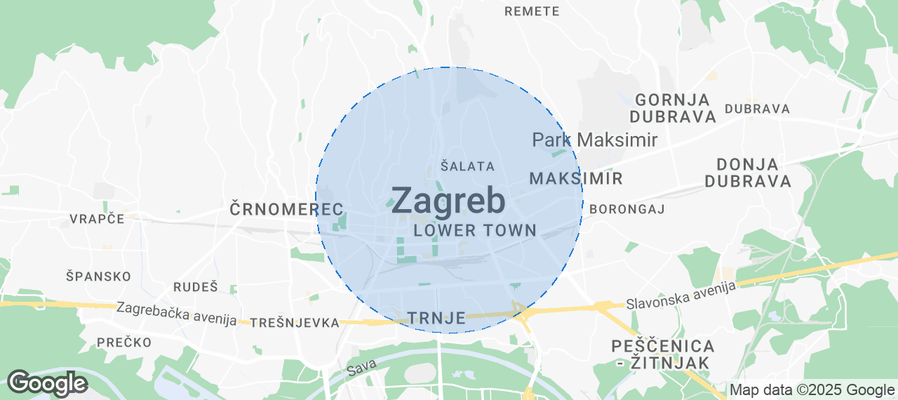
Is Airbnb profitable in Zagreb in 2026? Explore comprehensive Airbnb analytics for Zagreb, Grad Zagreb, Croatia to uncover income potential. This 2026 STR market report for Zagreb, based on AirROI data from February 2025 to January 2026, reveals key trends in the niche market of 108 active listings.
Whether you're considering an Airbnb investment in Zagreb, optimizing your existing vacation rental, or exploring rental arbitrage opportunities, understanding the Zagreb Airbnb data is crucial. Leveraging the low regulation environment is key to maximizing your short term rental income potential. Let's dive into the specifics.
Key Zagreb Airbnb Performance Metrics Overview
Monthly Airbnb Revenue Variations & Income Potential in Zagreb (2026)
Understanding the monthly revenue variations for Airbnb listings in Zagreb is key to maximizing your short term rental income potential. Seasonality significantly impacts earnings. Our analysis, based on data from the past 12 months, shows that the peak revenue month for STRs in Zagreb is typically June, while May often presents the lowest earnings, highlighting opportunities for strategic pricing adjustments during shoulder and low seasons. Explore the typical Airbnb income in Zagreb across different performance tiers:
- Best-in-class properties (Top 10%) achieve $2,255+ monthly, often utilizing dynamic pricing and superior guest experiences.
- Strong performing properties (Top 25%) earn $1,576 or more, indicating effective management and desirable locations/amenities.
- Typical properties (Median) generate around $1,009 per month, representing the average market performance.
- Entry-level properties (Bottom 25%) see earnings around $571, often with potential for optimization.
Average Monthly Airbnb Earnings Trend in Zagreb
Zagreb Airbnb Occupancy Rate Trends (2026)
Maximize your bookings by understanding the Zagreb STR occupancy trends. Seasonal demand shifts significantly influence how often properties are booked. Typically, Junesees the highest demand (peak season occupancy), while May experiences the lowest (low season). Effective strategies, like adjusting minimum stays or offering promotions, can boost occupancy during slower periods. Here's how different property tiers perform in Zagreb:
- Best-in-class properties (Top 10%) achieve 66%+ occupancy, indicating high desirability and potentially optimized availability.
- Strong performing properties (Top 25%) maintain 52% or higher occupancy, suggesting good market fit and guest satisfaction.
- Typical properties (Median) have an occupancy rate around 36%.
- Entry-level properties (Bottom 25%) average 21% occupancy, potentially facing higher vacancy.
Average Monthly Occupancy Rate Trend in Zagreb
Average Daily Rate (ADR) Airbnb Trends in Zagreb (2026)
Effective short term rental pricing strategy in Zagreb involves understanding monthly ADR fluctuations. The Average Daily Rate (ADR) for Airbnb in Zagreb typically peaks in December and dips lowest during August. Leveraging Airbnb dynamic pricing tools or strategies based on this seasonality can significantly boost revenue. Here's a look at the typical nightly rates achieved:
- Best-in-class properties (Top 10%) command rates of $171+ per night, often due to premium features or locations.
- Strong performing properties (Top 25%) achieve nightly rates of $117 or more.
- Typical properties (Median) charge around $91 per night.
- Entry-level properties (Bottom 25%) earn around $67 per night.
Average Daily Rate (ADR) Trend by Month in Zagreb
Get Live Zagreb Market Intelligence 👇
Explore Real-time Analytics
Airbnb Seasonality Analysis & Trends in Zagreb (2026)
Peak Season (June, December, September)
- Revenue averages $1,616 per month
- Occupancy rates average 49.7%
- Daily rates average $114
Shoulder Season
- Revenue averages $1,028 per month
- Occupancy maintains around 31.9%
- Daily rates hold near $108
Low Season (February, March, April)
- Revenue drops to average $0 per month
- Occupancy decreases to average 0.0%
- Daily rates adjust to average $114
Seasonality Insights for Zagreb
- The Airbnb seasonality in Zagreb shows highly seasonal trends requiring careful strategy. While the sections above show seasonal averages, it's also insightful to look at the extremes:
- During the high season, the absolute peak month showcases Zagreb's highest earning potential, with monthly revenues capable of climbing to $1,804, occupancy reaching a high of 58.7%, and ADRs peaking at $124.
- Conversely, the slowest single month of the year, typically falling within the low season, marks the market's lowest point. In this month, revenue might dip to $0, occupancy could drop to 0.0%, and ADRs may adjust down to $103.
- Understanding both the seasonal averages and these monthly peaks and troughs in revenue, occupancy, and ADR is crucial for maximizing your Airbnb profit potential in Zagreb.
Seasonal Strategies for Maximizing Profit
- Peak Season: Maximize revenue through premium pricing and potentially longer minimum stays. Ensure high availability.
- Low Season: Offer competitive pricing, special promotions (e.g., extended stay discounts), and flexible cancellation policies. Target off-season travelers like remote workers or budget-conscious guests.
- Shoulder Seasons: Implement dynamic pricing that balances peak and low rates. Target weekend travelers or specific events. Offer slightly more flexible terms than peak season.
- Regularly analyze your own performance against these Zagreb seasonality benchmarks and adjust your pricing and availability strategy accordingly.
Best Areas for Airbnb Investment in Zagreb (2026)
Exploring the top neighborhoods for short-term rentals in Zagreb? This section highlights key areas, outlining why they are attractive for hosts and guests, along with notable local attractions. Consider these locations based on your target guest profile and investment strategy.
| Neighborhood / Area | Why Host Here? (Target Guests & Appeal) | Key Attractions & Landmarks |
|---|---|---|
| Gornji Grad | Historical Upper Town known for its medieval architecture and vibrant atmosphere. It's popular for tourists exploring Zagreb's rich history and culture. | Zagreb Cathedral, St. Mark's Church, Lotrščak Tower, Museum of Broken Relationships, Tkalčićeva Street |
| Donji Grad | City's downtown area filled with shops, cafes, and cultural institutions. It's highly sought-after for both tourists and locals for its urban vibe and accessibility. | Ban Jelačić Square, Zagreb City Museum, Zrinjevac Park, Croatian National Theatre, Ilica Street |
| Jarun | A scenic area known for its lake and outdoor activities. Attracts both tourists looking for relaxation and locals enjoying the parks and recreational facilities. | Jarun Lake, Boat rentals, Cycling paths, Various sports facilities, City beaches |
| Maksimir | Residential area with beautiful parks and historical sites. Great for families and nature enthusiasts, particularly those seeking tranquility. | Maksimir Park, Zagreb Zoo, St. Stephen's Church, Blue Lake, Botanical Garden |
| Trešnjevka | A vibrant district known for its local markets and parks. It offers a more authentic Zagreb experience with local culture and accessibility to the city center. | Trešnjevka Market, Vrbani Park, St. Nicholas Church, Shopping Centres, Local cafes |
| Medveščak | A green and quiet residential area, perfect for those seeking a peaceful retreat while being close to the city center. Good for families and long-term stays. | Medvednica Mountain, Local hiking trails, Nature parks, Historical architecture, Quiet neighborhoods |
| Branimirova | A bustling area close to the main train station, ideal for travelers seeking convenience and easy access to transport and amenities. | Branimir Center, Transport links, Local shops, Cafes and restaurants, Proximity to everything |
| Savica | A charming neighborhood that offers a mix of residential and commercial areas, attracting visitors looking for local experiences and accessibility to the outskirts. | Local parks, Nearby markets, Zagreb's tram system, Community events, Dining options |
Understanding Airbnb License Requirements & STR Laws in Zagreb (2026)
While Zagreb, Grad Zagreb, Croatia currently shows low STR regulations, specific Airbnb license requirements might still exist or change. Always verify the latest short term rental regulations and Airbnb license requirements directly with local government authorities for Zagreb to ensure full compliance before hosting.
(Source: AirROI data, 2026, finding no licensed listings among those analyzed)
Top Performing Airbnb Properties in Zagreb (2026)
Benchmark your potential! Explore examples of top-performing Airbnb properties in Zagrebbased on Trailing Twelve Month (TTM) revenue. Analyze their characteristics, revenue, occupancy rate, and ADR to understand what drives success in this market.
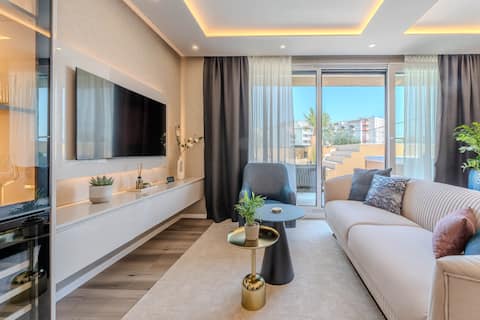
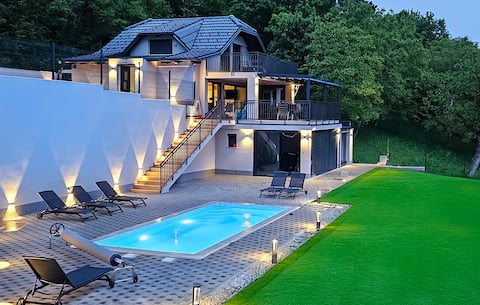
Apartment EMMA Platinum with pool, jacuzzi & sauna
Entire Place • 2 bedrooms
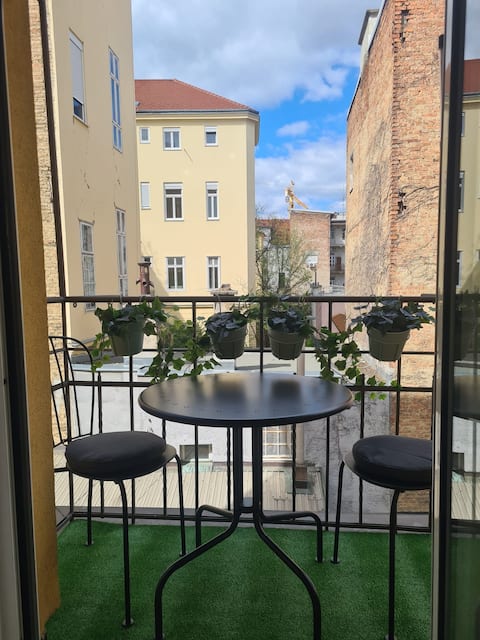
Golden star Apartment, CityCenter
Entire Place • 3 bedrooms
BRAND NEW apt 2 rooms 2 baths 2xACs, top location
Entire Place • 2 bedrooms

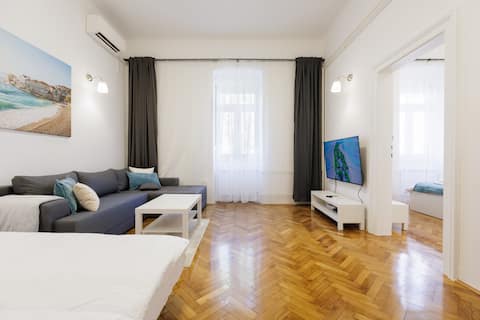
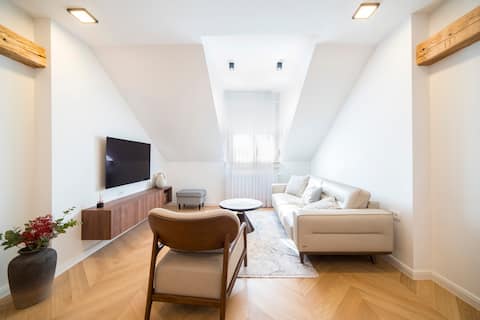
Peaceful Escape - Prime Location
Entire Place • 2 bedrooms
Awesome home in Zagreb with sauna
Entire Place • 2 bedrooms
La Donna Apartment
Entire Place • 2 bedrooms
Note: Performance varies based on location, size, amenities, seasonality, and management quality. Data reflects the past 12 months.
Top Performing Airbnb Hosts in Zagreb (2026)
Learn from the best! This table showcases top-performing Airbnb hosts in Zagreb based on the number of properties managed and estimated total revenue over the past year. Analyze their scale and performance metrics.
| Host Name | Properties | Grossing Revenue | Stay Reviews | Avg Rating |
|---|---|---|---|---|
| SelfCheckIns Contact Team 1 | 22 | $128,843 | 199 | 4.50/5.0 |
| Home | 9 | $97,862 | 117 | 4.78/5.0 |
| ZAGABRIA VACATION SUITES D.O. | 9 | $82,871 | 90 | 4.70/5.0 |
| Flok | 5 | $66,886 | 60 | 4.16/5.0 |
| Karlo | 1 | $45,706 | 20 | 5.00/5.0 |
| Dino | 1 | $42,469 | 16 | 4.88/5.0 |
| Zagreb Apartments | 5 | $40,655 | 69 | 4.87/5.0 |
| Borna | 3 | $36,198 | 81 | 4.79/5.0 |
| Harold | 3 | $34,870 | 13 | 4.33/5.0 |
| Sven | 3 | $30,469 | 24 | 4.84/5.0 |
Analyzing the strategies of top hosts, such as their property selection, pricing, and guest communication, can offer valuable lessons for optimizing your own Airbnb operations in Zagreb.
Dive Deeper: Advanced Zagreb STR Market Data (2026)
Ready to unlock more insights? AirROI provides access to advanced metrics and comprehensive Airbnb data for Zagreb. Explore detailed analytics beyond this report to refine your investment strategy, optimize pricing, and maximize your vacation rental profits.
Explore Advanced MetricsZagreb Short-Term Rental Market Composition (2026): Property & Room Types
Room Type Distribution
Property Type Distribution
Market Composition Insights for Zagreb
- The Zagreb Airbnb market composition is heavily skewed towards Entire Home/Apt listings, which make up 85.2% of the 108 active rentals. This indicates strong guest preference for privacy and space.
- Looking at the property type distribution in Zagreb, Apartment/Condo properties are the most common (89.8%), reflecting the local real estate landscape.
- The presence of 5.6% Hotel/Boutique listings indicates integration with traditional hospitality.
- Smaller segments like house (combined 4.6%) offer potential for unique stay experiences.
Zagreb Airbnb Room Capacity Analysis (2026): Bedroom Distribution
Distribution of Listings by Number of Bedrooms
Room Capacity Insights for Zagreb
- The dominant room capacity in Zagreb is 1 bedroom listings, making up 61.1% of the market. This suggests a strong demand for properties suitable for couples or solo travelers.
- Together, 1 bedroom and 2 bedrooms properties represent 78.7% of the active Airbnb listings in Zagreb, indicating a high concentration in these sizes.
- With over half the market (61.1%) consisting of studios or 1-bedroom units, Zagreb is particularly well-suited for individuals or couples.
- Listings with 3+ bedrooms (2.8%) represent a smaller niche, potentially indicating an underserved market for larger group accommodations in Zagreb.
Zagreb Vacation Rental Guest Capacity Trends (2026)
Distribution of Listings by Guest Capacity
Guest Capacity Insights for Zagreb
- The most common guest capacity trend in Zagreb vacation rentals is listings accommodating 2 guests (37%). This suggests the primary traveler segment is likely couples or solo travelers.
- Properties designed for 2 guests and 4 guests dominate the Zagreb STR market, accounting for 66.6% of listings.
- 11.2% of properties accommodate 6+ guests, serving the market segment for larger families or group travel in Zagreb.
- On average, properties in Zagreb are equipped to host 3.2 guests.
Zagreb Airbnb Booking Patterns (2026): Available vs. Booked Days
Available Days Distribution
Booked Days Distribution
Booking Pattern Insights for Zagreb
- The most common availability pattern in Zagreb falls within the 271-366 days range, representing 64.8% of listings. This suggests many properties have significant open periods on their calendars.
- Approximately 98.1% of listings show high availability (181+ days open annually), indicating potential for increased bookings or specific owner usage patterns.
- For booked days, the 31-90 days range is most frequent in Zagreb (50.9%), reflecting common guest stay durations or potential owner blocking patterns.
- A notable 2.8% of properties secure long booking periods (181+ days booked per year), highlighting successful long-term rental strategies or significant owner usage.
Zagreb Airbnb Minimum Stay Requirements Analysis
Distribution of Listings by Minimum Night Requirement
1 Night
66 listings
61.1% of total
2 Nights
9 listings
8.3% of total
4-6 Nights
2 listings
1.9% of total
7-29 Nights
1 listings
0.9% of total
30+ Nights
30 listings
27.8% of total
Key Insights
- The most prevalent minimum stay requirement in Zagreb is 1 Night, adopted by 61.1% of listings. This highlights the market's preference for shorter, flexible bookings.
- A strong majority (69.4%) of the Zagreb Airbnb data shows acceptance of very short stays (1-2 nights), indicating a dynamic, high-turnover market.
- A significant segment (27.8%) caters to monthly stays (30+ nights) in Zagreb, pointing to opportunities in the extended-stay market.
Recommendations
- Align with the market by considering a 1 Night minimum stay, as 61.1% of Zagreb hosts use this setting.
- Explore offering discounts for stays of 30+ nights to attract the 27.8% of the market seeking extended stays.
- Adjust minimum nights based on seasonality – potentially shorter during low season and longer during peak demand periods in Zagreb.
Zagreb Airbnb Cancellation Policy Trends Analysis (2026)
Limited
6 listings
5.6% of total
Super Strict 60 Days
1 listings
0.9% of total
Super Strict 30 Days
1 listings
0.9% of total
Flexible
37 listings
34.3% of total
Moderate
13 listings
12% of total
Firm
38 listings
35.2% of total
Strict
12 listings
11.1% of total
Cancellation Policy Insights for Zagreb
- The prevailing Airbnb cancellation policy trend in Zagreb is Firm, used by 35.2% of listings.
- There's a relatively balanced mix between guest-friendly (46.3%) and stricter (46.3%) policies, offering choices for different guest needs.
Recommendations for Hosts
- Consider adopting a Firm policy to align with the 35.2% market standard in Zagreb.
- Using a Strict policy might deter some guests, as only 11.1% of listings use it. Evaluate if potential revenue protection outweighs possible lower booking rates.
- Regularly review your cancellation policy against competitors and market demand shifts in Zagreb.
Zagreb STR Booking Lead Time Analysis (2026)
Average Booking Lead Time by Month
Booking Lead Time Insights for Zagreb
- The overall average booking lead time for vacation rentals in Zagreb is 21 days.
- Guests book furthest in advance for stays during August (average 31 days), likely coinciding with peak travel demand or local events.
- The shortest booking windows occur for stays in April (average 0 days), indicating more last-minute travel plans during this time.
- Seasonally, Fall (23 days avg.) sees the longest lead times, while Spring (1 days avg.) has the shortest, reflecting typical travel planning cycles.
Recommendations for Hosts
- Use the overall average lead time (21 days) as a baseline for your pricing and availability strategy in Zagreb.
- During April, focus on last-minute booking availability and promotions, as guests book with very short notice (0 days avg.).
- Target marketing efforts for the Fall season well in advance (at least 23 days) to capture early planners.
- Monitor your own booking lead times against these Zagreb averages to identify opportunities for dynamic pricing adjustments.
Popular & Essential Airbnb Amenities in Zagreb (2026)
Amenity Prevalence
Amenity Insights for Zagreb
- Essential amenities in Zagreb that guests expect include: Wifi, Air conditioning. Lacking these (any) could significantly impact bookings.
- Popular amenities like TV, Hair dryer, Heating are common but not universal. Offering these can provide a competitive edge.
Recommendations for Hosts
- Ensure your listing includes all essential amenities for Zagreb: Wifi, Air conditioning.
- Prioritize adding missing essentials: Wifi, Air conditioning.
- Consider adding popular differentiators like TV or Hair dryer to increase appeal.
- Highlight unique or less common amenities you offer (e.g., hot tub, dedicated workspace, EV charger) in your listing description and photos.
- Regularly check competitor amenities in Zagreb to stay competitive.
Zagreb Airbnb Guest Demographics & Profile Analysis (2026)
Guest Profile Summary for Zagreb
- The typical guest profile for Airbnb in Zagreb consists of predominantly international visitors (88%), with top international origins including United States, typically belonging to the Post-2000s (Gen Z/Alpha) group (50%), primarily speaking English or German.
- Domestic travelers account for 11.8% of guests.
- Key international markets include Croatia (11.8%) and United States (9.4%).
- Top languages spoken are English (40.4%) followed by German (10.6%).
- A significant demographic segment is the Post-2000s (Gen Z/Alpha) group, representing 50% of guests.
Recommendations for Hosts
- Focus marketing internationally, particularly towards travelers from United States.
- Tailor amenities and listing descriptions to appeal to the dominant Post-2000s (Gen Z/Alpha) demographic (e.g., highlight fast WiFi, smart home features, local guides).
- Highlight unique local experiences or amenities relevant to the primary guest profile.
- Consider seasonal promotions aligned with peak travel times for key origin markets.
Nearby Short-Term Rental Market Comparison
How does the Zagreb Airbnb market stack up against its neighbors? Compare key performance metrics like average monthly revenue, ADR, and occupancy rates in surrounding areas to understand the broader regional STR landscape.
| Market | Active Properties | Monthly Revenue | Daily Rate | Avg. Occupancy |
|---|---|---|---|---|
| Poljica Brig | 16 | $3,948 | $523.01 | 52% |
| Zemunik Gornji | 12 | $3,347 | $325.85 | 52% |
| Murvica | 30 | $3,023 | $359.79 | 45% |
| Crno | 16 | $2,891 | $442.64 | 32% |
| Briševo | 14 | $2,807 | $332.69 | 48% |
| Bad Sankt Leonhard im Lavanttal | 35 | $2,804 | $300.73 | 36% |
| Sveti Bartul | 23 | $2,423 | $336.51 | 46% |
| Stanišovi | 25 | $2,315 | $432.88 | 38% |
| Zagore | 13 | $2,283 | $389.65 | 35% |
| Hreljin | 13 | $2,242 | $415.38 | 40% |