Čabrunići Airbnb Market Analysis 2026: Short Term Rental Data & Vacation Rental Statistics in Istria County, Croatia
Is Airbnb profitable in Čabrunići in 2026? Explore comprehensive Airbnb analytics for Čabrunići, Istria County, Croatia to uncover income potential. This 2026 STR market report for Čabrunići, based on AirROI data from February 2025 to January 2026, reveals key trends in the niche market of 26 active listings.
Whether you're considering an Airbnb investment in Čabrunići, optimizing your existing vacation rental, or exploring rental arbitrage opportunities, understanding the Čabrunići Airbnb data is crucial. Leveraging the low regulation environment is key to maximizing your short term rental income potential. Let's dive into the specifics.
Key Čabrunići Airbnb Performance Metrics Overview
Monthly Airbnb Revenue Variations & Income Potential in Čabrunići (2026)
Understanding the monthly revenue variations for Airbnb listings in Čabrunići is key to maximizing your short term rental income potential. Seasonality significantly impacts earnings. Our analysis, based on data from the past 12 months, shows that the peak revenue month for STRs in Čabrunići is typically August, while February often presents the lowest earnings, highlighting opportunities for strategic pricing adjustments during shoulder and low seasons. Explore the typical Airbnb income in Čabrunići across different performance tiers:
- Best-in-class properties (Top 10%) achieve $7,536+ monthly, often utilizing dynamic pricing and superior guest experiences.
- Strong performing properties (Top 25%) earn $6,116 or more, indicating effective management and desirable locations/amenities.
- Typical properties (Median) generate around $3,484 per month, representing the average market performance.
- Entry-level properties (Bottom 25%) see earnings around $2,137, often with potential for optimization.
Average Monthly Airbnb Earnings Trend in Čabrunići
Čabrunići Airbnb Occupancy Rate Trends (2026)
Maximize your bookings by understanding the Čabrunići STR occupancy trends. Seasonal demand shifts significantly influence how often properties are booked. Typically, Augustsees the highest demand (peak season occupancy), while February experiences the lowest (low season). Effective strategies, like adjusting minimum stays or offering promotions, can boost occupancy during slower periods. Here's how different property tiers perform in Čabrunići:
- Best-in-class properties (Top 10%) achieve 67%+ occupancy, indicating high desirability and potentially optimized availability.
- Strong performing properties (Top 25%) maintain 52% or higher occupancy, suggesting good market fit and guest satisfaction.
- Typical properties (Median) have an occupancy rate around 31%.
- Entry-level properties (Bottom 25%) average 21% occupancy, potentially facing higher vacancy.
Average Monthly Occupancy Rate Trend in Čabrunići
Average Daily Rate (ADR) Airbnb Trends in Čabrunići (2026)
Effective short term rental pricing strategy in Čabrunići involves understanding monthly ADR fluctuations. The Average Daily Rate (ADR) for Airbnb in Čabrunići typically peaks in July and dips lowest during November. Leveraging Airbnb dynamic pricing tools or strategies based on this seasonality can significantly boost revenue. Here's a look at the typical nightly rates achieved:
- Best-in-class properties (Top 10%) command rates of $454+ per night, often due to premium features or locations.
- Strong performing properties (Top 25%) achieve nightly rates of $362 or more.
- Typical properties (Median) charge around $298 per night.
- Entry-level properties (Bottom 25%) earn around $210 per night.
Average Daily Rate (ADR) Trend by Month in Čabrunići
Get Live Čabrunići Market Intelligence 👇

Explore Real-time Analytics
Airbnb Seasonality Analysis & Trends in Čabrunići (2026)
Peak Season (August, July, September)
- Revenue averages $6,617 per month
- Occupancy rates average 57.0%
- Daily rates average $341
Shoulder Season
- Revenue averages $4,012 per month
- Occupancy maintains around 36.1%
- Daily rates hold near $299
Low Season (January, February, November)
- Revenue drops to average $2,498 per month
- Occupancy decreases to average 24.3%
- Daily rates adjust to average $293
Seasonality Insights for Čabrunići
- The Airbnb seasonality in Čabrunići shows highly seasonal trends requiring careful strategy. While the sections above show seasonal averages, it's also insightful to look at the extremes:
- During the high season, the absolute peak month showcases Čabrunići's highest earning potential, with monthly revenues capable of climbing to $8,513, occupancy reaching a high of 65.9%, and ADRs peaking at $371.
- Conversely, the slowest single month of the year, typically falling within the low season, marks the market's lowest point. In this month, revenue might dip to $2,111, occupancy could drop to 17.8%, and ADRs may adjust down to $276.
- Understanding both the seasonal averages and these monthly peaks and troughs in revenue, occupancy, and ADR is crucial for maximizing your Airbnb profit potential in Čabrunići.
Seasonal Strategies for Maximizing Profit
- Peak Season: Maximize revenue through premium pricing and potentially longer minimum stays. Ensure high availability.
- Low Season: Offer competitive pricing, special promotions (e.g., extended stay discounts), and flexible cancellation policies. Target off-season travelers like remote workers or budget-conscious guests.
- Shoulder Seasons: Implement dynamic pricing that balances peak and low rates. Target weekend travelers or specific events. Offer slightly more flexible terms than peak season.
- Regularly analyze your own performance against these Čabrunići seasonality benchmarks and adjust your pricing and availability strategy accordingly.
Best Areas for Airbnb Investment in Čabrunići (2026)
Exploring the top neighborhoods for short-term rentals in Čabrunići? This section highlights key areas, outlining why they are attractive for hosts and guests, along with notable local attractions. Consider these locations based on your target guest profile and investment strategy.
| Neighborhood / Area | Why Host Here? (Target Guests & Appeal) | Key Attractions & Landmarks |
|---|---|---|
| Pula | Historic city with Roman architecture and a vibrant arts scene. A prime tourist destination for visitors interested in ancient history, seaside activities, and cultural experiences. | Pula Arena, Temple of Augustus, Pula Aquarium, Brijuni National Park, The Arch of the Sergii |
| Rovinj | Charming coastal town known for its picturesque old town and beautiful beaches. Ideal for tourists looking for a romantic getaway and stunning views. | Rovinj Old Town, Church of St. Euphemia, Rovinj Aquarium, Lone Bay Beach, Golden Cape Forest Park |
| Poreč | Popular tourist destination with beautiful beaches and a rich history. A great choice for families and beachgoers. | Euphrasian Basilica, Poreč Marina, Baredine Cave, Aquacolors Poreč, Poreč Main Square |
| Motovun | Medieval hilltop town known for its stunning views and truffle delicacies. Attracts those interested in nature and culinary experiences. | Motovun Wall, Truffle Hunting Tours, Summer Film Festival, Breathtaking Views, Local Wineries |
| Umag | Lively coastal town popular with tourists for its beaches and sporting events. Great for those who enjoy an active lifestyle. | Umag Beach, ATP Croatia Open Umag, Savudrija Lighthouse, Umag Town Museum, Local Restaurants |
| Labin | Historical town known for its arts scene and nearby beaches. Appeals to culture lovers and those who want to explore local art and history. | Labin Old Town, Saint Justus Church, Art Galleries, Rabac Beach, Local Festivals |
| Fažana | Small fishing village close to Brijuni Islands, known for its beautiful coastline. A peaceful spot for vacationers seeking tranquility and nature. | Fažana Waterfront, Brijuni National Park, Villas and Restaurants, Local Seafood Markets, Beaches |
| Vrsar | Quaint coastal town with stunning landscapes and a relaxed atmosphere. Popular with couples and families. | Vrsar Old Town, Vrsar Harbor, Aquatic Sports, Nearby Islands, Scenic Views |
Understanding Airbnb License Requirements & STR Laws in Čabrunići (2026)
While Čabrunići, Istria County, Croatia currently shows low STR regulations, specific Airbnb license requirements might still exist or change. Always verify the latest short term rental regulations and Airbnb license requirements directly with local government authorities for Čabrunići to ensure full compliance before hosting.
(Source: AirROI data, 2026, finding no licensed listings among those analyzed)
Top Performing Airbnb Properties in Čabrunići (2026)
Benchmark your potential! Explore examples of top-performing Airbnb properties in Čabrunićibased on Trailing Twelve Month (TTM) revenue. Analyze their characteristics, revenue, occupancy rate, and ADR to understand what drives success in this market.
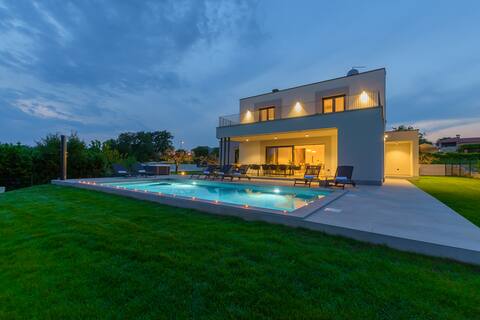
Villa Eriani, villa sa grijanim bazenom i Jacuzzi
Entire Place • 5 bedrooms
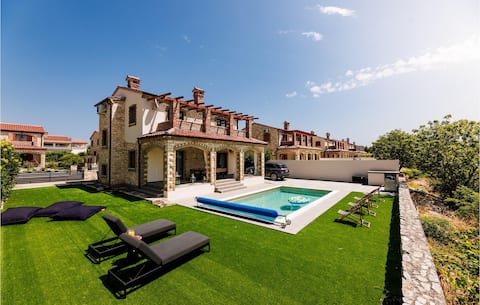
Villa Olivia Cabrunici
Entire Place • 3 bedrooms

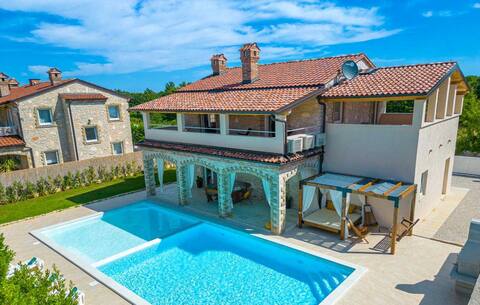
Villa Stancija Cabrunici
Entire Place • 5 bedrooms
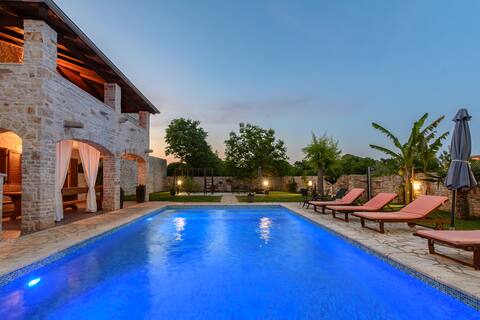
Last Minute_ExtraLargePool_ComfortableVilla Pietro
Entire Place • 4 bedrooms
Holiday House Rose by IstriaLux
Entire Place • 5 bedrooms

Villa Eriani by Istrialux
Entire Place • 5 bedrooms
Note: Performance varies based on location, size, amenities, seasonality, and management quality. Data reflects the past 12 months.
Top Performing Airbnb Hosts in Čabrunići (2026)
Learn from the best! This table showcases top-performing Airbnb hosts in Čabrunići based on the number of properties managed and estimated total revenue over the past year. Analyze their scale and performance metrics.
| Host Name | Properties | Grossing Revenue | Stay Reviews | Avg Rating |
|---|---|---|---|---|
| Istrialux | 4 | $101,487 | 19 | 4.90/5.0 |
| Alen | 1 | $78,298 | 23 | 5.00/5.0 |
| Novasol | 1 | $54,881 | 2 | Not Rated |
| Davor & Željka | 2 | $51,957 | 17 | 4.89/5.0 |
| Oceanic Ulaganja D.O.O. | 1 | $43,520 | 1 | Not Rated |
| Igor | 1 | $32,553 | 6 | 5.00/5.0 |
| Novasol | 1 | $30,939 | 4 | 4.75/5.0 |
| Tina | 1 | $29,989 | 2 | Not Rated |
| Novasol | 1 | $29,077 | 1 | Not Rated |
| Andrea | 1 | $25,836 | 8 | 4.63/5.0 |
Analyzing the strategies of top hosts, such as their property selection, pricing, and guest communication, can offer valuable lessons for optimizing your own Airbnb operations in Čabrunići.
Dive Deeper: Advanced Čabrunići STR Market Data (2026)
Ready to unlock more insights? AirROI provides access to advanced metrics and comprehensive Airbnb data for Čabrunići. Explore detailed analytics beyond this report to refine your investment strategy, optimize pricing, and maximize your vacation rental profits.
Explore Advanced MetricsČabrunići Short-Term Rental Market Composition (2026): Property & Room Types
Room Type Distribution
Property Type Distribution
Market Composition Insights for Čabrunići
- The Čabrunići Airbnb market composition is heavily skewed towards Entire Home/Apt listings, which make up 100% of the 26 active rentals. This indicates strong guest preference for privacy and space.
- Looking at the property type distribution in Čabrunići, House properties are the most common (100%), reflecting the local real estate landscape.
- Houses represent a significant 100% portion, catering likely to families or larger groups.
Čabrunići Airbnb Room Capacity Analysis (2026): Bedroom Distribution
Distribution of Listings by Number of Bedrooms
Room Capacity Insights for Čabrunići
- The dominant room capacity in Čabrunići is 4 bedrooms listings, making up 50% of the market. This suggests a strong demand for properties suitable for families or small groups.
- Together, 4 bedrooms and 3 bedrooms properties represent 69.2% of the active Airbnb listings in Čabrunići, indicating a high concentration in these sizes.
- A significant 84.6% of listings offer 3+ bedrooms, catering to larger groups and families seeking more space in Čabrunići.
Čabrunići Vacation Rental Guest Capacity Trends (2026)
Distribution of Listings by Guest Capacity
Guest Capacity Insights for Čabrunići
- The most common guest capacity trend in Čabrunići vacation rentals is listings accommodating 8+ guests (65.4%). This suggests the primary traveler segment is likely larger groups.
- Properties designed for 8+ guests and 6 guests dominate the Čabrunići STR market, accounting for 80.8% of listings.
- 84.6% of properties accommodate 6+ guests, serving the market segment for larger families or group travel in Čabrunići.
- On average, properties in Čabrunići are equipped to host 7.2 guests.
Čabrunići Airbnb Booking Patterns (2026): Available vs. Booked Days
Available Days Distribution
Booked Days Distribution
Booking Pattern Insights for Čabrunići
- The most common availability pattern in Čabrunići falls within the 271-366 days range, representing 76.9% of listings. This suggests many properties have significant open periods on their calendars.
- Approximately 96.1% of listings show high availability (181+ days open annually), indicating potential for increased bookings or specific owner usage patterns.
- For booked days, the 31-90 days range is most frequent in Čabrunići (53.8%), reflecting common guest stay durations or potential owner blocking patterns.
- A notable 3.8% of properties secure long booking periods (181+ days booked per year), highlighting successful long-term rental strategies or significant owner usage.
Čabrunići Airbnb Minimum Stay Requirements Analysis
Distribution of Listings by Minimum Night Requirement
1 Night
4 listings
15.4% of total
2 Nights
1 listings
3.8% of total
4-6 Nights
9 listings
34.6% of total
7-29 Nights
5 listings
19.2% of total
30+ Nights
7 listings
26.9% of total
Key Insights
- The most prevalent minimum stay requirement in Čabrunići is 4-6 Nights, adopted by 34.6% of listings. This highlights the market's preference for longer commitments.
- Very short stays (1-2 nights) are less common (19.2%), suggesting hosts prefer slightly longer bookings to optimize turnover.
- A significant segment (26.9%) caters to monthly stays (30+ nights) in Čabrunići, pointing to opportunities in the extended-stay market.
Recommendations
- Align with the market by considering a 4-6 Nights minimum stay, as 34.6% of Čabrunići hosts use this setting.
- If feasible, allowing 1-night stays, especially midweek or during low season, could capture last-minute bookings, as only 15.4% currently do.
- Explore offering discounts for stays of 30+ nights to attract the 26.9% of the market seeking extended stays.
- Adjust minimum nights based on seasonality – potentially shorter during low season and longer during peak demand periods in Čabrunići.
Čabrunići Airbnb Cancellation Policy Trends Analysis (2026)
Super Strict 60 Days
12 listings
46.2% of total
Super Strict 30 Days
2 listings
7.7% of total
Firm
9 listings
34.6% of total
Strict
3 listings
11.5% of total
Cancellation Policy Insights for Čabrunići
- The prevailing Airbnb cancellation policy trend in Čabrunići is Super Strict 60 Days, used by 46.2% of listings.
- There's a relatively balanced mix between guest-friendly (0.0%) and stricter (46.1%) policies, offering choices for different guest needs.
Recommendations for Hosts
- Consider adopting a Super Strict 60 Days policy to align with the 46.2% market standard in Čabrunići.
- Using a Strict policy might deter some guests, as only 11.5% of listings use it. Evaluate if potential revenue protection outweighs possible lower booking rates.
- Regularly review your cancellation policy against competitors and market demand shifts in Čabrunići.
Čabrunići STR Booking Lead Time Analysis (2026)
Average Booking Lead Time by Month
Booking Lead Time Insights for Čabrunići
- The overall average booking lead time for vacation rentals in Čabrunići is 91 days.
- Guests book furthest in advance for stays during March (average 193 days), likely coinciding with peak travel demand or local events.
- The shortest booking windows occur for stays in November (average 0 days), indicating more last-minute travel plans during this time.
- Seasonally, Summer (111 days avg.) sees the longest lead times, while Winter (31 days avg.) has the shortest, reflecting typical travel planning cycles.
Recommendations for Hosts
- Use the overall average lead time (91 days) as a baseline for your pricing and availability strategy in Čabrunići.
- For March stays, consider implementing length-of-stay discounts or slightly higher rates for bookings made less than 193 days out to capitalize on advance planning.
- During November, focus on last-minute booking availability and promotions, as guests book with very short notice (0 days avg.).
- Target marketing efforts for the Summer season well in advance (at least 111 days) to capture early planners.
- Monitor your own booking lead times against these Čabrunići averages to identify opportunities for dynamic pricing adjustments.
Popular & Essential Airbnb Amenities in Čabrunići (2026)
Amenity Prevalence
Amenity Insights for Čabrunići
- Essential amenities in Čabrunići that guests expect include: Kitchen, Air conditioning, Wifi, Free parking on premises, BBQ grill, TV, Coffee maker, Refrigerator. Lacking these (any) could significantly impact bookings.
- Popular amenities like Dishwasher, Cooking basics are common but not universal. Offering these can provide a competitive edge.
Recommendations for Hosts
- Ensure your listing includes all essential amenities for Čabrunići: Kitchen, Air conditioning, Wifi, Free parking on premises, BBQ grill, TV, Coffee maker, Refrigerator.
- Prioritize adding missing essentials: Free parking on premises, BBQ grill, TV, Coffee maker, Refrigerator.
- Consider adding popular differentiators like Dishwasher or Cooking basics to increase appeal.
- Highlight unique or less common amenities you offer (e.g., hot tub, dedicated workspace, EV charger) in your listing description and photos.
- Regularly check competitor amenities in Čabrunići to stay competitive.
Čabrunići Airbnb Guest Demographics & Profile Analysis (2026)
Guest Profile Summary for Čabrunići
- The typical guest profile for Airbnb in Čabrunići consists of predominantly international visitors (96%), with top international origins including Austria, typically belonging to the Post-2000s (Gen Z/Alpha) group (50%), primarily speaking German or English.
- Domestic travelers account for 4.5% of guests.
- Key international markets include Germany (72.7%) and Austria (13.6%).
- Top languages spoken are German (41.2%) followed by English (41.2%).
- A significant demographic segment is the Post-2000s (Gen Z/Alpha) group, representing 50% of guests.
Recommendations for Hosts
- Focus marketing internationally, particularly towards travelers from Austria.
- Offer listing details and communication support in German.
- Tailor amenities and listing descriptions to appeal to the dominant Post-2000s (Gen Z/Alpha) demographic (e.g., highlight fast WiFi, smart home features, local guides).
- Highlight unique local experiences or amenities relevant to the primary guest profile.
- Consider seasonal promotions aligned with peak travel times for key origin markets.
Nearby Short-Term Rental Market Comparison
How does the Čabrunići Airbnb market stack up against its neighbors? Compare key performance metrics like average monthly revenue, ADR, and occupancy rates in surrounding areas to understand the broader regional STR landscape.
| Market | Active Properties | Monthly Revenue | Daily Rate | Avg. Occupancy |
|---|---|---|---|---|
| Cortina d'Ampezzo | 309 | $3,646 | $474.12 | 40% |
| Colle Santa Lucia | 21 | $3,353 | $248.56 | 46% |
| Selina | 15 | $3,339 | $351.70 | 49% |
| Großkirchheim | 12 | $3,022 | $273.94 | 39% |
| Venice | 6,889 | $2,992 | $246.20 | 47% |
| Bad Sankt Leonhard im Lavanttal | 35 | $2,804 | $300.73 | 36% |
| Vodo di Cadore | 43 | $2,775 | $274.36 | 44% |
| Barat | 28 | $2,692 | $425.82 | 36% |
| San Martino d'Alpago | 14 | $2,606 | $201.44 | 40% |
| Nova Vas - Villanova | 17 | $2,563 | $329.02 | 38% |