Poljanak Airbnb Market Analysis 2026: Short Term Rental Data & Vacation Rental Statistics in Lika-Senj County, Croatia
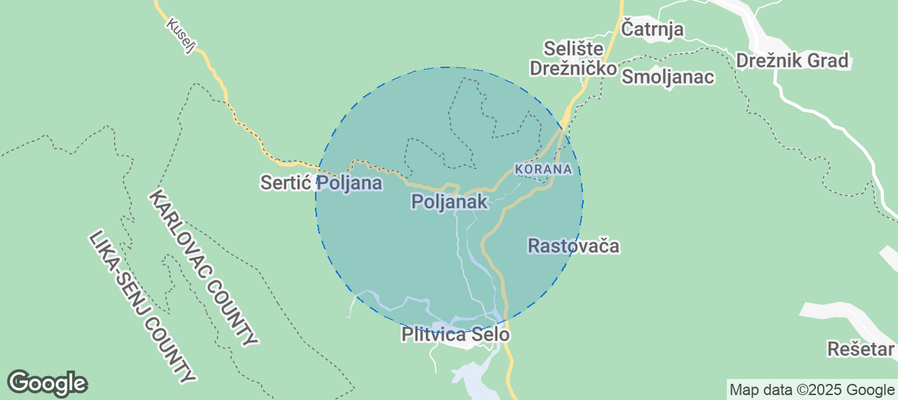
Is Airbnb profitable in Poljanak in 2026? Explore comprehensive Airbnb analytics for Poljanak, Lika-Senj County, Croatia to uncover income potential. This 2026 STR market report for Poljanak, based on AirROI data from February 2025 to January 2026, reveals key trends in the niche market of 33 active listings.
Whether you're considering an Airbnb investment in Poljanak, optimizing your existing vacation rental, or exploring rental arbitrage opportunities, understanding the Poljanak Airbnb data is crucial. Leveraging the low regulation environment is key to maximizing your short term rental income potential. Let's dive into the specifics.
Key Poljanak Airbnb Performance Metrics Overview
Monthly Airbnb Revenue Variations & Income Potential in Poljanak (2026)
Understanding the monthly revenue variations for Airbnb listings in Poljanak is key to maximizing your short term rental income potential. Seasonality significantly impacts earnings. Our analysis, based on data from the past 12 months, shows that the peak revenue month for STRs in Poljanak is typically August, while November often presents the lowest earnings, highlighting opportunities for strategic pricing adjustments during shoulder and low seasons. Explore the typical Airbnb income in Poljanak across different performance tiers:
- Best-in-class properties (Top 10%) achieve $2,603+ monthly, often utilizing dynamic pricing and superior guest experiences.
- Strong performing properties (Top 25%) earn $1,467 or more, indicating effective management and desirable locations/amenities.
- Typical properties (Median) generate around $679 per month, representing the average market performance.
- Entry-level properties (Bottom 25%) see earnings around $308, often with potential for optimization.
Average Monthly Airbnb Earnings Trend in Poljanak
Poljanak Airbnb Occupancy Rate Trends (2026)
Maximize your bookings by understanding the Poljanak STR occupancy trends. Seasonal demand shifts significantly influence how often properties are booked. Typically, Augustsees the highest demand (peak season occupancy), while February experiences the lowest (low season). Effective strategies, like adjusting minimum stays or offering promotions, can boost occupancy during slower periods. Here's how different property tiers perform in Poljanak:
- Best-in-class properties (Top 10%) achieve 68%+ occupancy, indicating high desirability and potentially optimized availability.
- Strong performing properties (Top 25%) maintain 49% or higher occupancy, suggesting good market fit and guest satisfaction.
- Typical properties (Median) have an occupancy rate around 24%.
- Entry-level properties (Bottom 25%) average 14% occupancy, potentially facing higher vacancy.
Average Monthly Occupancy Rate Trend in Poljanak
Average Daily Rate (ADR) Airbnb Trends in Poljanak (2026)
Effective short term rental pricing strategy in Poljanak involves understanding monthly ADR fluctuations. The Average Daily Rate (ADR) for Airbnb in Poljanak typically peaks in December and dips lowest during March. Leveraging Airbnb dynamic pricing tools or strategies based on this seasonality can significantly boost revenue. Here's a look at the typical nightly rates achieved:
- Best-in-class properties (Top 10%) command rates of $183+ per night, often due to premium features or locations.
- Strong performing properties (Top 25%) achieve nightly rates of $117 or more.
- Typical properties (Median) charge around $80 per night.
- Entry-level properties (Bottom 25%) earn around $55 per night.
Average Daily Rate (ADR) Trend by Month in Poljanak
Get Live Poljanak Market Intelligence 👇
Explore Real-time Analytics
Airbnb Seasonality Analysis & Trends in Poljanak (2026)
Peak Season (August, July, March)
- Revenue averages $1,675 per month
- Occupancy rates average 47.3%
- Daily rates average $96
Shoulder Season
- Revenue averages $946 per month
- Occupancy maintains around 30.1%
- Daily rates hold near $97
Low Season (January, February, November)
- Revenue drops to average $636 per month
- Occupancy decreases to average 20.3%
- Daily rates adjust to average $95
Seasonality Insights for Poljanak
- The Airbnb seasonality in Poljanak shows highly seasonal trends requiring careful strategy. While the sections above show seasonal averages, it's also insightful to look at the extremes:
- During the high season, the absolute peak month showcases Poljanak's highest earning potential, with monthly revenues capable of climbing to $1,971, occupancy reaching a high of 57.4%, and ADRs peaking at $128.
- Conversely, the slowest single month of the year, typically falling within the low season, marks the market's lowest point. In this month, revenue might dip to $590, occupancy could drop to 15.2%, and ADRs may adjust down to $83.
- Understanding both the seasonal averages and these monthly peaks and troughs in revenue, occupancy, and ADR is crucial for maximizing your Airbnb profit potential in Poljanak.
Seasonal Strategies for Maximizing Profit
- Peak Season: Maximize revenue through premium pricing and potentially longer minimum stays. Ensure high availability.
- Low Season: Offer competitive pricing, special promotions (e.g., extended stay discounts), and flexible cancellation policies. Target off-season travelers like remote workers or budget-conscious guests.
- Shoulder Seasons: Implement dynamic pricing that balances peak and low rates. Target weekend travelers or specific events. Offer slightly more flexible terms than peak season.
- Regularly analyze your own performance against these Poljanak seasonality benchmarks and adjust your pricing and availability strategy accordingly.
Best Areas for Airbnb Investment in Poljanak (2026)
Exploring the top neighborhoods for short-term rentals in Poljanak? This section highlights key areas, outlining why they are attractive for hosts and guests, along with notable local attractions. Consider these locations based on your target guest profile and investment strategy.
| Neighborhood / Area | Why Host Here? (Target Guests & Appeal) | Key Attractions & Landmarks |
|---|---|---|
| Plitvice Lakes National Park | Famous for its stunning lakes and waterfalls, this UNESCO World Heritage Site attracts millions of tourists each year who seek the beauty of nature and outdoor activities. | Plitvice Lakes, Veliki Slap, Skradinski Buk, K Šuplji, Hiking trails |
| Rastoke | A picturesque village known for its beautiful watermills and scenic waterfalls. It is often called the 'Small Plitvice' and offers a charming blend of nature and history. | Watermills, Waterfalls, Scenic Views, Cafés and Restaurants |
| Slunj | A quaint town close to Plitvice Lakes that offers a peaceful environment and beautiful nature, making it attractive for those seeking tranquility and outdoor adventures. | Slunjčica River, Old Town of Slunj, Parks, Nature Trails |
| Karlovac | A historical city with rich cultural heritage, located along four rivers. Offers various historical sites and a vibrant atmosphere for visitors. | Karlovac Old Town, Aquatika Freshwater Aquarium, Karlovac Fortress, Parks, Museums |
| Otočac | A charming town situated near the Gacka River, known for its fishing and natural beauty. It serves as a gateway to various outdoor activities. | Gacka River, Fishing, Natural Parks, Cafés |
| Senj | A coastal town with a rich history and beautiful beaches. It combines seaside relaxation with cultural attractions, making it a popular getaway. | Senj Fortress, Beaches, Cultural Events, Historic Sites |
| Novalja | A vibrant beach town on the island of Pag, known for its nightlife and beautiful beaches, attracting a younger crowd looking for summer fun. | Zrće Beach, Nightclubs, Cultural Events, Beaches |
| Lički Osik | A small town that offers a quiet countryside experience and proximity to natural attractions, ideal for those looking for a rural retreat. | Nature Areas, Historical Sites, Local Cuisine |
Understanding Airbnb License Requirements & STR Laws in Poljanak (2026)
While Poljanak, Lika-Senj County, Croatia currently shows low STR regulations, specific Airbnb license requirements might still exist or change. Always verify the latest short term rental regulations and Airbnb license requirements directly with local government authorities for Poljanak to ensure full compliance before hosting.
(Source: AirROI data, 2026, finding no licensed listings among those analyzed)
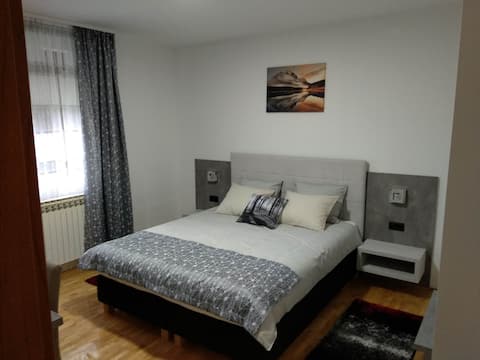
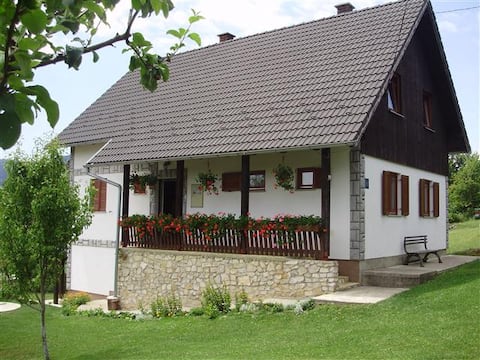
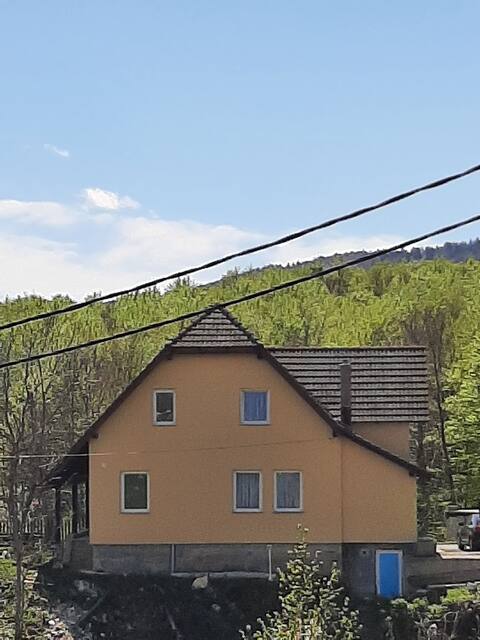
Top Performing Airbnb Properties in Poljanak (2026)
Benchmark your potential! Explore examples of top-performing Airbnb properties in Poljanakbased on Trailing Twelve Month (TTM) revenue. Analyze their characteristics, revenue, occupancy rate, and ADR to understand what drives success in this market.

BeaR's LOG
Entire Place • 3 bedrooms

Cozy House Zivko with Balcony
Entire Place • 1 bedroom
Plitvice Residence - Villa Lucija
Private Room • 2 bedrooms
House Elena
Entire Place • 2 bedrooms
Apartment Zoran
Entire Place • 3 bedrooms
Small wooden house - Apartments Novela
Entire Place • 1 bedroom
Note: Performance varies based on location, size, amenities, seasonality, and management quality. Data reflects the past 12 months.
Top Performing Airbnb Hosts in Poljanak (2026)
Learn from the best! This table showcases top-performing Airbnb hosts in Poljanak based on the number of properties managed and estimated total revenue over the past year. Analyze their scale and performance metrics.
| Host Name | Properties | Grossing Revenue | Stay Reviews | Avg Rating |
|---|---|---|---|---|
| Ivan | 1 | $37,874 | 95 | 5.00/5.0 |
| Ivica | 1 | $36,147 | 117 | 4.94/5.0 |
| Ana | 4 | $35,037 | 373 | 4.90/5.0 |
| Katica | 6 | $32,902 | 1020 | 4.58/5.0 |
| Predrag | 2 | $29,254 | 386 | 4.86/5.0 |
| Renato | 2 | $27,354 | 741 | 4.83/5.0 |
| Mario | 2 | $23,111 | 588 | 4.78/5.0 |
| Zoran | 1 | $17,644 | 60 | 4.68/5.0 |
| Mate | 1 | $16,852 | 56 | 4.89/5.0 |
| Dalibor & Tea | 1 | $15,976 | 236 | 4.95/5.0 |
Analyzing the strategies of top hosts, such as their property selection, pricing, and guest communication, can offer valuable lessons for optimizing your own Airbnb operations in Poljanak.
Dive Deeper: Advanced Poljanak STR Market Data (2026)
Ready to unlock more insights? AirROI provides access to advanced metrics and comprehensive Airbnb data for Poljanak. Explore detailed analytics beyond this report to refine your investment strategy, optimize pricing, and maximize your vacation rental profits.
Explore Advanced MetricsPoljanak Short-Term Rental Market Composition (2026): Property & Room Types
Room Type Distribution
Property Type Distribution
Market Composition Insights for Poljanak
- The Poljanak Airbnb market composition is heavily skewed towards Entire Home/Apt listings, which make up 51.5% of the 33 active rentals. This indicates strong guest preference for privacy and space.
- However, a notable 48.5% share for Private Rooms suggests opportunities for budget-conscious travelers or hosts renting out spare rooms.
- Looking at the property type distribution in Poljanak, House properties are the most common (72.7%), reflecting the local real estate landscape.
- Houses represent a significant 72.7% portion, catering likely to families or larger groups.
- The presence of 12.1% Hotel/Boutique listings indicates integration with traditional hospitality.
- Smaller segments like outdoor/unique (combined 3.0%) offer potential for unique stay experiences.
Poljanak Airbnb Room Capacity Analysis (2026): Bedroom Distribution
Distribution of Listings by Number of Bedrooms
Room Capacity Insights for Poljanak
- The dominant room capacity in Poljanak is 1 bedroom listings, making up 36.4% of the market. This suggests a strong demand for properties suitable for couples or solo travelers.
- Together, 1 bedroom and 2 bedrooms properties represent 57.6% of the active Airbnb listings in Poljanak, indicating a high concentration in these sizes.
- Listings with 3+ bedrooms (9.1%) represent a smaller niche, potentially indicating an underserved market for larger group accommodations in Poljanak.
Poljanak Vacation Rental Guest Capacity Trends (2026)
Distribution of Listings by Guest Capacity
Guest Capacity Insights for Poljanak
- The most common guest capacity trend in Poljanak vacation rentals is listings accommodating 3 guests (15.2%). This suggests the primary traveler segment is likely small families or groups.
- Properties designed for 3 guests and 2 guests dominate the Poljanak STR market, accounting for 30.4% of listings.
- On average, properties in Poljanak are equipped to host 2.3 guests.
Poljanak Airbnb Booking Patterns (2026): Available vs. Booked Days
Available Days Distribution
Booked Days Distribution
Booking Pattern Insights for Poljanak
- The most common availability pattern in Poljanak falls within the 271-366 days range, representing 60.6% of listings. This suggests many properties have significant open periods on their calendars.
- Approximately 87.9% of listings show high availability (181+ days open annually), indicating potential for increased bookings or specific owner usage patterns.
- For booked days, the 31-90 days range is most frequent in Poljanak (51.5%), reflecting common guest stay durations or potential owner blocking patterns.
- A notable 12.1% of properties secure long booking periods (181+ days booked per year), highlighting successful long-term rental strategies or significant owner usage.
Poljanak Airbnb Minimum Stay Requirements Analysis
Distribution of Listings by Minimum Night Requirement
1 Night
25 listings
75.8% of total
30+ Nights
8 listings
24.2% of total
Key Insights
- The most prevalent minimum stay requirement in Poljanak is 1 Night, adopted by 75.8% of listings. This highlights the market's preference for shorter, flexible bookings.
- A strong majority (75.8%) of the Poljanak Airbnb data shows acceptance of very short stays (1-2 nights), indicating a dynamic, high-turnover market.
- A significant segment (24.2%) caters to monthly stays (30+ nights) in Poljanak, pointing to opportunities in the extended-stay market.
Recommendations
- Align with the market by considering a 1 Night minimum stay, as 75.8% of Poljanak hosts use this setting.
- Explore offering discounts for stays of 30+ nights to attract the 24.2% of the market seeking extended stays.
- Adjust minimum nights based on seasonality – potentially shorter during low season and longer during peak demand periods in Poljanak.
Poljanak Airbnb Cancellation Policy Trends Analysis (2026)
Super Strict 60 Days
1 listings
3% of total
Flexible
14 listings
42.4% of total
Moderate
17 listings
51.5% of total
Firm
1 listings
3% of total
Cancellation Policy Insights for Poljanak
- The prevailing Airbnb cancellation policy trend in Poljanak is Moderate, used by 51.5% of listings.
- The market strongly favors guest-friendly terms, with 93.9% of listings offering Flexible or Moderate policies. This suggests guests in Poljanak may expect booking flexibility.
Recommendations for Hosts
- Consider adopting a Moderate policy to align with the 51.5% market standard in Poljanak.
- Regularly review your cancellation policy against competitors and market demand shifts in Poljanak.
Poljanak STR Booking Lead Time Analysis (2026)
Average Booking Lead Time by Month
Booking Lead Time Insights for Poljanak
- The overall average booking lead time for vacation rentals in Poljanak is 55 days.
- Guests book furthest in advance for stays during August (average 82 days), likely coinciding with peak travel demand or local events.
- The shortest booking windows occur for stays in January (average 23 days), indicating more last-minute travel plans during this time.
- Seasonally, Summer (65 days avg.) sees the longest lead times, while Winter (49 days avg.) has the shortest, reflecting typical travel planning cycles.
Recommendations for Hosts
- Use the overall average lead time (55 days) as a baseline for your pricing and availability strategy in Poljanak.
- For August stays, consider implementing length-of-stay discounts or slightly higher rates for bookings made less than 82 days out to capitalize on advance planning.
- Target marketing efforts for the Summer season well in advance (at least 65 days) to capture early planners.
- Monitor your own booking lead times against these Poljanak averages to identify opportunities for dynamic pricing adjustments.
Popular & Essential Airbnb Amenities in Poljanak (2026)
Amenity Prevalence
Amenity Insights for Poljanak
- Essential amenities in Poljanak that guests expect include: Wifi, TV, Free parking on premises. Lacking these (any) could significantly impact bookings.
- Popular amenities like Hot water, Heating, Kitchen are common but not universal. Offering these can provide a competitive edge.
Recommendations for Hosts
- Ensure your listing includes all essential amenities for Poljanak: Wifi, TV, Free parking on premises.
- Consider adding popular differentiators like Hot water or Heating to increase appeal.
- Highlight unique or less common amenities you offer (e.g., hot tub, dedicated workspace, EV charger) in your listing description and photos.
- Regularly check competitor amenities in Poljanak to stay competitive.
Poljanak Airbnb Guest Demographics & Profile Analysis (2026)
Guest Profile Summary for Poljanak
- The typical guest profile for Airbnb in Poljanak consists of predominantly international visitors (99%), with top international origins including France, typically belonging to the Post-2000s (Gen Z/Alpha) group (50%), primarily speaking English or French.
- Domestic travelers account for 1.2% of guests.
- Key international markets include United States (31.8%) and France (9.5%).
- Top languages spoken are English (47.8%) followed by French (9.9%).
- A significant demographic segment is the Post-2000s (Gen Z/Alpha) group, representing 50% of guests.
Recommendations for Hosts
- Focus marketing internationally, particularly towards travelers from France.
- Tailor amenities and listing descriptions to appeal to the dominant Post-2000s (Gen Z/Alpha) demographic (e.g., highlight fast WiFi, smart home features, local guides).
- Highlight unique local experiences or amenities relevant to the primary guest profile.
- Consider seasonal promotions aligned with peak travel times for key origin markets.
Nearby Short-Term Rental Market Comparison
How does the Poljanak Airbnb market stack up against its neighbors? Compare key performance metrics like average monthly revenue, ADR, and occupancy rates in surrounding areas to understand the broader regional STR landscape.
| Market | Active Properties | Monthly Revenue | Daily Rate | Avg. Occupancy |
|---|---|---|---|---|
| Poljica Brig | 16 | $3,948 | $523.01 | 52% |
| Zemunik Gornji | 12 | $3,347 | $325.85 | 52% |
| Općina Klis | 89 | $3,316 | $360.31 | 51% |
| Srinjine | 40 | $3,213 | $369.86 | 48% |
| Strožanac Gornji | 36 | $3,151 | $379.58 | 45% |
| Gornje Sitno | 12 | $3,148 | $334.61 | 53% |
| Murvica | 30 | $3,023 | $359.79 | 45% |
| Gornja Podstrana | 41 | $2,962 | $327.55 | 53% |
| Crno | 16 | $2,891 | $442.64 | 32% |
| Dugopolje | 21 | $2,828 | $318.91 | 48% |