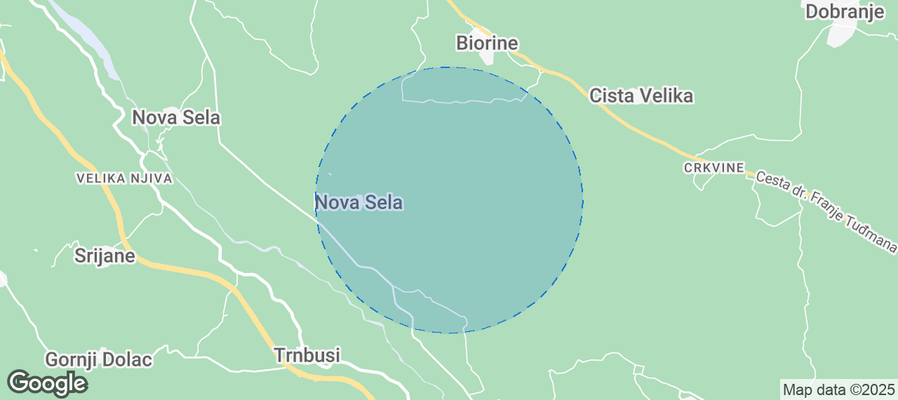
Sita Airbnb Market Analysis 2026: Short Term Rental Data & Vacation Rental Statistics in Splitsko-dalmatinska županija, Croatia
Is Airbnb profitable in Sita in 2026? Explore comprehensive Airbnb analytics for Sita, Splitsko-dalmatinska županija, Croatia to uncover income potential. This 2026 STR market report for Sita, based on AirROI data from February 2025 to January 2026, reveals key trends in the niche market of 94 active listings.
Whether you're considering an Airbnb investment in Sita, optimizing your existing vacation rental, or exploring rental arbitrage opportunities, understanding the Sita Airbnb data is crucial. Leveraging the low regulation environment is key to maximizing your short term rental income potential. Let's dive into the specifics.
Key Sita Airbnb Performance Metrics Overview
Monthly Airbnb Revenue Variations & Income Potential in Sita (2026)
Understanding the monthly revenue variations for Airbnb listings in Sita is key to maximizing your short term rental income potential. Seasonality significantly impacts earnings. Our analysis, based on data from the past 12 months, shows that the peak revenue month for STRs in Sita is typically July, while January often presents the lowest earnings, highlighting opportunities for strategic pricing adjustments during shoulder and low seasons. Explore the typical Airbnb income in Sita across different performance tiers:
- Best-in-class properties (Top 10%) achieve $6,870+ monthly, often utilizing dynamic pricing and superior guest experiences.
- Strong performing properties (Top 25%) earn $2,983 or more, indicating effective management and desirable locations/amenities.
- Typical properties (Median) generate around $1,570 per month, representing the average market performance.
- Entry-level properties (Bottom 25%) see earnings around $744, often with potential for optimization.
Average Monthly Airbnb Earnings Trend in Sita
Sita Airbnb Occupancy Rate Trends (2026)
Maximize your bookings by understanding the Sita STR occupancy trends. Seasonal demand shifts significantly influence how often properties are booked. Typically, Augustsees the highest demand (peak season occupancy), while January experiences the lowest (low season). Effective strategies, like adjusting minimum stays or offering promotions, can boost occupancy during slower periods. Here's how different property tiers perform in Sita:
- Best-in-class properties (Top 10%) achieve 61%+ occupancy, indicating high desirability and potentially optimized availability.
- Strong performing properties (Top 25%) maintain 48% or higher occupancy, suggesting good market fit and guest satisfaction.
- Typical properties (Median) have an occupancy rate around 30%.
- Entry-level properties (Bottom 25%) average 16% occupancy, potentially facing higher vacancy.
Average Monthly Occupancy Rate Trend in Sita
Average Daily Rate (ADR) Airbnb Trends in Sita (2026)
Effective short term rental pricing strategy in Sita involves understanding monthly ADR fluctuations. The Average Daily Rate (ADR) for Airbnb in Sita typically peaks in July and dips lowest during March. Leveraging Airbnb dynamic pricing tools or strategies based on this seasonality can significantly boost revenue. Here's a look at the typical nightly rates achieved:
- Best-in-class properties (Top 10%) command rates of $598+ per night, often due to premium features or locations.
- Strong performing properties (Top 25%) achieve nightly rates of $239 or more.
- Typical properties (Median) charge around $155 per night.
- Entry-level properties (Bottom 25%) earn around $108 per night.
Average Daily Rate (ADR) Trend by Month in Sita
Get Live Sita Market Intelligence 👇
Explore Real-time Analytics
Airbnb Seasonality Analysis & Trends in Sita (2026)
Peak Season (July, August, May)
- Revenue averages $4,566 per month
- Occupancy rates average 54.6%
- Daily rates average $261
Shoulder Season
- Revenue averages $2,612 per month
- Occupancy maintains around 31.9%
- Daily rates hold near $242
Low Season (January, February, December)
- Revenue drops to average $978 per month
- Occupancy decreases to average 10.7%
- Daily rates adjust to average $258
Seasonality Insights for Sita
- The Airbnb seasonality in Sita shows highly seasonal trends requiring careful strategy. While the sections above show seasonal averages, it's also insightful to look at the extremes:
- During the high season, the absolute peak month showcases Sita's highest earning potential, with monthly revenues capable of climbing to $5,394, occupancy reaching a high of 62.8%, and ADRs peaking at $275.
- Conversely, the slowest single month of the year, typically falling within the low season, marks the market's lowest point. In this month, revenue might dip to $702, occupancy could drop to 7.9%, and ADRs may adjust down to $228.
- Understanding both the seasonal averages and these monthly peaks and troughs in revenue, occupancy, and ADR is crucial for maximizing your Airbnb profit potential in Sita.
Seasonal Strategies for Maximizing Profit
- Peak Season: Maximize revenue through premium pricing and potentially longer minimum stays. Ensure high availability.
- Low Season: Offer competitive pricing, special promotions (e.g., extended stay discounts), and flexible cancellation policies. Target off-season travelers like remote workers or budget-conscious guests.
- Shoulder Seasons: Implement dynamic pricing that balances peak and low rates. Target weekend travelers or specific events. Offer slightly more flexible terms than peak season.
- Regularly analyze your own performance against these Sita seasonality benchmarks and adjust your pricing and availability strategy accordingly.
Best Areas for Airbnb Investment in Sita (2026)
Exploring the top neighborhoods for short-term rentals in Sita? This section highlights key areas, outlining why they are attractive for hosts and guests, along with notable local attractions. Consider these locations based on your target guest profile and investment strategy.
| Neighborhood / Area | Why Host Here? (Target Guests & Appeal) | Key Attractions & Landmarks |
|---|---|---|
| Sita | A quaint village located in the picturesque settings of the Split-Dalmatia County, Sita is ideal for those looking to experience traditional Croatian lifestyle while being close to the beautiful Adriatic coast. | St. Nicholas Church, Local vineyards, Hiking trails, Near the beaches of Makarska, Cultural festivals |
| Makarska | A popular tourist destination known for its stunning waterfront, beaches, and vibrant nightlife. It offers numerous activities for tourists and is perfect for short-term rentals. | Makarska Beaches, Makarska Waterfront Promenade, Biokovo Mountain, Local markets, Cafés and restaurants |
| Brela | Famous for its beautiful beaches and crystal-clear waters, Brela attracts beach lovers and nature enthusiasts, making it a great place for short-term rentals. | Punta Rata Beach, Brela Stone, Water sports, Nature walks, Nearby mountains |
| Brela | This small town is renowned for its stunning coastline, making it a great place for beachgoers and those looking for relaxation. | Brela Beach, Sveti Nikola Island, Water sports, Local restaurants, Peaceful atmosphere |
| Tučepi | A coastal town with beautiful beaches and a variety of restaurants and bars, ideal for tourists looking to enjoy the Dalmatian coast. | Tučepi Beach, Local bars and nightlife, Cultural events, Water sports activities, Nature parks nearby |
| Podgora | This charming town offers picturesque beaches and a laid-back atmosphere, suitable for families and those looking for a peaceful retreat. | Podgora Beach, Pine tree promenade, Local seafood restaurants, Hiking trails, Access to nearby islands |
| Tučepi | Known for its long pebble beach and vibrant promenade, Tučepi is a lively destination for holidaymakers enjoying sun and sea. | Tučepi Marina, Hiking in Biokovo, Cafés and nightlife, Local markets, Sea excursions |
| Solin | Close to Split, Solin offers access to historical sites and cultural heritage, making it attractive for visitors interested in history. | Ruins of Salona, Museum of Solin, Local festivals, Proximity to Split, Parks and nature trails |
Understanding Airbnb License Requirements & STR Laws in Sita (2026)
While Sita, Splitsko-dalmatinska županija, Croatia currently shows low STR regulations, specific Airbnb license requirements might still exist or change. Always verify the latest short term rental regulations and Airbnb license requirements directly with local government authorities for Sita to ensure full compliance before hosting.
(Source: AirROI data, 2026, finding no licensed listings among those analyzed)
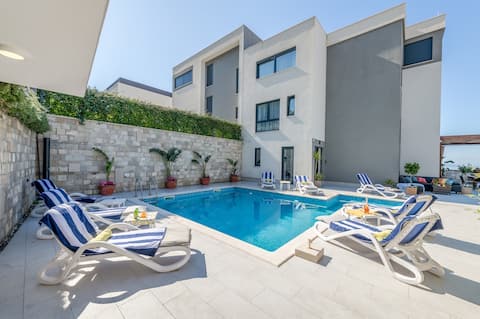
Top Performing Airbnb Properties in Sita (2026)
Benchmark your potential! Explore examples of top-performing Airbnb properties in Sitabased on Trailing Twelve Month (TTM) revenue. Analyze their characteristics, revenue, occupancy rate, and ADR to understand what drives success in this market.
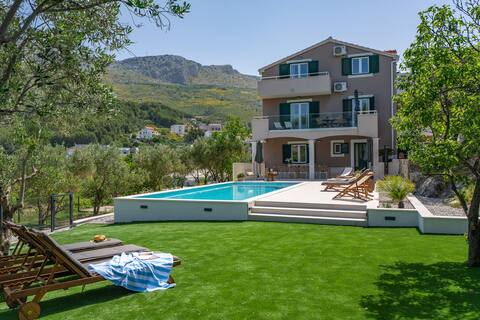
Villa Mamma Mia, a 6-bedroom property with pool
Entire Place • 6 bedrooms

Croliday Villa Viginti 2
Entire Place • 8 bedrooms

www VillaGoldenHill com
Entire Place • 4 bedrooms
Villa Blue Sky, heated pool, jacuzzi, breakfast
Entire Place • 4 bedrooms
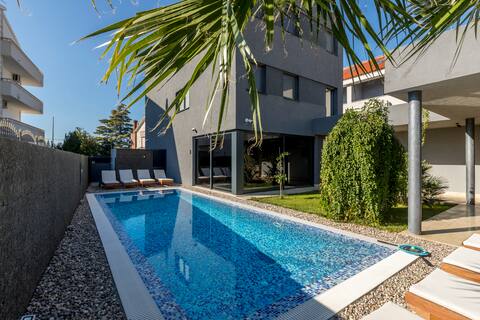
Dalmatic Star
Entire Place • 4 bedrooms

Holiday home Luka
Entire Place • 5 bedrooms
Note: Performance varies based on location, size, amenities, seasonality, and management quality. Data reflects the past 12 months.
Top Performing Airbnb Hosts in Sita (2026)
Learn from the best! This table showcases top-performing Airbnb hosts in Sita based on the number of properties managed and estimated total revenue over the past year. Analyze their scale and performance metrics.
| Host Name | Properties | Grossing Revenue | Stay Reviews | Avg Rating |
|---|---|---|---|---|
| Ferie Home Agency | 1 | $127,678 | 15 | 4.93/5.0 |
| Petra | 1 | $118,048 | 22 | 5.00/5.0 |
| Petra | 1 | $112,141 | 10 | 5.00/5.0 |
| Croatia Tours | 1 | $100,480 | 31 | 4.94/5.0 |
| Roko | 2 | $88,825 | 11 | 5.00/5.0 |
| Katarina | 4 | $71,913 | 125 | 4.90/5.0 |
| Slobodan | 1 | $62,266 | 30 | 4.93/5.0 |
| Luka | 1 | $56,557 | 65 | 4.95/5.0 |
| Irena | 1 | $49,306 | 24 | 5.00/5.0 |
| Marko | 3 | $49,124 | 146 | 4.96/5.0 |
Analyzing the strategies of top hosts, such as their property selection, pricing, and guest communication, can offer valuable lessons for optimizing your own Airbnb operations in Sita.
Dive Deeper: Advanced Sita STR Market Data (2026)
Ready to unlock more insights? AirROI provides access to advanced metrics and comprehensive Airbnb data for Sita. Explore detailed analytics beyond this report to refine your investment strategy, optimize pricing, and maximize your vacation rental profits.
Explore Advanced MetricsSita Short-Term Rental Market Composition (2026): Property & Room Types
Room Type Distribution
Property Type Distribution
Market Composition Insights for Sita
- The Sita Airbnb market composition is heavily skewed towards Entire Home/Apt listings, which make up 100% of the 94 active rentals. This indicates strong guest preference for privacy and space.
- Looking at the property type distribution in Sita, Apartment/Condo properties are the most common (76.6%), reflecting the local real estate landscape.
- Houses represent a significant 22.3% portion, catering likely to families or larger groups.
- Smaller segments like others (combined 1.1%) offer potential for unique stay experiences.
Sita Airbnb Room Capacity Analysis (2026): Bedroom Distribution
Distribution of Listings by Number of Bedrooms
Room Capacity Insights for Sita
- The dominant room capacity in Sita is 1 bedroom listings, making up 39.4% of the market. This suggests a strong demand for properties suitable for couples or solo travelers.
- Together, 1 bedroom and 2 bedrooms properties represent 62.8% of the active Airbnb listings in Sita, indicating a high concentration in these sizes.
- A significant 31.9% of listings offer 3+ bedrooms, catering to larger groups and families seeking more space in Sita.
Sita Vacation Rental Guest Capacity Trends (2026)
Distribution of Listings by Guest Capacity
Guest Capacity Insights for Sita
- The most common guest capacity trend in Sita vacation rentals is listings accommodating 4 guests (27.7%). This suggests the primary traveler segment is likely small families or groups.
- Properties designed for 4 guests and 2 guests dominate the Sita STR market, accounting for 47.9% of listings.
- 36.2% of properties accommodate 6+ guests, serving the market segment for larger families or group travel in Sita.
- On average, properties in Sita are equipped to host 4.7 guests.
Sita Airbnb Booking Patterns (2026): Available vs. Booked Days
Available Days Distribution
Booked Days Distribution
Booking Pattern Insights for Sita
- The most common availability pattern in Sita falls within the 271-366 days range, representing 74.5% of listings. This suggests many properties have significant open periods on their calendars.
- Approximately 99.0% of listings show high availability (181+ days open annually), indicating potential for increased bookings or specific owner usage patterns.
- For booked days, the 31-90 days range is most frequent in Sita (51.1%), reflecting common guest stay durations or potential owner blocking patterns.
- A notable 2.1% of properties secure long booking periods (181+ days booked per year), highlighting successful long-term rental strategies or significant owner usage.
Sita Airbnb Minimum Stay Requirements Analysis
Distribution of Listings by Minimum Night Requirement
1 Night
7 listings
7.4% of total
2 Nights
6 listings
6.4% of total
3 Nights
16 listings
17% of total
4-6 Nights
27 listings
28.7% of total
7-29 Nights
3 listings
3.2% of total
30+ Nights
35 listings
37.2% of total
Key Insights
- The most prevalent minimum stay requirement in Sita is 30+ Nights, adopted by 37.2% of listings. This highlights the market's preference for longer commitments.
- Very short stays (1-2 nights) are less common (13.8%), suggesting hosts prefer slightly longer bookings to optimize turnover.
- A significant segment (37.2%) caters to monthly stays (30+ nights) in Sita, pointing to opportunities in the extended-stay market.
Recommendations
- Align with the market by considering a 30+ Nights minimum stay, as 37.2% of Sita hosts use this setting.
- If feasible, allowing 1-night stays, especially midweek or during low season, could capture last-minute bookings, as only 7.4% currently do.
- Explore offering discounts for stays of 30+ nights to attract the 37.2% of the market seeking extended stays.
- Adjust minimum nights based on seasonality – potentially shorter during low season and longer during peak demand periods in Sita.
Sita Airbnb Cancellation Policy Trends Analysis (2026)
Limited
2 listings
2.1% of total
Super Strict 60 Days
4 listings
4.3% of total
Super Strict 30 Days
3 listings
3.2% of total
Flexible
12 listings
12.8% of total
Moderate
17 listings
18.1% of total
Firm
35 listings
37.2% of total
Strict
21 listings
22.3% of total
Cancellation Policy Insights for Sita
- The prevailing Airbnb cancellation policy trend in Sita is Firm, used by 37.2% of listings.
- A majority (59.5%) of hosts in Sita utilize Firm or Strict policies, indicating a market where hosts prioritize booking security.
Recommendations for Hosts
- Consider adopting a Firm policy to align with the 37.2% market standard in Sita.
- Regularly review your cancellation policy against competitors and market demand shifts in Sita.
Sita STR Booking Lead Time Analysis (2026)
Average Booking Lead Time by Month
Booking Lead Time Insights for Sita
- The overall average booking lead time for vacation rentals in Sita is 63 days.
- Guests book furthest in advance for stays during May (average 84 days), likely coinciding with peak travel demand or local events.
- The shortest booking windows occur for stays in November (average 5 days), indicating more last-minute travel plans during this time.
- Seasonally, Summer (74 days avg.) sees the longest lead times, while Winter (34 days avg.) has the shortest, reflecting typical travel planning cycles.
Recommendations for Hosts
- Use the overall average lead time (63 days) as a baseline for your pricing and availability strategy in Sita.
- For May stays, consider implementing length-of-stay discounts or slightly higher rates for bookings made less than 84 days out to capitalize on advance planning.
- During November, focus on last-minute booking availability and promotions, as guests book with very short notice (5 days avg.).
- Target marketing efforts for the Summer season well in advance (at least 74 days) to capture early planners.
- Monitor your own booking lead times against these Sita averages to identify opportunities for dynamic pricing adjustments.
Popular & Essential Airbnb Amenities in Sita (2026)
Amenity Prevalence
Amenity Insights for Sita
- Essential amenities in Sita that guests expect include: Air conditioning, Wifi, Kitchen, TV, Free parking on premises. Lacking these (any) could significantly impact bookings.
- Popular amenities like Hair dryer, Essentials, Washer are common but not universal. Offering these can provide a competitive edge.
Recommendations for Hosts
- Ensure your listing includes all essential amenities for Sita: Air conditioning, Wifi, Kitchen, TV, Free parking on premises.
- Prioritize adding missing essentials: Kitchen, TV, Free parking on premises.
- Consider adding popular differentiators like Hair dryer or Essentials to increase appeal.
- Highlight unique or less common amenities you offer (e.g., hot tub, dedicated workspace, EV charger) in your listing description and photos.
- Regularly check competitor amenities in Sita to stay competitive.
Sita Airbnb Guest Demographics & Profile Analysis (2026)
Guest Profile Summary for Sita
- The typical guest profile for Airbnb in Sita consists of predominantly international visitors (99%), with top international origins including France, typically belonging to the Post-2000s (Gen Z/Alpha) group (50%), primarily speaking English or French.
- Domestic travelers account for 1.3% of guests.
- Key international markets include United Kingdom (18.2%) and France (13.8%).
- Top languages spoken are English (38.1%) followed by French (13.2%).
- A significant demographic segment is the Post-2000s (Gen Z/Alpha) group, representing 50% of guests.
Recommendations for Hosts
- Focus marketing internationally, particularly towards travelers from France.
- Tailor amenities and listing descriptions to appeal to the dominant Post-2000s (Gen Z/Alpha) demographic (e.g., highlight fast WiFi, smart home features, local guides).
- Highlight unique local experiences or amenities relevant to the primary guest profile.
- Consider seasonal promotions aligned with peak travel times for key origin markets.
Nearby Short-Term Rental Market Comparison
How does the Sita Airbnb market stack up against its neighbors? Compare key performance metrics like average monthly revenue, ADR, and occupancy rates in surrounding areas to understand the broader regional STR landscape.
| Market | Active Properties | Monthly Revenue | Daily Rate | Avg. Occupancy |
|---|---|---|---|---|
| Poljica Brig | 16 | $3,948 | $523.01 | 52% |
| Grubine | 29 | $3,472 | $394.57 | 52% |
| Zemunik Gornji | 12 | $3,347 | $325.85 | 52% |
| Općina Klis | 89 | $3,316 | $360.31 | 51% |
| Srinjine | 40 | $3,213 | $369.86 | 48% |
| Strožanac Gornji | 36 | $3,151 | $379.58 | 45% |
| Gornje Sitno | 12 | $3,148 | $334.61 | 53% |
| Murvica | 30 | $3,023 | $359.79 | 45% |
| Gornja Podstrana | 41 | $2,962 | $327.55 | 53% |
| Crno | 16 | $2,891 | $442.64 | 32% |