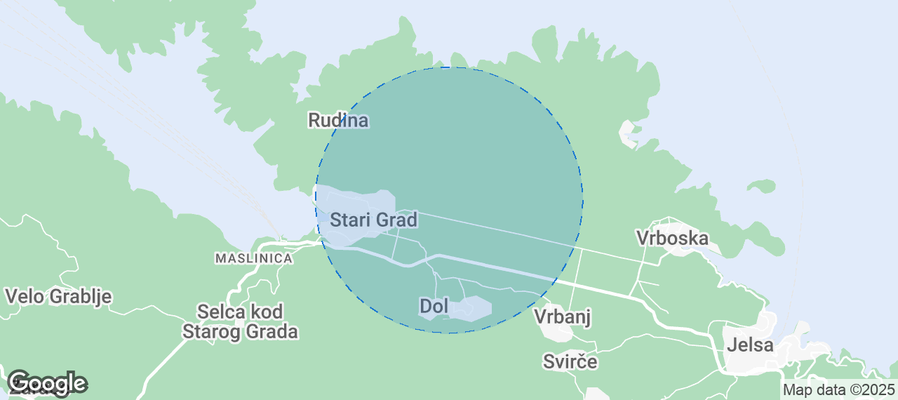
Grad Stari Grad Airbnb Market Analysis 2026: Short Term Rental Data & Vacation Rental Statistics in Splitsko-dalmatinska županija, Croatia
Is Airbnb profitable in Grad Stari Grad in 2026? Explore comprehensive Airbnb analytics for Grad Stari Grad, Splitsko-dalmatinska županija, Croatia to uncover income potential. This 2026 STR market report for Grad Stari Grad, based on AirROI data from February 2025 to January 2026, reveals key trends in the market of 311 active listings.
Whether you're considering an Airbnb investment in Grad Stari Grad, optimizing your existing vacation rental, or exploring rental arbitrage opportunities, understanding the Grad Stari Grad Airbnb data is crucial. Leveraging the low regulation environment is key to maximizing your short term rental income potential. Let's dive into the specifics.
Key Grad Stari Grad Airbnb Performance Metrics Overview
Monthly Airbnb Revenue Variations & Income Potential in Grad Stari Grad (2026)
Understanding the monthly revenue variations for Airbnb listings in Grad Stari Grad is key to maximizing your short term rental income potential. Seasonality significantly impacts earnings. Our analysis, based on data from the past 12 months, shows that the peak revenue month for STRs in Grad Stari Grad is typically August, while January often presents the lowest earnings, highlighting opportunities for strategic pricing adjustments during shoulder and low seasons. Explore the typical Airbnb income in Grad Stari Grad across different performance tiers:
- Best-in-class properties (Top 10%) achieve $3,842+ monthly, often utilizing dynamic pricing and superior guest experiences.
- Strong performing properties (Top 25%) earn $2,006 or more, indicating effective management and desirable locations/amenities.
- Typical properties (Median) generate around $961 per month, representing the average market performance.
- Entry-level properties (Bottom 25%) see earnings around $479, often with potential for optimization.
Average Monthly Airbnb Earnings Trend in Grad Stari Grad
Grad Stari Grad Airbnb Occupancy Rate Trends (2026)
Maximize your bookings by understanding the Grad Stari Grad STR occupancy trends. Seasonal demand shifts significantly influence how often properties are booked. Typically, Augustsees the highest demand (peak season occupancy), while January experiences the lowest (low season). Effective strategies, like adjusting minimum stays or offering promotions, can boost occupancy during slower periods. Here's how different property tiers perform in Grad Stari Grad:
- Best-in-class properties (Top 10%) achieve 63%+ occupancy, indicating high desirability and potentially optimized availability.
- Strong performing properties (Top 25%) maintain 44% or higher occupancy, suggesting good market fit and guest satisfaction.
- Typical properties (Median) have an occupancy rate around 27%.
- Entry-level properties (Bottom 25%) average 13% occupancy, potentially facing higher vacancy.
Average Monthly Occupancy Rate Trend in Grad Stari Grad
Average Daily Rate (ADR) Airbnb Trends in Grad Stari Grad (2026)
Effective short term rental pricing strategy in Grad Stari Grad involves understanding monthly ADR fluctuations. The Average Daily Rate (ADR) for Airbnb in Grad Stari Grad typically peaks in August and dips lowest during November. Leveraging Airbnb dynamic pricing tools or strategies based on this seasonality can significantly boost revenue. Here's a look at the typical nightly rates achieved:
- Best-in-class properties (Top 10%) command rates of $328+ per night, often due to premium features or locations.
- Strong performing properties (Top 25%) achieve nightly rates of $189 or more.
- Typical properties (Median) charge around $110 per night.
- Entry-level properties (Bottom 25%) earn around $75 per night.
Average Daily Rate (ADR) Trend by Month in Grad Stari Grad
Get Live Grad Stari Grad Market Intelligence 👇
Explore Real-time Analytics
Airbnb Seasonality Analysis & Trends in Grad Stari Grad (2026)
Peak Season (August, July, June)
- Revenue averages $3,162 per month
- Occupancy rates average 49.9%
- Daily rates average $195
Shoulder Season
- Revenue averages $1,481 per month
- Occupancy maintains around 28.2%
- Daily rates hold near $169
Low Season (January, February, December)
- Revenue drops to average $493 per month
- Occupancy decreases to average 17.3%
- Daily rates adjust to average $166
Seasonality Insights for Grad Stari Grad
- The Airbnb seasonality in Grad Stari Grad shows highly seasonal trends requiring careful strategy. While the sections above show seasonal averages, it's also insightful to look at the extremes:
- During the high season, the absolute peak month showcases Grad Stari Grad's highest earning potential, with monthly revenues capable of climbing to $3,603, occupancy reaching a high of 58.7%, and ADRs peaking at $203.
- Conversely, the slowest single month of the year, typically falling within the low season, marks the market's lowest point. In this month, revenue might dip to $350, occupancy could drop to 13.3%, and ADRs may adjust down to $162.
- Understanding both the seasonal averages and these monthly peaks and troughs in revenue, occupancy, and ADR is crucial for maximizing your Airbnb profit potential in Grad Stari Grad.
Seasonal Strategies for Maximizing Profit
- Peak Season: Maximize revenue through premium pricing and potentially longer minimum stays. Ensure high availability.
- Low Season: Offer competitive pricing, special promotions (e.g., extended stay discounts), and flexible cancellation policies. Target off-season travelers like remote workers or budget-conscious guests.
- Shoulder Seasons: Implement dynamic pricing that balances peak and low rates. Target weekend travelers or specific events. Offer slightly more flexible terms than peak season.
- Regularly analyze your own performance against these Grad Stari Grad seasonality benchmarks and adjust your pricing and availability strategy accordingly.
Best Areas for Airbnb Investment in Grad Stari Grad (2026)
Exploring the top neighborhoods for short-term rentals in Grad Stari Grad? This section highlights key areas, outlining why they are attractive for hosts and guests, along with notable local attractions. Consider these locations based on your target guest profile and investment strategy.
| Neighborhood / Area | Why Host Here? (Target Guests & Appeal) | Key Attractions & Landmarks |
|---|---|---|
| Old Town | Historic area filled with beautiful architecture, vibrant local culture, and rich history. A prime location for tourists exploring museums, churches, and local eateries. | Stari Grad Plain, Dominican Monastery, Church of St. Stephen, Stari Grad Museum, Local taverns and cafes |
| Bacvice Beach | Popular beach destination known for its sandy shores and vibrant nightlife. Ideal for tourists seeking sun and sea, as well as nightlife options after sunset. | Bacvice Beach, Charisma Beach Bar, Split Summer Festival, Local restaurants, Water sports activities |
| Marjan Hill | A beautiful natural park and hill offering stunning views of the city and surrounding islands. Attracts nature lovers and those seeking outdoor activities such as hiking and biking. | Riva Promenade, Marjan Park, Vineyards, Religious sites such as St. Nicholas Church, Local hiking trails |
| Split Waterfront (Riva) | The bustling promenade is the heart of Split, with plenty of cafes and restaurants. Great for tourists who enjoy a vibrant atmosphere by the sea. | Riva Promenade, Diocletian's Palace, Local shops and markets, Cafes and restaurants |
| Žnjan Beach | Less crowded beach area suitable for families and those looking for a relaxing day by the sea. Offers a more local experience away from the main tourist areas. | Žnjan Beach, Local beach clubs, Family-friendly activities, Water sports options |
| Pjaca | The main square in the Old Town, surrounded by cafes and shops. A great spot for tourists to relax and enjoy local life. | Pjaca Square, Nearby restaurants, Local shops and boutiques, Cultural events |
| Krka National Park | A stunning national park famous for its waterfalls and natural beauty. Ideal for those who love to explore nature and take day trips. | Waterfalls, Hiking trails, Boat tours, Flora and fauna exploration |
| Trogir | A UNESCO World Heritage site nearby known for its beautiful architecture and charming streets. Attracts tourists looking for day trips and exploration of historic sites. | Trogir Historic Town, Camino de Santiago, Local markets, St. Lawrence Cathedral, 9th-century Fort |
Understanding Airbnb License Requirements & STR Laws in Grad Stari Grad (2026)
While Grad Stari Grad, Splitsko-dalmatinska županija, Croatia currently shows low STR regulations, specific Airbnb license requirements might still exist or change. Always verify the latest short term rental regulations and Airbnb license requirements directly with local government authorities for Grad Stari Grad to ensure full compliance before hosting.
(Source: AirROI data, 2026, finding no licensed listings among those analyzed)
Top Performing Airbnb Properties in Grad Stari Grad (2026)
Benchmark your potential! Explore examples of top-performing Airbnb properties in Grad Stari Gradbased on Trailing Twelve Month (TTM) revenue. Analyze their characteristics, revenue, occupancy rate, and ADR to understand what drives success in this market.

Exceptional new holiday villa on Hvar Island
Entire Place • 5 bedrooms

Hvar, Stari Grad Villa Ekatera, 5 min from center
Entire Place • 3 bedrooms
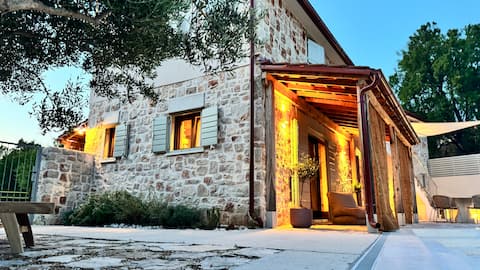
Terra Dolce House - Dol -Hvar
Entire Place • 3 bedrooms

A big sunny house in charming Mala Rudina
Entire Place • 4 bedrooms
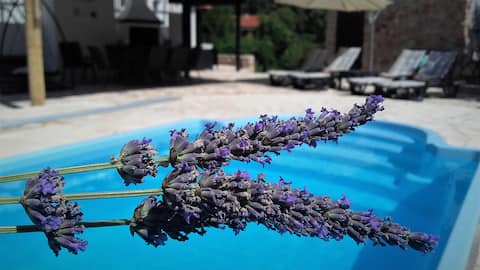
LAVENDER HILL HVAR SPA **** villa
Entire Place • 4 bedrooms

LUXURY VILLA HARPOCRATES HVAR
Entire Place • 5 bedrooms
Note: Performance varies based on location, size, amenities, seasonality, and management quality. Data reflects the past 12 months.
Top Performing Airbnb Hosts in Grad Stari Grad (2026)
Learn from the best! This table showcases top-performing Airbnb hosts in Grad Stari Grad based on the number of properties managed and estimated total revenue over the past year. Analyze their scale and performance metrics.
| Host Name | Properties | Grossing Revenue | Stay Reviews | Avg Rating |
|---|---|---|---|---|
| David | 1 | $147,612 | 14 | 5.00/5.0 |
| Ivanka | 1 | $111,590 | 19 | 5.00/5.0 |
| Cult Travel | 5 | $105,702 | 222 | 4.94/5.0 |
| Tereza | 5 | $103,372 | 10 | 5.00/5.0 |
| Goran | 1 | $96,484 | 17 | 4.82/5.0 |
| Matthew | 3 | $95,739 | 97 | 5.00/5.0 |
| Aleksandra | 3 | $81,737 | 91 | 4.85/5.0 |
| Zarko | 2 | $75,904 | 35 | 4.78/5.0 |
| Andrija I Ana | 3 | $69,092 | 44 | 4.93/5.0 |
| Martin | 1 | $65,946 | 24 | 4.96/5.0 |
Analyzing the strategies of top hosts, such as their property selection, pricing, and guest communication, can offer valuable lessons for optimizing your own Airbnb operations in Grad Stari Grad.
Dive Deeper: Advanced Grad Stari Grad STR Market Data (2026)
Ready to unlock more insights? AirROI provides access to advanced metrics and comprehensive Airbnb data for Grad Stari Grad. Explore detailed analytics beyond this report to refine your investment strategy, optimize pricing, and maximize your vacation rental profits.
Explore Advanced MetricsGrad Stari Grad Short-Term Rental Market Composition (2026): Property & Room Types
Room Type Distribution
Property Type Distribution
Market Composition Insights for Grad Stari Grad
- The Grad Stari Grad Airbnb market composition is heavily skewed towards Entire Home/Apt listings, which make up 90% of the 311 active rentals. This indicates strong guest preference for privacy and space.
- Looking at the property type distribution in Grad Stari Grad, Apartment/Condo properties are the most common (55.9%), reflecting the local real estate landscape.
- Houses represent a significant 41.2% portion, catering likely to families or larger groups.
- Smaller segments like others (combined 2.9%) offer potential for unique stay experiences.
Grad Stari Grad Airbnb Room Capacity Analysis (2026): Bedroom Distribution
Distribution of Listings by Number of Bedrooms
Room Capacity Insights for Grad Stari Grad
- The dominant room capacity in Grad Stari Grad is 1 bedroom listings, making up 33.4% of the market. This suggests a strong demand for properties suitable for couples or solo travelers.
- Together, 1 bedroom and 2 bedrooms properties represent 64.6% of the active Airbnb listings in Grad Stari Grad, indicating a high concentration in these sizes.
- A significant 21.6% of listings offer 3+ bedrooms, catering to larger groups and families seeking more space in Grad Stari Grad.
Grad Stari Grad Vacation Rental Guest Capacity Trends (2026)
Distribution of Listings by Guest Capacity
Guest Capacity Insights for Grad Stari Grad
- The most common guest capacity trend in Grad Stari Grad vacation rentals is listings accommodating 4 guests (23.5%). This suggests the primary traveler segment is likely small families or groups.
- Properties designed for 4 guests and 2 guests dominate the Grad Stari Grad STR market, accounting for 43.4% of listings.
- 25.4% of properties accommodate 6+ guests, serving the market segment for larger families or group travel in Grad Stari Grad.
- On average, properties in Grad Stari Grad are equipped to host 3.9 guests.
Grad Stari Grad Airbnb Booking Patterns (2026): Available vs. Booked Days
Available Days Distribution
Booked Days Distribution
Booking Pattern Insights for Grad Stari Grad
- The most common availability pattern in Grad Stari Grad falls within the 271-366 days range, representing 80.1% of listings. This suggests many properties have significant open periods on their calendars.
- Approximately 98.4% of listings show high availability (181+ days open annually), indicating potential for increased bookings or specific owner usage patterns.
- For booked days, the 31-90 days range is most frequent in Grad Stari Grad (46%), reflecting common guest stay durations or potential owner blocking patterns.
- A notable 1.9% of properties secure long booking periods (181+ days booked per year), highlighting successful long-term rental strategies or significant owner usage.
Grad Stari Grad Airbnb Minimum Stay Requirements Analysis
Distribution of Listings by Minimum Night Requirement
1 Night
33 listings
10.6% of total
2 Nights
19 listings
6.1% of total
3 Nights
67 listings
21.5% of total
4-6 Nights
79 listings
25.4% of total
7-29 Nights
7 listings
2.3% of total
30+ Nights
106 listings
34.1% of total
Key Insights
- The most prevalent minimum stay requirement in Grad Stari Grad is 30+ Nights, adopted by 34.1% of listings. This highlights the market's preference for longer commitments.
- Very short stays (1-2 nights) are less common (16.7%), suggesting hosts prefer slightly longer bookings to optimize turnover.
- A significant segment (34.1%) caters to monthly stays (30+ nights) in Grad Stari Grad, pointing to opportunities in the extended-stay market.
Recommendations
- Align with the market by considering a 30+ Nights minimum stay, as 34.1% of Grad Stari Grad hosts use this setting.
- If feasible, allowing 1-night stays, especially midweek or during low season, could capture last-minute bookings, as only 10.6% currently do.
- Explore offering discounts for stays of 30+ nights to attract the 34.1% of the market seeking extended stays.
- Adjust minimum nights based on seasonality – potentially shorter during low season and longer during peak demand periods in Grad Stari Grad.
Grad Stari Grad Airbnb Cancellation Policy Trends Analysis (2026)
Limited
1 listings
0.3% of total
Super Strict 60 Days
9 listings
2.9% of total
Super Strict 30 Days
4 listings
1.3% of total
Flexible
32 listings
10.3% of total
Moderate
70 listings
22.5% of total
Firm
121 listings
38.9% of total
Strict
74 listings
23.8% of total
Cancellation Policy Insights for Grad Stari Grad
- The prevailing Airbnb cancellation policy trend in Grad Stari Grad is Firm, used by 38.9% of listings.
- A majority (62.7%) of hosts in Grad Stari Grad utilize Firm or Strict policies, indicating a market where hosts prioritize booking security.
Recommendations for Hosts
- Consider adopting a Firm policy to align with the 38.9% market standard in Grad Stari Grad.
- Regularly review your cancellation policy against competitors and market demand shifts in Grad Stari Grad.
Grad Stari Grad STR Booking Lead Time Analysis (2026)
Average Booking Lead Time by Month
Booking Lead Time Insights for Grad Stari Grad
- The overall average booking lead time for vacation rentals in Grad Stari Grad is 69 days.
- Guests book furthest in advance for stays during May (average 87 days), likely coinciding with peak travel demand or local events.
- The shortest booking windows occur for stays in November (average 26 days), indicating more last-minute travel plans during this time.
- Seasonally, Spring (76 days avg.) sees the longest lead times, while Winter (52 days avg.) has the shortest, reflecting typical travel planning cycles.
Recommendations for Hosts
- Use the overall average lead time (69 days) as a baseline for your pricing and availability strategy in Grad Stari Grad.
- For May stays, consider implementing length-of-stay discounts or slightly higher rates for bookings made less than 87 days out to capitalize on advance planning.
- Target marketing efforts for the Spring season well in advance (at least 76 days) to capture early planners.
- Monitor your own booking lead times against these Grad Stari Grad averages to identify opportunities for dynamic pricing adjustments.
Popular & Essential Airbnb Amenities in Grad Stari Grad (2026)
Amenity Prevalence
Amenity Insights for Grad Stari Grad
- Essential amenities in Grad Stari Grad that guests expect include: Wifi, Kitchen. Lacking these (any) could significantly impact bookings.
- Popular amenities like Air conditioning, TV, Essentials are common but not universal. Offering these can provide a competitive edge.
Recommendations for Hosts
- Ensure your listing includes all essential amenities for Grad Stari Grad: Wifi, Kitchen.
- Prioritize adding missing essentials: Wifi, Kitchen.
- Consider adding popular differentiators like Air conditioning or TV to increase appeal.
- Highlight unique or less common amenities you offer (e.g., hot tub, dedicated workspace, EV charger) in your listing description and photos.
- Regularly check competitor amenities in Grad Stari Grad to stay competitive.
Grad Stari Grad Airbnb Guest Demographics & Profile Analysis (2026)
Guest Profile Summary for Grad Stari Grad
- The typical guest profile for Airbnb in Grad Stari Grad consists of predominantly international visitors (96%), with top international origins including United States, typically belonging to the Post-2000s (Gen Z/Alpha) group (50%), primarily speaking English or French.
- Domestic travelers account for 4.2% of guests.
- Key international markets include United Kingdom (18.7%) and United States (17.3%).
- Top languages spoken are English (44.1%) followed by French (12.5%).
- A significant demographic segment is the Post-2000s (Gen Z/Alpha) group, representing 50% of guests.
Recommendations for Hosts
- Focus marketing internationally, particularly towards travelers from United States.
- Tailor amenities and listing descriptions to appeal to the dominant Post-2000s (Gen Z/Alpha) demographic (e.g., highlight fast WiFi, smart home features, local guides).
- Highlight unique local experiences or amenities relevant to the primary guest profile.
- Consider seasonal promotions aligned with peak travel times for key origin markets.
Nearby Short-Term Rental Market Comparison
How does the Grad Stari Grad Airbnb market stack up against its neighbors? Compare key performance metrics like average monthly revenue, ADR, and occupancy rates in surrounding areas to understand the broader regional STR landscape.
| Market | Active Properties | Monthly Revenue | Daily Rate | Avg. Occupancy |
|---|---|---|---|---|
| Poljica Brig | 16 | $3,948 | $523.01 | 52% |
| Grubine | 29 | $3,472 | $394.57 | 52% |
| Zemunik Gornji | 12 | $3,347 | $325.85 | 52% |
| Općina Klis | 89 | $3,316 | $360.31 | 51% |
| Srinjine | 40 | $3,213 | $369.86 | 48% |
| Strožanac Gornji | 36 | $3,151 | $379.58 | 45% |
| Gornje Sitno | 12 | $3,148 | $334.61 | 53% |
| Murvica | 30 | $3,023 | $359.79 | 45% |
| Gornja Podstrana | 41 | $2,962 | $327.55 | 53% |
| Crno | 16 | $2,891 | $442.64 | 32% |