Spiekeroog Airbnb Market Analysis 2026: Short Term Rental Data & Vacation Rental Statistics in Lower Saxony, Germany
Is Airbnb profitable in Spiekeroog in 2026? Explore comprehensive Airbnb analytics for Spiekeroog, Lower Saxony, Germany to uncover income potential. This 2026 STR market report for Spiekeroog, based on AirROI data from February 2025 to January 2026, reveals key trends in the niche market of 25 active listings.
Whether you're considering an Airbnb investment in Spiekeroog, optimizing your existing vacation rental, or exploring rental arbitrage opportunities, understanding the Spiekeroog Airbnb data is crucial. Leveraging the low regulation environment is key to maximizing your short term rental income potential. Let's dive into the specifics.
Key Spiekeroog Airbnb Performance Metrics Overview
Monthly Airbnb Revenue Variations & Income Potential in Spiekeroog (2026)
Understanding the monthly revenue variations for Airbnb listings in Spiekeroog is key to maximizing your short term rental income potential. Seasonality significantly impacts earnings. Our analysis, based on data from the past 12 months, shows that the peak revenue month for STRs in Spiekeroog is typically April, while January often presents the lowest earnings, highlighting opportunities for strategic pricing adjustments during shoulder and low seasons. Explore the typical Airbnb income in Spiekeroog across different performance tiers:
- Best-in-class properties (Top 10%) achieve $3,593+ monthly, often utilizing dynamic pricing and superior guest experiences.
- Strong performing properties (Top 25%) earn $2,359 or more, indicating effective management and desirable locations/amenities.
- Typical properties (Median) generate around $1,065 per month, representing the average market performance.
- Entry-level properties (Bottom 25%) see earnings around $421, often with potential for optimization.
Average Monthly Airbnb Earnings Trend in Spiekeroog
Spiekeroog Airbnb Occupancy Rate Trends (2026)
Maximize your bookings by understanding the Spiekeroog STR occupancy trends. Seasonal demand shifts significantly influence how often properties are booked. Typically, Aprilsees the highest demand (peak season occupancy), while January experiences the lowest (low season). Effective strategies, like adjusting minimum stays or offering promotions, can boost occupancy during slower periods. Here's how different property tiers perform in Spiekeroog:
- Best-in-class properties (Top 10%) achieve 61%+ occupancy, indicating high desirability and potentially optimized availability.
- Strong performing properties (Top 25%) maintain 37% or higher occupancy, suggesting good market fit and guest satisfaction.
- Typical properties (Median) have an occupancy rate around 19%.
- Entry-level properties (Bottom 25%) average 9% occupancy, potentially facing higher vacancy.
Average Monthly Occupancy Rate Trend in Spiekeroog
Average Daily Rate (ADR) Airbnb Trends in Spiekeroog (2026)
Effective short term rental pricing strategy in Spiekeroog involves understanding monthly ADR fluctuations. The Average Daily Rate (ADR) for Airbnb in Spiekeroog typically peaks in October and dips lowest during February. Leveraging Airbnb dynamic pricing tools or strategies based on this seasonality can significantly boost revenue. Here's a look at the typical nightly rates achieved:
- Best-in-class properties (Top 10%) command rates of $321+ per night, often due to premium features or locations.
- Strong performing properties (Top 25%) achieve nightly rates of $261 or more.
- Typical properties (Median) charge around $169 per night.
- Entry-level properties (Bottom 25%) earn around $134 per night.
Average Daily Rate (ADR) Trend by Month in Spiekeroog
Get Live Spiekeroog Market Intelligence 👇

Explore Real-time Analytics
Airbnb Seasonality Analysis & Trends in Spiekeroog (2026)
Peak Season (April, August, October)
- Revenue averages $1,953 per month
- Occupancy rates average 33.6%
- Daily rates average $203
Shoulder Season
- Revenue averages $1,583 per month
- Occupancy maintains around 25.9%
- Daily rates hold near $198
Low Season (January, February, November)
- Revenue drops to average $1,044 per month
- Occupancy decreases to average 18.2%
- Daily rates adjust to average $205
Seasonality Insights for Spiekeroog
- The Airbnb seasonality in Spiekeroog shows highly seasonal trends requiring careful strategy. While the sections above show seasonal averages, it's also insightful to look at the extremes:
- During the high season, the absolute peak month showcases Spiekeroog's highest earning potential, with monthly revenues capable of climbing to $2,034, occupancy reaching a high of 38.3%, and ADRs peaking at $234.
- Conversely, the slowest single month of the year, typically falling within the low season, marks the market's lowest point. In this month, revenue might dip to $803, occupancy could drop to 11.3%, and ADRs may adjust down to $161.
- Understanding both the seasonal averages and these monthly peaks and troughs in revenue, occupancy, and ADR is crucial for maximizing your Airbnb profit potential in Spiekeroog.
Seasonal Strategies for Maximizing Profit
- Peak Season: Maximize revenue through premium pricing and potentially longer minimum stays. Ensure high availability.
- Low Season: Offer competitive pricing, special promotions (e.g., extended stay discounts), and flexible cancellation policies. Target off-season travelers like remote workers or budget-conscious guests.
- Shoulder Seasons: Implement dynamic pricing that balances peak and low rates. Target weekend travelers or specific events. Offer slightly more flexible terms than peak season.
- Regularly analyze your own performance against these Spiekeroog seasonality benchmarks and adjust your pricing and availability strategy accordingly.
Best Areas for Airbnb Investment in Spiekeroog (2026)
Exploring the top neighborhoods for short-term rentals in Spiekeroog? This section highlights key areas, outlining why they are attractive for hosts and guests, along with notable local attractions. Consider these locations based on your target guest profile and investment strategy.
| Neighborhood / Area | Why Host Here? (Target Guests & Appeal) | Key Attractions & Landmarks |
|---|---|---|
| Spiekeroog Village | The heart of the island, featuring traditional Frisian architecture and charming streets. It attracts tourists looking for local culture, dining, and shopping, making it ideal for Airbnb hosting. | Island Museum, Spiekeroog Lighthouse, Local shops, Restaurants, Beach access |
| North Beach | Known for its picturesque sandy shores and peaceful environment. Perfect for families and beach lovers, making it a prime spot for seasonal rentals. | North Beach, Wattenmeer National Park, Beach cafes, Nature trails |
| South Beach Area | A quieter beach area that offers relaxation and stunning views. Ideal for those seeking a serene getaway but still close to amenities. | South Beach, Walking paths, Scenic dunes |
| Westerland Road | A main thoroughfare with easy access to the beach and local attractions. Great for those wanting to explore nearby islands and nature. | Cycling routes, Access to ferry services, Local eateries |
| Baker Beach | A lesser-known beach that provides privacy and a relaxing atmosphere. Appeals to guests looking for tranquility and nature. | Baker Beach, Secluded nature spots, Dune walks |
| Fishing Village | This area reflects Spiekeroog's maritime heritage and attracts visitors interested in local culture and history, making it an interesting place for stays. | Harbor, Local fishing tours, Fishermen's cottages |
| Nature Reserve | Offers unique flora and fauna, attracting nature lovers and bird watchers. Perfect for eco-tourism and those seeking a peaceful environment. | Protected nature areas, Bird watching spots, Hiking trails |
| Events Area | Hosts various cultural and seasonal events throughout the year, making it appealing for guests wanting to experience local traditions. | Cultural festivals, Local markets, Community gatherings |
Understanding Airbnb License Requirements & STR Laws in Spiekeroog (2026)
While Spiekeroog, Lower Saxony, Germany currently shows low STR regulations, specific Airbnb license requirements might still exist or change. Always verify the latest short term rental regulations and Airbnb license requirements directly with local government authorities for Spiekeroog to ensure full compliance before hosting.
(Source: AirROI data, 2026, finding no licensed listings among those analyzed)
Top Performing Airbnb Properties in Spiekeroog (2026)
Benchmark your potential! Explore examples of top-performing Airbnb properties in Spiekeroogbased on Trailing Twelve Month (TTM) revenue. Analyze their characteristics, revenue, occupancy rate, and ADR to understand what drives success in this market.
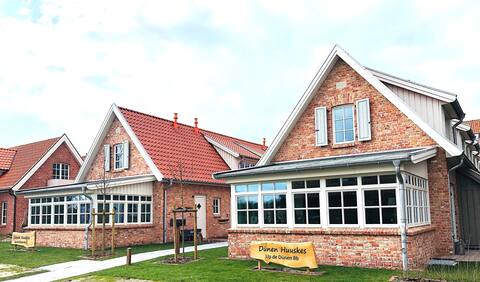
InselStill DünenHuuskes Spiekeroog
Entire Place • 2 bedrooms
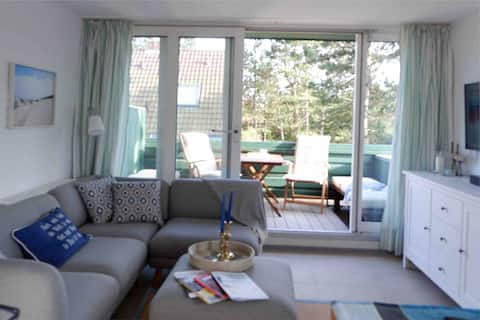
Space for the family - large apartment
Entire Place • 2 bedrooms

Little Emma
Entire Place • 1 bedroom

MoreLeev DünenHuuskes Spiekeroog
Entire Place • 2 bedrooms

MoreLücht DünenHuuskes Spiekeroog
Entire Place • 2 bedrooms
Haus Bi d´ Utkiek 20 - Apartment East
Entire Place • 1 bedroom
Note: Performance varies based on location, size, amenities, seasonality, and management quality. Data reflects the past 12 months.
Top Performing Airbnb Hosts in Spiekeroog (2026)
Learn from the best! This table showcases top-performing Airbnb hosts in Spiekeroog based on the number of properties managed and estimated total revenue over the past year. Analyze their scale and performance metrics.
| Host Name | Properties | Grossing Revenue | Stay Reviews | Avg Rating |
|---|---|---|---|---|
| UrlaubsFreude | 6 | $121,630 | 39 | 4.95/5.0 |
| Jannes | 3 | $42,190 | 20 | 4.88/5.0 |
| Jochen | 7 | $37,742 | 7 | Not Rated |
| Christoph | 1 | $30,570 | 91 | 4.85/5.0 |
| Clara | 1 | $27,890 | 75 | 4.88/5.0 |
| Carmen | 4 | $22,440 | 20 | 4.80/5.0 |
| Sylke | 1 | $14,588 | 48 | 4.92/5.0 |
| Alice-Caroline Johanna | 1 | $14,089 | 107 | 4.44/5.0 |
| Jolanthe | 1 | $1,768 | 1 | Not Rated |
Analyzing the strategies of top hosts, such as their property selection, pricing, and guest communication, can offer valuable lessons for optimizing your own Airbnb operations in Spiekeroog.
Dive Deeper: Advanced Spiekeroog STR Market Data (2026)
Ready to unlock more insights? AirROI provides access to advanced metrics and comprehensive Airbnb data for Spiekeroog. Explore detailed analytics beyond this report to refine your investment strategy, optimize pricing, and maximize your vacation rental profits.
Explore Advanced MetricsSpiekeroog Short-Term Rental Market Composition (2026): Property & Room Types
Room Type Distribution
Property Type Distribution
Market Composition Insights for Spiekeroog
- The Spiekeroog Airbnb market composition is heavily skewed towards Entire Home/Apt listings, which make up 96% of the 25 active rentals. This indicates strong guest preference for privacy and space.
- Looking at the property type distribution in Spiekeroog, Apartment/Condo properties are the most common (68%), reflecting the local real estate landscape.
- Houses represent a significant 28% portion, catering likely to families or larger groups.
- Smaller segments like hotel/boutique (combined 4.0%) offer potential for unique stay experiences.
Spiekeroog Airbnb Room Capacity Analysis (2026): Bedroom Distribution
Distribution of Listings by Number of Bedrooms
Room Capacity Insights for Spiekeroog
- The dominant room capacity in Spiekeroog is 2 bedrooms listings, making up 56% of the market. This suggests a strong demand for properties suitable for couples or solo travelers.
- Together, 2 bedrooms and 1 bedroom properties represent 92.0% of the active Airbnb listings in Spiekeroog, indicating a high concentration in these sizes.
- Listings with 3+ bedrooms (4.0%) represent a smaller niche, potentially indicating an underserved market for larger group accommodations in Spiekeroog.
Spiekeroog Vacation Rental Guest Capacity Trends (2026)
Distribution of Listings by Guest Capacity
Guest Capacity Insights for Spiekeroog
- The most common guest capacity trend in Spiekeroog vacation rentals is listings accommodating 4 guests (36%). This suggests the primary traveler segment is likely small families or groups.
- Properties designed for 4 guests and 2 guests dominate the Spiekeroog STR market, accounting for 64.0% of listings.
- Listings for large groups (6+ guests) are relatively rare (4.0%), potentially indicating an opportunity for hosts targeting this segment in Spiekeroog.
- On average, properties in Spiekeroog are equipped to host 3.4 guests.
Spiekeroog Airbnb Booking Patterns (2026): Available vs. Booked Days
Available Days Distribution
Booked Days Distribution
Booking Pattern Insights for Spiekeroog
- The most common availability pattern in Spiekeroog falls within the 271-366 days range, representing 72% of listings. This suggests many properties have significant open periods on their calendars.
- Approximately 96.0% of listings show high availability (181+ days open annually), indicating potential for increased bookings or specific owner usage patterns.
- For booked days, the 31-90 days range is most frequent in Spiekeroog (48%), reflecting common guest stay durations or potential owner blocking patterns.
- A notable 8.0% of properties secure long booking periods (181+ days booked per year), highlighting successful long-term rental strategies or significant owner usage.
Spiekeroog Airbnb Minimum Stay Requirements Analysis
Distribution of Listings by Minimum Night Requirement
1 Night
1 listings
4% of total
2 Nights
1 listings
4% of total
3 Nights
3 listings
12% of total
4-6 Nights
4 listings
16% of total
30+ Nights
16 listings
64% of total
Key Insights
- The most prevalent minimum stay requirement in Spiekeroog is 30+ Nights, adopted by 64% of listings. This highlights the market's preference for longer commitments.
- Very short stays (1-2 nights) are less common (8.0%), suggesting hosts prefer slightly longer bookings to optimize turnover.
- A significant segment (64%) caters to monthly stays (30+ nights) in Spiekeroog, pointing to opportunities in the extended-stay market.
Recommendations
- Align with the market by considering a 30+ Nights minimum stay, as 64% of Spiekeroog hosts use this setting.
- If feasible, allowing 1-night stays, especially midweek or during low season, could capture last-minute bookings, as only 4% currently do.
- Explore offering discounts for stays of 30+ nights to attract the 64% of the market seeking extended stays.
- Adjust minimum nights based on seasonality – potentially shorter during low season and longer during peak demand periods in Spiekeroog.
Spiekeroog Airbnb Cancellation Policy Trends Analysis (2026)
Super Strict 60 Days
9 listings
36% of total
Super Strict 30 Days
3 listings
12% of total
Flexible
4 listings
16% of total
Firm
6 listings
24% of total
Strict
3 listings
12% of total
Cancellation Policy Insights for Spiekeroog
- The prevailing Airbnb cancellation policy trend in Spiekeroog is Super Strict 60 Days, used by 36% of listings.
- There's a relatively balanced mix between guest-friendly (16.0%) and stricter (36.0%) policies, offering choices for different guest needs.
Recommendations for Hosts
- Consider adopting a Super Strict 60 Days policy to align with the 36% market standard in Spiekeroog.
- Using a Strict policy might deter some guests, as only 12% of listings use it. Evaluate if potential revenue protection outweighs possible lower booking rates.
- Regularly review your cancellation policy against competitors and market demand shifts in Spiekeroog.
Spiekeroog STR Booking Lead Time Analysis (2026)
Average Booking Lead Time by Month
Booking Lead Time Insights for Spiekeroog
- The overall average booking lead time for vacation rentals in Spiekeroog is 80 days.
- Guests book furthest in advance for stays during August (average 118 days), likely coinciding with peak travel demand or local events.
- The shortest booking windows occur for stays in February (average 44 days), indicating more last-minute travel plans during this time.
- Seasonally, Summer (99 days avg.) sees the longest lead times, while Winter (67 days avg.) has the shortest, reflecting typical travel planning cycles.
Recommendations for Hosts
- Use the overall average lead time (80 days) as a baseline for your pricing and availability strategy in Spiekeroog.
- For August stays, consider implementing length-of-stay discounts or slightly higher rates for bookings made less than 118 days out to capitalize on advance planning.
- Target marketing efforts for the Summer season well in advance (at least 99 days) to capture early planners.
- Monitor your own booking lead times against these Spiekeroog averages to identify opportunities for dynamic pricing adjustments.
Popular & Essential Airbnb Amenities in Spiekeroog (2026)
Amenity Prevalence
Amenity Insights for Spiekeroog
- Essential amenities in Spiekeroog that guests expect include: TV, Wifi, Essentials, Heating, Kitchen. Lacking these (any) could significantly impact bookings.
- Popular amenities like Refrigerator, Dishes and silverware, Coffee maker are common but not universal. Offering these can provide a competitive edge.
Recommendations for Hosts
- Ensure your listing includes all essential amenities for Spiekeroog: TV, Wifi, Essentials, Heating, Kitchen.
- Consider adding popular differentiators like Refrigerator or Dishes and silverware to increase appeal.
- Highlight unique or less common amenities you offer (e.g., hot tub, dedicated workspace, EV charger) in your listing description and photos.
- Regularly check competitor amenities in Spiekeroog to stay competitive.
Spiekeroog Airbnb Guest Demographics & Profile Analysis (2026)
Guest Profile Summary for Spiekeroog
- The typical guest profile for Airbnb in Spiekeroog consists of primarily domestic travelers (96%), often arriving from nearby Bremen, typically belonging to the Post-2000s (Gen Z/Alpha) group (50%), primarily speaking English or German.
- Domestic travelers account for 96.3% of guests.
- Key international markets include Germany (96.3%) and Austria (3.7%).
- Top languages spoken are English (41.7%) followed by German (41.7%).
- A significant demographic segment is the Post-2000s (Gen Z/Alpha) group, representing 50% of guests.
Recommendations for Hosts
- Target domestic marketing efforts towards travelers from Bremen and Hamburg.
- Tailor amenities and listing descriptions to appeal to the dominant Post-2000s (Gen Z/Alpha) demographic (e.g., highlight fast WiFi, smart home features, local guides).
- Highlight unique local experiences or amenities relevant to the primary guest profile.
- Consider seasonal promotions aligned with peak travel times for key origin markets.
Nearby Short-Term Rental Market Comparison
How does the Spiekeroog Airbnb market stack up against its neighbors? Compare key performance metrics like average monthly revenue, ADR, and occupancy rates in surrounding areas to understand the broader regional STR landscape.
| Market | Active Properties | Monthly Revenue | Daily Rate | Avg. Occupancy |
|---|---|---|---|---|
| Losser | 10 | $7,954 | $1060.34 | 27% |
| Ruinen | 13 | $3,044 | $227.08 | 48% |
| Terwolde | 11 | $3,030 | $208.36 | 59% |
| Schiermonnikoog | 21 | $2,933 | $187.83 | 57% |
| Neede | 10 | $2,882 | $410.06 | 30% |
| Lievelde | 23 | $2,862 | $271.13 | 40% |
| Wierden | 49 | $2,576 | $240.02 | 43% |
| Wierum | 13 | $2,534 | $448.14 | 39% |
| Kollumerpomp | 11 | $2,523 | $332.98 | 31% |
| Appelscha | 40 | $2,454 | $287.81 | 38% |