Springe Airbnb Market Analysis 2026: Short Term Rental Data & Vacation Rental Statistics in Lower Saxony, Germany
Is Airbnb profitable in Springe in 2026? Explore comprehensive Airbnb analytics for Springe, Lower Saxony, Germany to uncover income potential. This 2026 STR market report for Springe, based on AirROI data from February 2025 to January 2026, reveals key trends in the niche market of 51 active listings.
Whether you're considering an Airbnb investment in Springe, optimizing your existing vacation rental, or exploring rental arbitrage opportunities, understanding the Springe Airbnb data is crucial. Leveraging the low regulation environment is key to maximizing your short term rental income potential. Let's dive into the specifics.
Key Springe Airbnb Performance Metrics Overview
Monthly Airbnb Revenue Variations & Income Potential in Springe (2026)
Understanding the monthly revenue variations for Airbnb listings in Springe is key to maximizing your short term rental income potential. Seasonality significantly impacts earnings. Our analysis, based on data from the past 12 months, shows that the peak revenue month for STRs in Springe is typically November, while January often presents the lowest earnings, highlighting opportunities for strategic pricing adjustments during shoulder and low seasons. Explore the typical Airbnb income in Springe across different performance tiers:
- Best-in-class properties (Top 10%) achieve $2,056+ monthly, often utilizing dynamic pricing and superior guest experiences.
- Strong performing properties (Top 25%) earn $1,290 or more, indicating effective management and desirable locations/amenities.
- Typical properties (Median) generate around $787 per month, representing the average market performance.
- Entry-level properties (Bottom 25%) see earnings around $412, often with potential for optimization.
Average Monthly Airbnb Earnings Trend in Springe
Springe Airbnb Occupancy Rate Trends (2026)
Maximize your bookings by understanding the Springe STR occupancy trends. Seasonal demand shifts significantly influence how often properties are booked. Typically, Februarysees the highest demand (peak season occupancy), while January experiences the lowest (low season). Effective strategies, like adjusting minimum stays or offering promotions, can boost occupancy during slower periods. Here's how different property tiers perform in Springe:
- Best-in-class properties (Top 10%) achieve 84%+ occupancy, indicating high desirability and potentially optimized availability.
- Strong performing properties (Top 25%) maintain 63% or higher occupancy, suggesting good market fit and guest satisfaction.
- Typical properties (Median) have an occupancy rate around 32%.
- Entry-level properties (Bottom 25%) average 13% occupancy, potentially facing higher vacancy.
Average Monthly Occupancy Rate Trend in Springe
Average Daily Rate (ADR) Airbnb Trends in Springe (2026)
Effective short term rental pricing strategy in Springe involves understanding monthly ADR fluctuations. The Average Daily Rate (ADR) for Airbnb in Springe typically peaks in September and dips lowest during January. Leveraging Airbnb dynamic pricing tools or strategies based on this seasonality can significantly boost revenue. Here's a look at the typical nightly rates achieved:
- Best-in-class properties (Top 10%) command rates of $218+ per night, often due to premium features or locations.
- Strong performing properties (Top 25%) achieve nightly rates of $107 or more.
- Typical properties (Median) charge around $65 per night.
- Entry-level properties (Bottom 25%) earn around $51 per night.
Average Daily Rate (ADR) Trend by Month in Springe
Get Live Springe Market Intelligence 👇

Explore Real-time Analytics
Airbnb Seasonality Analysis & Trends in Springe (2026)
Peak Season (November, September, May)
- Revenue averages $1,479 per month
- Occupancy rates average 42.4%
- Daily rates average $145
Shoulder Season
- Revenue averages $960 per month
- Occupancy maintains around 38.1%
- Daily rates hold near $142
Low Season (January, February, December)
- Revenue drops to average $763 per month
- Occupancy decreases to average 41.1%
- Daily rates adjust to average $135
Seasonality Insights for Springe
- The Airbnb seasonality in Springe shows highly seasonal trends requiring careful strategy. While the sections above show seasonal averages, it's also insightful to look at the extremes:
- During the high season, the absolute peak month showcases Springe's highest earning potential, with monthly revenues capable of climbing to $1,887, occupancy reaching a high of 48.6%, and ADRs peaking at $150.
- Conversely, the slowest single month of the year, typically falling within the low season, marks the market's lowest point. In this month, revenue might dip to $682, occupancy could drop to 34.5%, and ADRs may adjust down to $132.
- Understanding both the seasonal averages and these monthly peaks and troughs in revenue, occupancy, and ADR is crucial for maximizing your Airbnb profit potential in Springe.
Seasonal Strategies for Maximizing Profit
- Peak Season: Maximize revenue through premium pricing and potentially longer minimum stays. Ensure high availability.
- Low Season: Offer competitive pricing, special promotions (e.g., extended stay discounts), and flexible cancellation policies. Target off-season travelers like remote workers or budget-conscious guests.
- Shoulder Seasons: Implement dynamic pricing that balances peak and low rates. Target weekend travelers or specific events. Offer slightly more flexible terms than peak season.
- Regularly analyze your own performance against these Springe seasonality benchmarks and adjust your pricing and availability strategy accordingly.
Best Areas for Airbnb Investment in Springe (2026)
Exploring the top neighborhoods for short-term rentals in Springe? This section highlights key areas, outlining why they are attractive for hosts and guests, along with notable local attractions. Consider these locations based on your target guest profile and investment strategy.
| Neighborhood / Area | Why Host Here? (Target Guests & Appeal) | Key Attractions & Landmarks |
|---|---|---|
| City Center Springe | The vibrant heart of Springe, close to amenities, shops, and restaurants. Ideal for guests looking to explore the local culture and enjoy convenience. | Springe Town Hall, St. Andreas Church, Local Shops and Cafes, Parks and Recreation Areas |
| Hannover Region | Located near Hannover, this area attracts business travelers and visitors attending events at the Hannover Fair. Offers easy accessibility to the city while providing a quieter stay. | Hannover Messe, Maschsee Lake, Hannover Zoo, Royal Gardens of Herrenhausen |
| Calenberg Castle area | A historic location near a picturesque castle, attractive for tourists interested in history and nature. Offers scenic views and outdoor activities. | Calenberg Castle, Nature Trails, Historical Sites, Local Farms |
| Parks and Recreation Areas | Surrounding parks provide a serene environment for guests seeking relaxation and nature. Perfect for families and nature lovers. | Springe Forest, Recreation Areas, Walking Trails |
| Nearby Hiking Trails | Springe is surrounded by beautiful hiking paths, appealing to outdoor enthusiasts and travelers looking for adventure and scenic landscapes. | Hiking Trails, Nature Reserves, Scenic Lookouts |
| Cultural Sites of Springe | Known for its cultural heritage, this area is perfect for guests interested in local traditions and history. Great for educational experiences. | Local Museums, Cultural Festivals, Historic Landmarks |
| Family-Friendly Neighborhoods | Ideal for families visiting Springe, offering amenities and activities suitable for children, making it a preferred choice for family vacations. | Children's Parks, Family Entertainment Centers, Kid-Friendly Dining Options |
| Affordable Local Areas | Springe also offers affordable options for budget travelers looking for a nice stay without overspending. Perfect for cost-conscious visitors. | Budget Restaurants, Local Markets, Community Events |
Understanding Airbnb License Requirements & STR Laws in Springe (2026)
While Springe, Lower Saxony, Germany currently shows low STR regulations, specific Airbnb license requirements might still exist or change. Always verify the latest short term rental regulations and Airbnb license requirements directly with local government authorities for Springe to ensure full compliance before hosting.
(Source: AirROI data, 2026, finding no licensed listings among those analyzed)
Top Performing Airbnb Properties in Springe (2026)
Benchmark your potential! Explore examples of top-performing Airbnb properties in Springebased on Trailing Twelve Month (TTM) revenue. Analyze their characteristics, revenue, occupancy rate, and ADR to understand what drives success in this market.
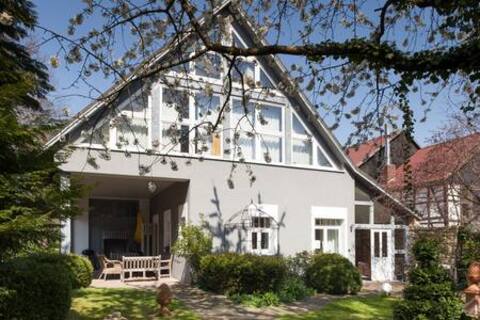
South barn 7 bedrooms with 5 bathrooms & guest toilet
Entire Place • 7 bedrooms
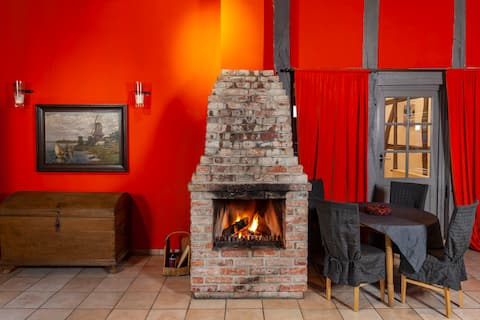
House with room for max. 32 people
Entire Place • 6 bedrooms

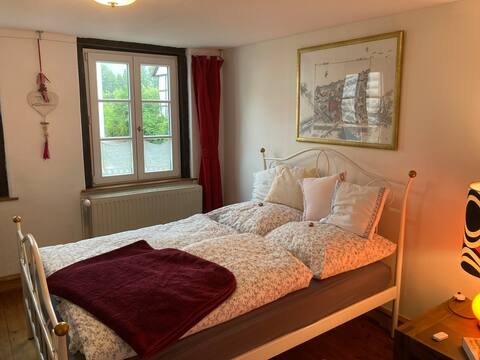
Country house with 7 bedrooms
Entire Place • 7 bedrooms
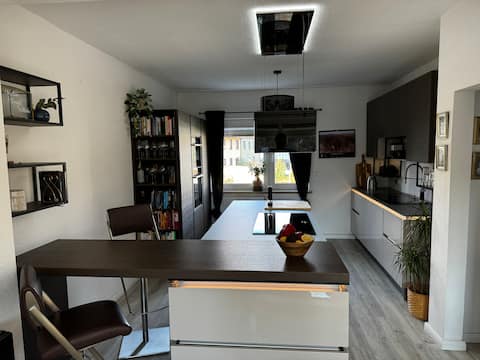
Room + private bathroom in a half-timbered house
Private Room • N/A

Deister Loft
Entire Place • 1 bedroom
Modern apartment with balcony
Entire Place • 2 bedrooms
Note: Performance varies based on location, size, amenities, seasonality, and management quality. Data reflects the past 12 months.
Top Performing Airbnb Hosts in Springe (2026)
Learn from the best! This table showcases top-performing Airbnb hosts in Springe based on the number of properties managed and estimated total revenue over the past year. Analyze their scale and performance metrics.
| Host Name | Properties | Grossing Revenue | Stay Reviews | Avg Rating |
|---|---|---|---|---|
| Nicole | 2 | $55,468 | 85 | 4.62/5.0 |
| Matthias | 3 | $42,473 | 61 | 4.40/5.0 |
| Serhiy | 2 | $24,237 | 29 | 4.96/5.0 |
| Elke | 2 | $19,265 | 66 | 5.00/5.0 |
| Nancy | 2 | $17,680 | 53 | 4.87/5.0 |
| Anna | 1 | $15,468 | 37 | 4.95/5.0 |
| Daniel | 1 | $14,767 | 7 | 5.00/5.0 |
| Eckhart | 2 | $14,339 | 16 | 4.93/5.0 |
| Klaus | 1 | $13,409 | 7 | 4.86/5.0 |
| Dagmar | 1 | $13,342 | 46 | 4.96/5.0 |
Analyzing the strategies of top hosts, such as their property selection, pricing, and guest communication, can offer valuable lessons for optimizing your own Airbnb operations in Springe.
Dive Deeper: Advanced Springe STR Market Data (2026)
Ready to unlock more insights? AirROI provides access to advanced metrics and comprehensive Airbnb data for Springe. Explore detailed analytics beyond this report to refine your investment strategy, optimize pricing, and maximize your vacation rental profits.
Explore Advanced MetricsSpringe Short-Term Rental Market Composition (2026): Property & Room Types
Room Type Distribution
Property Type Distribution
Market Composition Insights for Springe
- The Springe Airbnb market composition is heavily skewed towards Entire Home/Apt listings, which make up 64.7% of the 51 active rentals. This indicates strong guest preference for privacy and space.
- However, a notable 35.3% share for Private Rooms suggests opportunities for budget-conscious travelers or hosts renting out spare rooms.
- Looking at the property type distribution in Springe, Apartment/Condo properties are the most common (52.9%), reflecting the local real estate landscape.
- Houses represent a significant 43.1% portion, catering likely to families or larger groups.
- Smaller segments like hotel/boutique (combined 3.9%) offer potential for unique stay experiences.
Springe Airbnb Room Capacity Analysis (2026): Bedroom Distribution
Distribution of Listings by Number of Bedrooms
Room Capacity Insights for Springe
- The dominant room capacity in Springe is 1 bedroom listings, making up 45.1% of the market. This suggests a strong demand for properties suitable for couples or solo travelers.
- Together, 1 bedroom and 5+ bedrooms properties represent 54.9% of the active Airbnb listings in Springe, indicating a high concentration in these sizes.
Springe Vacation Rental Guest Capacity Trends (2026)
Distribution of Listings by Guest Capacity
Guest Capacity Insights for Springe
- The most common guest capacity trend in Springe vacation rentals is listings accommodating 2 guests (31.4%). This suggests the primary traveler segment is likely couples or solo travelers.
- Properties designed for 2 guests and 3 guests dominate the Springe STR market, accounting for 43.2% of listings.
- A significant 41.2% of listings cater specifically to 1-2 guests, highlighting strong demand from couples and solo travelers in Springe.
- 13.7% of properties accommodate 6+ guests, serving the market segment for larger families or group travel in Springe.
- On average, properties in Springe are equipped to host 2.3 guests.
Springe Airbnb Booking Patterns (2026): Available vs. Booked Days
Available Days Distribution
Booked Days Distribution
Booking Pattern Insights for Springe
- The most common availability pattern in Springe falls within the 271-366 days range, representing 60.8% of listings. This suggests many properties have significant open periods on their calendars.
- Approximately 80.4% of listings show high availability (181+ days open annually), indicating potential for increased bookings or specific owner usage patterns.
- For booked days, the 1-30 days range is most frequent in Springe (29.4%), reflecting common guest stay durations or potential owner blocking patterns.
- A notable 19.6% of properties secure long booking periods (181+ days booked per year), highlighting successful long-term rental strategies or significant owner usage.
Springe Airbnb Minimum Stay Requirements Analysis
Distribution of Listings by Minimum Night Requirement
1 Night
12 listings
23.5% of total
2 Nights
14 listings
27.5% of total
3 Nights
4 listings
7.8% of total
4-6 Nights
4 listings
7.8% of total
7-29 Nights
4 listings
7.8% of total
30+ Nights
13 listings
25.5% of total
Key Insights
- The most prevalent minimum stay requirement in Springe is 2 Nights, adopted by 27.5% of listings. This highlights the market's preference for shorter, flexible bookings.
- A significant segment (25.5%) caters to monthly stays (30+ nights) in Springe, pointing to opportunities in the extended-stay market.
Recommendations
- Align with the market by considering a 2 Nights minimum stay, as 27.5% of Springe hosts use this setting.
- If feasible, allowing 1-night stays, especially midweek or during low season, could capture last-minute bookings, as only 23.5% currently do.
- Explore offering discounts for stays of 30+ nights to attract the 25.5% of the market seeking extended stays.
- Adjust minimum nights based on seasonality – potentially shorter during low season and longer during peak demand periods in Springe.
Springe Airbnb Cancellation Policy Trends Analysis (2026)
Flexible
22 listings
43.1% of total
Moderate
14 listings
27.5% of total
Firm
7 listings
13.7% of total
Strict
8 listings
15.7% of total
Cancellation Policy Insights for Springe
- The prevailing Airbnb cancellation policy trend in Springe is Flexible, used by 43.1% of listings.
- The market strongly favors guest-friendly terms, with 70.6% of listings offering Flexible or Moderate policies. This suggests guests in Springe may expect booking flexibility.
Recommendations for Hosts
- Consider adopting a Flexible policy to align with the 43.1% market standard in Springe.
- Regularly review your cancellation policy against competitors and market demand shifts in Springe.
Springe STR Booking Lead Time Analysis (2026)
Average Booking Lead Time by Month
Booking Lead Time Insights for Springe
- The overall average booking lead time for vacation rentals in Springe is 66 days.
- Guests book furthest in advance for stays during November (average 110 days), likely coinciding with peak travel demand or local events.
- The shortest booking windows occur for stays in January (average 29 days), indicating more last-minute travel plans during this time.
- Seasonally, Fall (76 days avg.) sees the longest lead times, while Winter (35 days avg.) has the shortest, reflecting typical travel planning cycles.
Recommendations for Hosts
- Use the overall average lead time (66 days) as a baseline for your pricing and availability strategy in Springe.
- For November stays, consider implementing length-of-stay discounts or slightly higher rates for bookings made less than 110 days out to capitalize on advance planning.
- Target marketing efforts for the Fall season well in advance (at least 76 days) to capture early planners.
- Monitor your own booking lead times against these Springe averages to identify opportunities for dynamic pricing adjustments.
Popular & Essential Airbnb Amenities in Springe (2026)
Amenity Prevalence
Amenity Insights for Springe
- Essential amenities in Springe that guests expect include: Wifi. Lacking these (this) could significantly impact bookings.
- Popular amenities like Hot water, Smoke alarm, Heating are common but not universal. Offering these can provide a competitive edge.
Recommendations for Hosts
- Ensure your listing includes all essential amenities for Springe: Wifi.
- Consider adding popular differentiators like Hot water or Smoke alarm to increase appeal.
- Highlight unique or less common amenities you offer (e.g., hot tub, dedicated workspace, EV charger) in your listing description and photos.
- Regularly check competitor amenities in Springe to stay competitive.
Springe Airbnb Guest Demographics & Profile Analysis (2026)
Guest Profile Summary for Springe
- The typical guest profile for Airbnb in Springe consists of primarily domestic travelers (79%), often arriving from nearby Berlin, typically belonging to the Post-2000s (Gen Z/Alpha) group (50%), primarily speaking English or German.
- Domestic travelers account for 78.5% of guests.
- Key international markets include Germany (78.5%) and Poland (3.2%).
- Top languages spoken are English (38.4%) followed by German (35.2%).
- A significant demographic segment is the Post-2000s (Gen Z/Alpha) group, representing 50% of guests.
Recommendations for Hosts
- Target domestic marketing efforts towards travelers from Berlin and Hamburg.
- Tailor amenities and listing descriptions to appeal to the dominant Post-2000s (Gen Z/Alpha) demographic (e.g., highlight fast WiFi, smart home features, local guides).
- Highlight unique local experiences or amenities relevant to the primary guest profile.
- Consider seasonal promotions aligned with peak travel times for key origin markets.
Nearby Short-Term Rental Market Comparison
How does the Springe Airbnb market stack up against its neighbors? Compare key performance metrics like average monthly revenue, ADR, and occupancy rates in surrounding areas to understand the broader regional STR landscape.
| Market | Active Properties | Monthly Revenue | Daily Rate | Avg. Occupancy |
|---|---|---|---|---|
| Schwalefeld | 37 | $2,350 | $281.62 | 32% |
| Eslohe | 26 | $2,024 | $230.66 | 37% |
| Rietberg | 14 | $1,889 | $122.21 | 50% |
| Herzberg | 18 | $1,879 | $193.86 | 38% |
| Oberndorf | 10 | $1,872 | $186.86 | 28% |
| Stelle | 20 | $1,857 | $124.29 | 50% |
| Hamburg | 2,515 | $1,836 | $157.66 | 49% |
| Sehnde | 16 | $1,820 | $148.37 | 41% |
| Brake | 19 | $1,755 | $136.43 | 46% |
| Bad Fallingbostel | 21 | $1,746 | $178.72 | 40% |