Dassow Airbnb Market Analysis 2026: Short Term Rental Data & Vacation Rental Statistics in Mecklenburg-Vorpommern, Germany
Is Airbnb profitable in Dassow in 2026? Explore comprehensive Airbnb analytics for Dassow, Mecklenburg-Vorpommern, Germany to uncover income potential. This 2026 STR market report for Dassow, based on AirROI data from February 2025 to January 2026, reveals key trends in the niche market of 47 active listings.
Whether you're considering an Airbnb investment in Dassow, optimizing your existing vacation rental, or exploring rental arbitrage opportunities, understanding the Dassow Airbnb data is crucial. Leveraging the low regulation environment is key to maximizing your short term rental income potential. Let's dive into the specifics.
Key Dassow Airbnb Performance Metrics Overview
Monthly Airbnb Revenue Variations & Income Potential in Dassow (2026)
Understanding the monthly revenue variations for Airbnb listings in Dassow is key to maximizing your short term rental income potential. Seasonality significantly impacts earnings. Our analysis, based on data from the past 12 months, shows that the peak revenue month for STRs in Dassow is typically July, while January often presents the lowest earnings, highlighting opportunities for strategic pricing adjustments during shoulder and low seasons. Explore the typical Airbnb income in Dassow across different performance tiers:
- Best-in-class properties (Top 10%) achieve $3,698+ monthly, often utilizing dynamic pricing and superior guest experiences.
- Strong performing properties (Top 25%) earn $2,490 or more, indicating effective management and desirable locations/amenities.
- Typical properties (Median) generate around $1,611 per month, representing the average market performance.
- Entry-level properties (Bottom 25%) see earnings around $935, often with potential for optimization.
Average Monthly Airbnb Earnings Trend in Dassow
Dassow Airbnb Occupancy Rate Trends (2026)
Maximize your bookings by understanding the Dassow STR occupancy trends. Seasonal demand shifts significantly influence how often properties are booked. Typically, Julysees the highest demand (peak season occupancy), while January experiences the lowest (low season). Effective strategies, like adjusting minimum stays or offering promotions, can boost occupancy during slower periods. Here's how different property tiers perform in Dassow:
- Best-in-class properties (Top 10%) achieve 75%+ occupancy, indicating high desirability and potentially optimized availability.
- Strong performing properties (Top 25%) maintain 59% or higher occupancy, suggesting good market fit and guest satisfaction.
- Typical properties (Median) have an occupancy rate around 38%.
- Entry-level properties (Bottom 25%) average 20% occupancy, potentially facing higher vacancy.
Average Monthly Occupancy Rate Trend in Dassow
Average Daily Rate (ADR) Airbnb Trends in Dassow (2026)
Effective short term rental pricing strategy in Dassow involves understanding monthly ADR fluctuations. The Average Daily Rate (ADR) for Airbnb in Dassow typically peaks in January and dips lowest during February. Leveraging Airbnb dynamic pricing tools or strategies based on this seasonality can significantly boost revenue. Here's a look at the typical nightly rates achieved:
- Best-in-class properties (Top 10%) command rates of $336+ per night, often due to premium features or locations.
- Strong performing properties (Top 25%) achieve nightly rates of $239 or more.
- Typical properties (Median) charge around $131 per night.
- Entry-level properties (Bottom 25%) earn around $104 per night.
Average Daily Rate (ADR) Trend by Month in Dassow
Get Live Dassow Market Intelligence 👇

Explore Real-time Analytics
Airbnb Seasonality Analysis & Trends in Dassow (2026)
Peak Season (July, August, October)
- Revenue averages $3,306 per month
- Occupancy rates average 62.0%
- Daily rates average $187
Shoulder Season
- Revenue averages $1,715 per month
- Occupancy maintains around 39.4%
- Daily rates hold near $176
Low Season (January, February, November)
- Revenue drops to average $907 per month
- Occupancy decreases to average 23.0%
- Daily rates adjust to average $180
Seasonality Insights for Dassow
- The Airbnb seasonality in Dassow shows highly seasonal trends requiring careful strategy. While the sections above show seasonal averages, it's also insightful to look at the extremes:
- During the high season, the absolute peak month showcases Dassow's highest earning potential, with monthly revenues capable of climbing to $3,891, occupancy reaching a high of 70.1%, and ADRs peaking at $199.
- Conversely, the slowest single month of the year, typically falling within the low season, marks the market's lowest point. In this month, revenue might dip to $780, occupancy could drop to 14.2%, and ADRs may adjust down to $149.
- Understanding both the seasonal averages and these monthly peaks and troughs in revenue, occupancy, and ADR is crucial for maximizing your Airbnb profit potential in Dassow.
Seasonal Strategies for Maximizing Profit
- Peak Season: Maximize revenue through premium pricing and potentially longer minimum stays. Ensure high availability.
- Low Season: Offer competitive pricing, special promotions (e.g., extended stay discounts), and flexible cancellation policies. Target off-season travelers like remote workers or budget-conscious guests.
- Shoulder Seasons: Implement dynamic pricing that balances peak and low rates. Target weekend travelers or specific events. Offer slightly more flexible terms than peak season.
- Regularly analyze your own performance against these Dassow seasonality benchmarks and adjust your pricing and availability strategy accordingly.
Best Areas for Airbnb Investment in Dassow (2026)
Exploring the top neighborhoods for short-term rentals in Dassow? This section highlights key areas, outlining why they are attractive for hosts and guests, along with notable local attractions. Consider these locations based on your target guest profile and investment strategy.
| Neighborhood / Area | Why Host Here? (Target Guests & Appeal) | Key Attractions & Landmarks |
|---|---|---|
| Dassow Town Center | The heart of Dassow, featuring local shops and easy access to public transport. A great option for guests looking to explore the town and nearby attractions. | St. Mary’s Church, local markets, historical buildings |
| Lübeck Bay | Scenic coastal area offering beautiful beaches and water activities. Ideal for tourists seeking relaxation by the sea and outdoor adventures. | Beach Promenade, water sports, nature trails |
| Boltenhagen | Popular seaside resort nearby known for its long sandy beaches and family-friendly atmosphere. Attracts visitors looking for beach vacations. | Boltenhagen Beach, spa facilities, hiking trails |
| Wismar | Historic city with UNESCO World Heritage status, rich in history and architecture. A draw for tourists interested in culture and history. | Wismar Market Square, Historic Old Town, Wismar Harbor |
| Timmendorfer Strand | Trendy beach resort featuring upscale dining and shopping. Suitable for visitors looking for a luxurious seaside experience. | Timmendorfer Strand Beach, Sea Life Timmendorfer Strand, local boutiques |
| Travemünde | Picturesque district of Lübeck known for its port and beach. A great option for those interested in maritime activities and fresh seafood. | Travemünde Beach, Lighthouse, Fähranleger Travemünde |
| Mecklenburg Switzerland | Beautiful countryside with lakes and forests, perfect for nature lovers and outdoor activities. Attracts those seeking tranquility and adventure. | Lake Schalsee, hiking paths, biking trails |
| Scharbeutz | Charming coastal town known for its promenade and beach. Popular for family vacations with various leisure activities. | Scharbeutz Beach, Pier, local cafes and shops |
Understanding Airbnb License Requirements & STR Laws in Dassow (2026)
While Dassow, Mecklenburg-Vorpommern, Germany currently shows low STR regulations, specific Airbnb license requirements might still exist or change. Always verify the latest short term rental regulations and Airbnb license requirements directly with local government authorities for Dassow to ensure full compliance before hosting.
(Source: AirROI data, 2026, finding no licensed listings among those analyzed)
Top Performing Airbnb Properties in Dassow (2026)
Benchmark your potential! Explore examples of top-performing Airbnb properties in Dassowbased on Trailing Twelve Month (TTM) revenue. Analyze their characteristics, revenue, occupancy rate, and ADR to understand what drives success in this market.

Penthouse im Haus Hemingway
Entire Place • 2 bedrooms
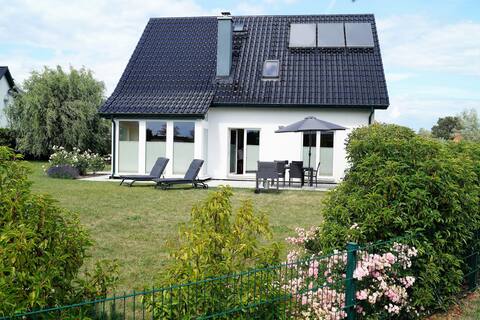
Lot of space, close to beach, modern house, quiet
Entire Place • 3 bedrooms

Wellness & Natural Beach (in 800 m), incl. Pool
Entire Place • 1 bedroom
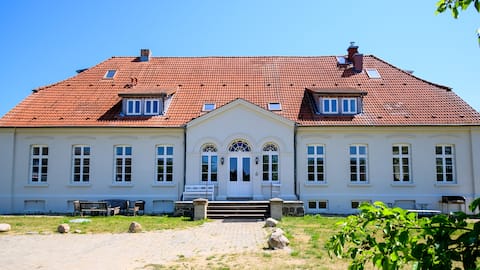
Vacation home on the first floor "Lübeck"
Entire Place • 4 bedrooms
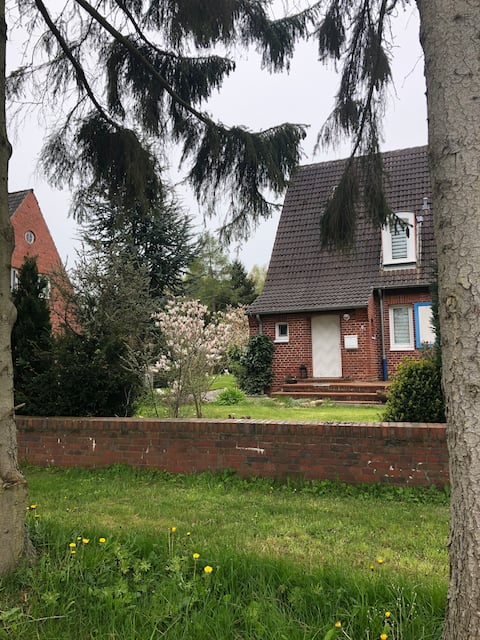
Vacation home Pötenitz, DHH
Entire Place • 3 bedrooms
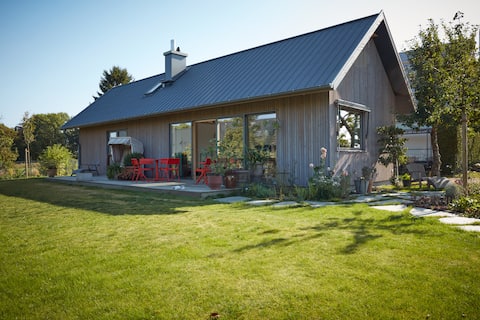
Beautiful scandi house close to the Baltic Sea
Entire Place • 2 bedrooms
Note: Performance varies based on location, size, amenities, seasonality, and management quality. Data reflects the past 12 months.
Top Performing Airbnb Hosts in Dassow (2026)
Learn from the best! This table showcases top-performing Airbnb hosts in Dassow based on the number of properties managed and estimated total revenue over the past year. Analyze their scale and performance metrics.
| Host Name | Properties | Grossing Revenue | Stay Reviews | Avg Rating |
|---|---|---|---|---|
| Bernd | 4 | $82,912 | 33 | 4.68/5.0 |
| Ingo | 3 | $77,570 | 421 | 4.91/5.0 |
| Betsy | 2 | $59,415 | 8 | 5.00/5.0 |
| Telge | 3 | $44,769 | 18 | 4.40/5.0 |
| Haike | 2 | $40,811 | 87 | 4.84/5.0 |
| Victoria | 2 | $38,077 | 31 | 4.92/5.0 |
| Maik | 1 | $33,008 | 37 | 4.92/5.0 |
| Alexandra & Oliver | 1 | $31,239 | 88 | 4.85/5.0 |
| Gisela | 1 | $29,179 | 36 | 4.92/5.0 |
| Simone | 1 | $28,217 | 128 | 4.88/5.0 |
Analyzing the strategies of top hosts, such as their property selection, pricing, and guest communication, can offer valuable lessons for optimizing your own Airbnb operations in Dassow.
Dive Deeper: Advanced Dassow STR Market Data (2026)
Ready to unlock more insights? AirROI provides access to advanced metrics and comprehensive Airbnb data for Dassow. Explore detailed analytics beyond this report to refine your investment strategy, optimize pricing, and maximize your vacation rental profits.
Explore Advanced MetricsDassow Short-Term Rental Market Composition (2026): Property & Room Types
Room Type Distribution
Property Type Distribution
Market Composition Insights for Dassow
- The Dassow Airbnb market composition is heavily skewed towards Entire Home/Apt listings, which make up 100% of the 47 active rentals. This indicates strong guest preference for privacy and space.
- Looking at the property type distribution in Dassow, Apartment/Condo properties are the most common (68.1%), reflecting the local real estate landscape.
- Houses represent a significant 27.7% portion, catering likely to families or larger groups.
- Smaller segments like outdoor/unique (combined 4.3%) offer potential for unique stay experiences.
Dassow Airbnb Room Capacity Analysis (2026): Bedroom Distribution
Distribution of Listings by Number of Bedrooms
Room Capacity Insights for Dassow
- The dominant room capacity in Dassow is 2 bedrooms listings, making up 38.3% of the market. This suggests a strong demand for properties suitable for couples or solo travelers.
- Together, 2 bedrooms and 1 bedroom properties represent 68.1% of the active Airbnb listings in Dassow, indicating a high concentration in these sizes.
- A significant 29.7% of listings offer 3+ bedrooms, catering to larger groups and families seeking more space in Dassow.
Dassow Vacation Rental Guest Capacity Trends (2026)
Distribution of Listings by Guest Capacity
Guest Capacity Insights for Dassow
- The most common guest capacity trend in Dassow vacation rentals is listings accommodating 4 guests (42.6%). This suggests the primary traveler segment is likely small families or groups.
- Properties designed for 4 guests and 6 guests dominate the Dassow STR market, accounting for 57.5% of listings.
- 29.8% of properties accommodate 6+ guests, serving the market segment for larger families or group travel in Dassow.
- On average, properties in Dassow are equipped to host 4.7 guests.
Dassow Airbnb Booking Patterns (2026): Available vs. Booked Days
Available Days Distribution
Booked Days Distribution
Booking Pattern Insights for Dassow
- The most common availability pattern in Dassow falls within the 271-366 days range, representing 51.1% of listings. This suggests many properties have significant open periods on their calendars.
- Approximately 87.3% of listings show high availability (181+ days open annually), indicating potential for increased bookings or specific owner usage patterns.
- For booked days, the 91-180 days range is most frequent in Dassow (36.2%), reflecting common guest stay durations or potential owner blocking patterns.
- A notable 14.9% of properties secure long booking periods (181+ days booked per year), highlighting successful long-term rental strategies or significant owner usage.
Dassow Airbnb Minimum Stay Requirements Analysis
Distribution of Listings by Minimum Night Requirement
1 Night
3 listings
6.4% of total
2 Nights
6 listings
12.8% of total
3 Nights
7 listings
14.9% of total
4-6 Nights
8 listings
17% of total
30+ Nights
23 listings
48.9% of total
Key Insights
- The most prevalent minimum stay requirement in Dassow is 30+ Nights, adopted by 48.9% of listings. This highlights the market's preference for longer commitments.
- Very short stays (1-2 nights) are less common (19.2%), suggesting hosts prefer slightly longer bookings to optimize turnover.
- A significant segment (48.9%) caters to monthly stays (30+ nights) in Dassow, pointing to opportunities in the extended-stay market.
Recommendations
- Align with the market by considering a 30+ Nights minimum stay, as 48.9% of Dassow hosts use this setting.
- If feasible, allowing 1-night stays, especially midweek or during low season, could capture last-minute bookings, as only 6.4% currently do.
- Explore offering discounts for stays of 30+ nights to attract the 48.9% of the market seeking extended stays.
- Adjust minimum nights based on seasonality – potentially shorter during low season and longer during peak demand periods in Dassow.
Dassow Airbnb Cancellation Policy Trends Analysis (2026)
Super Strict 30 Days
2 listings
4.3% of total
Super Strict 60 Days
2 listings
4.3% of total
Flexible
15 listings
31.9% of total
Moderate
6 listings
12.8% of total
Firm
14 listings
29.8% of total
Strict
8 listings
17% of total
Cancellation Policy Insights for Dassow
- The prevailing Airbnb cancellation policy trend in Dassow is Flexible, used by 31.9% of listings.
- There's a relatively balanced mix between guest-friendly (44.7%) and stricter (46.8%) policies, offering choices for different guest needs.
Recommendations for Hosts
- Consider adopting a Flexible policy to align with the 31.9% market standard in Dassow.
- Regularly review your cancellation policy against competitors and market demand shifts in Dassow.
Dassow STR Booking Lead Time Analysis (2026)
Average Booking Lead Time by Month
Booking Lead Time Insights for Dassow
- The overall average booking lead time for vacation rentals in Dassow is 72 days.
- Guests book furthest in advance for stays during August (average 107 days), likely coinciding with peak travel demand or local events.
- The shortest booking windows occur for stays in March (average 25 days), indicating more last-minute travel plans during this time.
- Seasonally, Summer (92 days avg.) sees the longest lead times, while Spring (49 days avg.) has the shortest, reflecting typical travel planning cycles.
Recommendations for Hosts
- Use the overall average lead time (72 days) as a baseline for your pricing and availability strategy in Dassow.
- For August stays, consider implementing length-of-stay discounts or slightly higher rates for bookings made less than 107 days out to capitalize on advance planning.
- Target marketing efforts for the Summer season well in advance (at least 92 days) to capture early planners.
- Monitor your own booking lead times against these Dassow averages to identify opportunities for dynamic pricing adjustments.
Popular & Essential Airbnb Amenities in Dassow (2026)
Amenity Prevalence
Amenity Insights for Dassow
- Essential amenities in Dassow that guests expect include: Kitchen, Wifi. Lacking these (any) could significantly impact bookings.
- Popular amenities like Heating, Free parking on premises, Refrigerator are common but not universal. Offering these can provide a competitive edge.
Recommendations for Hosts
- Ensure your listing includes all essential amenities for Dassow: Kitchen, Wifi.
- Prioritize adding missing essentials: Wifi.
- Consider adding popular differentiators like Heating or Free parking on premises to increase appeal.
- Highlight unique or less common amenities you offer (e.g., hot tub, dedicated workspace, EV charger) in your listing description and photos.
- Regularly check competitor amenities in Dassow to stay competitive.
Dassow Airbnb Guest Demographics & Profile Analysis (2026)
Guest Profile Summary for Dassow
- The typical guest profile for Airbnb in Dassow consists of primarily domestic travelers (90%), often arriving from nearby Berlin, typically belonging to the Post-2000s (Gen Z/Alpha) group (50%), primarily speaking English or German.
- Domestic travelers account for 89.9% of guests.
- Key international markets include Germany (89.9%) and Netherlands (2.6%).
- Top languages spoken are English (40%) followed by German (39.6%).
- A significant demographic segment is the Post-2000s (Gen Z/Alpha) group, representing 50% of guests.
Recommendations for Hosts
- Target domestic marketing efforts towards travelers from Berlin and Hamburg.
- Tailor amenities and listing descriptions to appeal to the dominant Post-2000s (Gen Z/Alpha) demographic (e.g., highlight fast WiFi, smart home features, local guides).
- Highlight unique local experiences or amenities relevant to the primary guest profile.
- Consider seasonal promotions aligned with peak travel times for key origin markets.
Nearby Short-Term Rental Market Comparison
How does the Dassow Airbnb market stack up against its neighbors? Compare key performance metrics like average monthly revenue, ADR, and occupancy rates in surrounding areas to understand the broader regional STR landscape.
| Market | Active Properties | Monthly Revenue | Daily Rate | Avg. Occupancy |
|---|---|---|---|---|
| Wittenbeck | 14 | $2,937 | $224.34 | 43% |
| Bissee | 13 | $2,338 | $180.13 | 48% |
| Harmsdorf | 10 | $2,076 | $326.10 | 36% |
| Ærøskøbing | 33 | $1,996 | $177.48 | 46% |
| Oberndorf | 10 | $1,872 | $186.86 | 28% |
| Stelle | 20 | $1,857 | $124.29 | 50% |
| Hamburg | 2,515 | $1,836 | $157.66 | 49% |
| Sehnde | 16 | $1,820 | $148.37 | 41% |
| Væggerløse | 22 | $1,796 | $241.32 | 41% |
| Stapel | 12 | $1,754 | $280.19 | 28% |