Karlsburg Airbnb Market Analysis 2026: Short Term Rental Data & Vacation Rental Statistics in Mecklenburg-Vorpommern, Germany
Is Airbnb profitable in Karlsburg in 2026? Explore comprehensive Airbnb analytics for Karlsburg, Mecklenburg-Vorpommern, Germany to uncover income potential. This 2026 STR market report for Karlsburg, based on AirROI data from October 2024 to September 2025, reveals key trends in the niche market of 17 active listings.
Whether you're considering an Airbnb investment in Karlsburg, optimizing your existing vacation rental, or exploring rental arbitrage opportunities, understanding the Karlsburg Airbnb data is crucial. Leveraging the low regulation environment is key to maximizing your short term rental income potential. Let's dive into the specifics.
Key Karlsburg Airbnb Performance Metrics Overview
Monthly Airbnb Revenue Variations & Income Potential in Karlsburg (2026)
Understanding the monthly revenue variations for Airbnb listings in Karlsburg is key to maximizing your short term rental income potential. Seasonality significantly impacts earnings. Our analysis, based on data from the past 12 months, shows that the peak revenue month for STRs in Karlsburg is typically August, while January often presents the lowest earnings, highlighting opportunities for strategic pricing adjustments during shoulder and low seasons. Explore the typical Airbnb income in Karlsburg across different performance tiers:
- Best-in-class properties (Top 10%) achieve $4,379+ monthly, often utilizing dynamic pricing and superior guest experiences.
- Strong performing properties (Top 25%) earn $2,002 or more, indicating effective management and desirable locations/amenities.
- Typical properties (Median) generate around $903 per month, representing the average market performance.
- Entry-level properties (Bottom 25%) see earnings around $530, often with potential for optimization.
Average Monthly Airbnb Earnings Trend in Karlsburg
Karlsburg Airbnb Occupancy Rate Trends (2026)
Maximize your bookings by understanding the Karlsburg STR occupancy trends. Seasonal demand shifts significantly influence how often properties are booked. Typically, Marchsees the highest demand (peak season occupancy), while January experiences the lowest (low season). Effective strategies, like adjusting minimum stays or offering promotions, can boost occupancy during slower periods. Here's how different property tiers perform in Karlsburg:
- Best-in-class properties (Top 10%) achieve 63%+ occupancy, indicating high desirability and potentially optimized availability.
- Strong performing properties (Top 25%) maintain 47% or higher occupancy, suggesting good market fit and guest satisfaction.
- Typical properties (Median) have an occupancy rate around 28%.
- Entry-level properties (Bottom 25%) average 17% occupancy, potentially facing higher vacancy.
Average Monthly Occupancy Rate Trend in Karlsburg
Average Daily Rate (ADR) Airbnb Trends in Karlsburg (2026)
Effective short term rental pricing strategy in Karlsburg involves understanding monthly ADR fluctuations. The Average Daily Rate (ADR) for Airbnb in Karlsburg typically peaks in September and dips lowest during April. Leveraging Airbnb dynamic pricing tools or strategies based on this seasonality can significantly boost revenue. Here's a look at the typical nightly rates achieved:
- Best-in-class properties (Top 10%) command rates of $310+ per night, often due to premium features or locations.
- Strong performing properties (Top 25%) achieve nightly rates of $205 or more.
- Typical properties (Median) charge around $89 per night.
- Entry-level properties (Bottom 25%) earn around $74 per night.
Average Daily Rate (ADR) Trend by Month in Karlsburg
Get Live Karlsburg Market Intelligence 👇

Explore Real-time Analytics
Airbnb Seasonality Analysis & Trends in Karlsburg (2025)
Peak Season (August, March, November)
- Revenue averages $2,282 per month
- Occupancy rates average 42.8%
- Daily rates average $150
Shoulder Season
- Revenue averages $1,659 per month
- Occupancy maintains around 33.5%
- Daily rates hold near $148
Low Season (January, June, September)
- Revenue drops to average $1,216 per month
- Occupancy decreases to average 25.1%
- Daily rates adjust to average $158
Seasonality Insights for Karlsburg
- The Airbnb seasonality in Karlsburg shows highly seasonal trends requiring careful strategy. While the sections above show seasonal averages, it's also insightful to look at the extremes:
- During the high season, the absolute peak month showcases Karlsburg's highest earning potential, with monthly revenues capable of climbing to $2,603, occupancy reaching a high of 48.4%, and ADRs peaking at $171.
- Conversely, the slowest single month of the year, typically falling within the low season, marks the market's lowest point. In this month, revenue might dip to $1,096, occupancy could drop to 17.7%, and ADRs may adjust down to $139.
- Understanding both the seasonal averages and these monthly peaks and troughs in revenue, occupancy, and ADR is crucial for maximizing your Airbnb profit potential in Karlsburg.
Seasonal Strategies for Maximizing Profit
- Peak Season: Maximize revenue through premium pricing and potentially longer minimum stays. Ensure high availability.
- Low Season: Offer competitive pricing, special promotions (e.g., extended stay discounts), and flexible cancellation policies. Target off-season travelers like remote workers or budget-conscious guests.
- Shoulder Seasons: Implement dynamic pricing that balances peak and low rates. Target weekend travelers or specific events. Offer slightly more flexible terms than peak season.
- Regularly analyze your own performance against these Karlsburg seasonality benchmarks and adjust your pricing and availability strategy accordingly.
Best Areas for Airbnb Investment in Karlsburg (2026)
Exploring the top neighborhoods for short-term rentals in Karlsburg? This section highlights key areas, outlining why they are attractive for hosts and guests, along with notable local attractions. Consider these locations based on your target guest profile and investment strategy.
| Neighborhood / Area | Why Host Here? (Target Guests & Appeal) | Key Attractions & Landmarks |
|---|---|---|
| Karlsburg Center | The heart of Karlsburg, offering a mix of historical charm and modern amenities. It's a perfect spot for tourists looking to explore local culture and history. | Karlsburg Castle, Local Markets, City Park, Museums, Historic Old Town |
| Lake District | A picturesque area near lakes ideal for nature lovers and outdoor activities. Great for guests looking for relaxation and recreation by the water. | Lake Tollensesee, Hiking Trails, Swimming Areas, Boating, Fishing Spots |
| Historic District | Known for its well-preserved historical buildings and infrastructure. A favorite among those who appreciate architecture and history. | St. Peter's Church, Historical Museum, Old Town Hall, Cultural Events, Local Festivals |
| Nature Reserve | An area dedicated to preserving natural beauty, attracting eco-tourism and those interested in wildlife and hiking. | Protected Wildlife Areas, Walking Trails, Educational Tours, Bird Watching, Photography Spots |
| Cultural Quarter | Vibrant area filled with galleries, theaters, and local performances. Ideal for artistic travelers or cultural enthusiasts. | Art Galleries, Theaters, Concert Halls, Cultural Festivals, Workshops |
| Wine Country | Famous for its vineyards and beautiful landscapes, perfect for those looking to enjoy tasting tours and local wines. | Vineyard Tours, Wine Tasting Events, Scenic Views, Local Cuisine, Culinary Events |
| Sporting Area | Home to various sports facilities and events. Great for active tourists and sports enthusiasts. | Local Sports Stadium, Parks for Recreation, Cycling Routes, Running Paths, Sporting Events |
| Family-Friendly Zone | Ideal for families with children, offering amenities and activities for all ages. Great for family vacations. | Kids Playgrounds, Family Restaurants, Amusement Parks, Zoos, Family Activities |
Understanding Airbnb License Requirements & STR Laws in Karlsburg (2026)
While Karlsburg, Mecklenburg-Vorpommern, Germany currently shows low STR regulations, specific Airbnb license requirements might still exist or change. Always verify the latest short term rental regulations and Airbnb license requirements directly with local government authorities for Karlsburg to ensure full compliance before hosting.
(Source: AirROI data, 2026, finding no licensed listings among those analyzed)
Top Performing Airbnb Properties in Karlsburg (2026)
Benchmark your potential! Explore examples of top-performing Airbnb properties in Karlsburgbased on Trailing Twelve Month (TTM) revenue. Analyze their characteristics, revenue, occupancy rate, and ADR to understand what drives success in this market.

Billiards, sauna & large terrace
Entire Place • 7 bedrooms
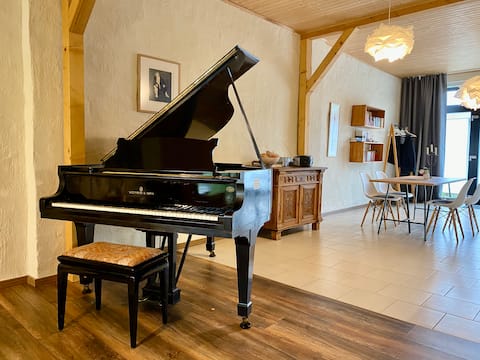
Loft with grand piano
Entire Place • N/A
Vacation home
Entire Place • 3 bedrooms

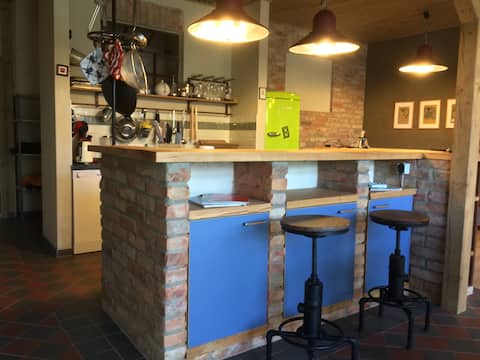
Apartment in historic barn with sauna
Entire Place • 4 bedrooms

Apartment Family Krysik - Lower Deck
Entire Place • 1 bedroom
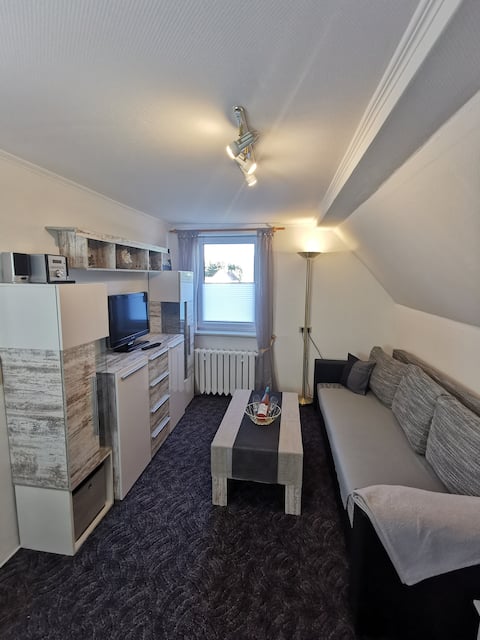
Fewos Family Krysik - Upper Deck
Entire Place • 1 bedroom
Note: Performance varies based on location, size, amenities, seasonality, and management quality. Data reflects the past 12 months.
Top Performing Airbnb Hosts in Karlsburg (2026)
Learn from the best! This table showcases top-performing Airbnb hosts in Karlsburg based on the number of properties managed and estimated total revenue over the past year. Analyze their scale and performance metrics.
| Host Name | Properties | Grossing Revenue | Stay Reviews | Avg Rating |
|---|---|---|---|---|
| Familie Strauß | 6 | $109,029 | 112 | 4.90/5.0 |
| Mathias | 5 | $42,173 | 235 | 4.95/5.0 |
| Robert | 2 | $25,066 | 23 | 4.83/5.0 |
| Charlotte | 2 | $4,701 | 2 | Not Rated |
| Astrid | 1 | $3,072 | 5 | 5.00/5.0 |
| Martina - Interhome | 1 | $2,177 | 3 | 5.00/5.0 |
Analyzing the strategies of top hosts, such as their property selection, pricing, and guest communication, can offer valuable lessons for optimizing your own Airbnb operations in Karlsburg.
Dive Deeper: Advanced Karlsburg STR Market Data (2026)
Ready to unlock more insights? AirROI provides access to advanced metrics and comprehensive Airbnb data for Karlsburg. Explore detailed analytics beyond this report to refine your investment strategy, optimize pricing, and maximize your vacation rental profits.
Explore Advanced MetricsKarlsburg Short-Term Rental Market Composition (2026): Property & Room Types
Room Type Distribution
Property Type Distribution
Market Composition Insights for Karlsburg
- The Karlsburg Airbnb market composition is heavily skewed towards Entire Home/Apt listings, which make up 88.2% of the 17 active rentals. This indicates strong guest preference for privacy and space.
- Looking at the property type distribution in Karlsburg, Apartment/Condo properties are the most common (47.1%), reflecting the local real estate landscape.
- The presence of 11.8% Hotel/Boutique listings indicates integration with traditional hospitality.
Karlsburg Airbnb Room Capacity Analysis (2026): Bedroom Distribution
Distribution of Listings by Number of Bedrooms
Room Capacity Insights for Karlsburg
- The dominant room capacity in Karlsburg is 1 bedroom listings, making up 52.9% of the market. This suggests a strong demand for properties suitable for couples or solo travelers.
- Together, 1 bedroom and 2 bedrooms properties represent 64.7% of the active Airbnb listings in Karlsburg, indicating a high concentration in these sizes.
- With over half the market (52.9%) consisting of studios or 1-bedroom units, Karlsburg is particularly well-suited for individuals or couples.
- A significant 23.6% of listings offer 3+ bedrooms, catering to larger groups and families seeking more space in Karlsburg.
Karlsburg Vacation Rental Guest Capacity Trends (2026)
Distribution of Listings by Guest Capacity
Guest Capacity Insights for Karlsburg
- The most common guest capacity trend in Karlsburg vacation rentals is listings accommodating 2 guests (35.3%). This suggests the primary traveler segment is likely couples or solo travelers.
- Properties designed for 2 guests and 8+ guests dominate the Karlsburg STR market, accounting for 52.9% of listings.
- 29.4% of properties accommodate 6+ guests, serving the market segment for larger families or group travel in Karlsburg.
- On average, properties in Karlsburg are equipped to host 4.1 guests.
Karlsburg Airbnb Booking Patterns (2026): Available vs. Booked Days
Available Days Distribution
Booked Days Distribution
Booking Pattern Insights for Karlsburg
- The most common availability pattern in Karlsburg falls within the 271-366 days range, representing 76.5% of listings. This suggests many properties have significant open periods on their calendars.
- Approximately 94.1% of listings show high availability (181+ days open annually), indicating potential for increased bookings or specific owner usage patterns.
- For booked days, the 1-30 days range is most frequent in Karlsburg (41.2%), reflecting common guest stay durations or potential owner blocking patterns.
- A notable 5.9% of properties secure long booking periods (181+ days booked per year), highlighting successful long-term rental strategies or significant owner usage.
Karlsburg Airbnb Minimum Stay Requirements Analysis
Distribution of Listings by Minimum Night Requirement
2 Nights
11 listings
64.7% of total
3 Nights
1 listings
5.9% of total
4-6 Nights
1 listings
5.9% of total
30+ Nights
4 listings
23.5% of total
Key Insights
- The most prevalent minimum stay requirement in Karlsburg is 2 Nights, adopted by 64.7% of listings. This highlights the market's preference for shorter, flexible bookings.
- A strong majority (64.7%) of the Karlsburg Airbnb data shows acceptance of very short stays (1-2 nights), indicating a dynamic, high-turnover market.
- A significant segment (23.5%) caters to monthly stays (30+ nights) in Karlsburg, pointing to opportunities in the extended-stay market.
Recommendations
- Align with the market by considering a 2 Nights minimum stay, as 64.7% of Karlsburg hosts use this setting.
- A 2-night minimum appears standard (64.7%). Consider this for weekends or peak periods.
- Explore offering discounts for stays of 30+ nights to attract the 23.5% of the market seeking extended stays.
- Adjust minimum nights based on seasonality – potentially shorter during low season and longer during peak demand periods in Karlsburg.
Karlsburg Airbnb Cancellation Policy Trends Analysis (2026)
Flexible
5 listings
29.4% of total
Moderate
5 listings
29.4% of total
Firm
3 listings
17.6% of total
Strict
4 listings
23.5% of total
Cancellation Policy Insights for Karlsburg
- The prevailing Airbnb cancellation policy trend in Karlsburg is Flexible, used by 29.4% of listings.
- There's a relatively balanced mix between guest-friendly (58.8%) and stricter (41.1%) policies, offering choices for different guest needs.
Recommendations for Hosts
- Consider adopting a Flexible policy to align with the 29.4% market standard in Karlsburg.
- Regularly review your cancellation policy against competitors and market demand shifts in Karlsburg.
Karlsburg STR Booking Lead Time Analysis (2026)
Average Booking Lead Time by Month
Booking Lead Time Insights for Karlsburg
- The overall average booking lead time for vacation rentals in Karlsburg is 57 days.
- Guests book furthest in advance for stays during August (average 79 days), likely coinciding with peak travel demand or local events.
- The shortest booking windows occur for stays in November (average 8 days), indicating more last-minute travel plans during this time.
- Seasonally, Summer (61 days avg.) sees the longest lead times, while Fall (41 days avg.) has the shortest, reflecting typical travel planning cycles.
Recommendations for Hosts
- Use the overall average lead time (57 days) as a baseline for your pricing and availability strategy in Karlsburg.
- For August stays, consider implementing length-of-stay discounts or slightly higher rates for bookings made less than 79 days out to capitalize on advance planning.
- During November, focus on last-minute booking availability and promotions, as guests book with very short notice (8 days avg.).
- Target marketing efforts for the Summer season well in advance (at least 61 days) to capture early planners.
- Monitor your own booking lead times against these Karlsburg averages to identify opportunities for dynamic pricing adjustments.
Popular & Essential Airbnb Amenities in Karlsburg (2026)
Amenity Prevalence
Amenity Insights for Karlsburg
- Popular amenities like Heating, Cooking basics, Wifi are common but not universal. Offering these can provide a competitive edge.
- Warning: Wifi is not universally provided but is considered essential globally. Ensure reliable Wifi is offered.
Recommendations for Hosts
- Consider adding popular differentiators like Heating or Cooking basics to increase appeal.
- Highlight unique or less common amenities you offer (e.g., hot tub, dedicated workspace, EV charger) in your listing description and photos.
- Regularly check competitor amenities in Karlsburg to stay competitive.
Karlsburg Airbnb Guest Demographics & Profile Analysis (2026)
Guest Profile Summary for Karlsburg
- The typical guest profile for Airbnb in Karlsburg consists of primarily domestic travelers (95%), often arriving from nearby Berlin, typically belonging to the Post-2000s (Gen Z/Alpha) group (50%), primarily speaking English or German.
- Domestic travelers account for 95.0% of guests.
- Key international markets include Germany (95%) and Peru (5%).
- Top languages spoken are English (45.8%) followed by German (45.8%).
- A significant demographic segment is the Post-2000s (Gen Z/Alpha) group, representing 50% of guests.
Recommendations for Hosts
- Target domestic marketing efforts towards travelers from Berlin and Hamburg.
- Tailor amenities and listing descriptions to appeal to the dominant Post-2000s (Gen Z/Alpha) demographic (e.g., highlight fast WiFi, smart home features, local guides).
- Highlight unique local experiences or amenities relevant to the primary guest profile.
- Consider seasonal promotions aligned with peak travel times for key origin markets.
Nearby Short-Term Rental Market Comparison
How does the Karlsburg Airbnb market stack up against its neighbors? Compare key performance metrics like average monthly revenue, ADR, and occupancy rates in surrounding areas to understand the broader regional STR landscape.
| Market | Active Properties | Monthly Revenue | Daily Rate | Avg. Occupancy |
|---|---|---|---|---|
| Gallin-Kuppentin | 13 | $2,967 | $378.01 | 30% |
| Luckow | 18 | $2,924 | $269.76 | 42% |
| Heiligengrabe | 11 | $2,769 | $230.24 | 44% |
| Groß Nemerow | 12 | $2,472 | $127.42 | 62% |
| Råbylille Strand | 32 | $2,212 | $188.43 | 42% |
| Zastań | 28 | $2,177 | $267.77 | 33% |
| Rüdersdorf bei Berlin | 13 | $2,123 | $161.14 | 41% |
| Berlin | 6,391 | $2,038 | $164.17 | 50% |
| Vogelsang-Warsin | 13 | $1,894 | $210.18 | 37% |
| Gumtow | 17 | $1,819 | $147.06 | 40% |