Kerpen Airbnb Market Analysis 2026: Short Term Rental Data & Vacation Rental Statistics in North Rhine-Westphalia, Germany
Is Airbnb profitable in Kerpen in 2026? Explore comprehensive Airbnb analytics for Kerpen, North Rhine-Westphalia, Germany to uncover income potential. This 2026 STR market report for Kerpen, based on AirROI data from February 2025 to January 2026, reveals key trends in the niche market of 45 active listings.
Whether you're considering an Airbnb investment in Kerpen, optimizing your existing vacation rental, or exploring rental arbitrage opportunities, understanding the Kerpen Airbnb data is crucial. Leveraging the low regulation environment is key to maximizing your short term rental income potential. Let's dive into the specifics.
Key Kerpen Airbnb Performance Metrics Overview
Monthly Airbnb Revenue Variations & Income Potential in Kerpen (2026)
Understanding the monthly revenue variations for Airbnb listings in Kerpen is key to maximizing your short term rental income potential. Seasonality significantly impacts earnings. Our analysis, based on data from the past 12 months, shows that the peak revenue month for STRs in Kerpen is typically October, while May often presents the lowest earnings, highlighting opportunities for strategic pricing adjustments during shoulder and low seasons. Explore the typical Airbnb income in Kerpen across different performance tiers:
- Best-in-class properties (Top 10%) achieve $2,813+ monthly, often utilizing dynamic pricing and superior guest experiences.
- Strong performing properties (Top 25%) earn $1,618 or more, indicating effective management and desirable locations/amenities.
- Typical properties (Median) generate around $1,016 per month, representing the average market performance.
- Entry-level properties (Bottom 25%) see earnings around $386, often with potential for optimization.
Average Monthly Airbnb Earnings Trend in Kerpen
Kerpen Airbnb Occupancy Rate Trends (2026)
Maximize your bookings by understanding the Kerpen STR occupancy trends. Seasonal demand shifts significantly influence how often properties are booked. Typically, Novembersees the highest demand (peak season occupancy), while May experiences the lowest (low season). Effective strategies, like adjusting minimum stays or offering promotions, can boost occupancy during slower periods. Here's how different property tiers perform in Kerpen:
- Best-in-class properties (Top 10%) achieve 82%+ occupancy, indicating high desirability and potentially optimized availability.
- Strong performing properties (Top 25%) maintain 64% or higher occupancy, suggesting good market fit and guest satisfaction.
- Typical properties (Median) have an occupancy rate around 36%.
- Entry-level properties (Bottom 25%) average 16% occupancy, potentially facing higher vacancy.
Average Monthly Occupancy Rate Trend in Kerpen
Average Daily Rate (ADR) Airbnb Trends in Kerpen (2026)
Effective short term rental pricing strategy in Kerpen involves understanding monthly ADR fluctuations. The Average Daily Rate (ADR) for Airbnb in Kerpen typically peaks in October and dips lowest during February. Leveraging Airbnb dynamic pricing tools or strategies based on this seasonality can significantly boost revenue. Here's a look at the typical nightly rates achieved:
- Best-in-class properties (Top 10%) command rates of $140+ per night, often due to premium features or locations.
- Strong performing properties (Top 25%) achieve nightly rates of $111 or more.
- Typical properties (Median) charge around $74 per night.
- Entry-level properties (Bottom 25%) earn around $53 per night.
Average Daily Rate (ADR) Trend by Month in Kerpen
Get Live Kerpen Market Intelligence 👇

Explore Real-time Analytics
Airbnb Seasonality Analysis & Trends in Kerpen (2026)
Peak Season (October, November, August)
- Revenue averages $1,504 per month
- Occupancy rates average 46.0%
- Daily rates average $90
Shoulder Season
- Revenue averages $1,206 per month
- Occupancy maintains around 40.2%
- Daily rates hold near $85
Low Season (April, May, June)
- Revenue drops to average $1,050 per month
- Occupancy decreases to average 37.7%
- Daily rates adjust to average $81
Seasonality Insights for Kerpen
- The Airbnb seasonality in Kerpen shows moderate seasonality with distinct peak and low periods. While the sections above show seasonal averages, it's also insightful to look at the extremes:
- During the high season, the absolute peak month showcases Kerpen's highest earning potential, with monthly revenues capable of climbing to $1,627, occupancy reaching a high of 49.0%, and ADRs peaking at $93.
- Conversely, the slowest single month of the year, typically falling within the low season, marks the market's lowest point. In this month, revenue might dip to $1,002, occupancy could drop to 33.4%, and ADRs may adjust down to $76.
- Understanding both the seasonal averages and these monthly peaks and troughs in revenue, occupancy, and ADR is crucial for maximizing your Airbnb profit potential in Kerpen.
Seasonal Strategies for Maximizing Profit
- Peak Season: Maximize revenue through premium pricing and potentially longer minimum stays. Ensure high availability.
- Low Season: Offer competitive pricing, special promotions (e.g., extended stay discounts), and flexible cancellation policies. Target off-season travelers like remote workers or budget-conscious guests.
- Shoulder Seasons: Implement dynamic pricing that balances peak and low rates. Target weekend travelers or specific events. Offer slightly more flexible terms than peak season.
- Regularly analyze your own performance against these Kerpen seasonality benchmarks and adjust your pricing and availability strategy accordingly.
Best Areas for Airbnb Investment in Kerpen (2026)
Exploring the top neighborhoods for short-term rentals in Kerpen? This section highlights key areas, outlining why they are attractive for hosts and guests, along with notable local attractions. Consider these locations based on your target guest profile and investment strategy.
| Neighborhood / Area | Why Host Here? (Target Guests & Appeal) | Key Attractions & Landmarks |
|---|---|---|
| Kerpen City Center | The vibrant heart of Kerpen with a mix of shopping, dining, and cultural attractions. Ideal for tourists looking to explore local life and amenities. | St. Martin's Church, Kerpen Castle, Shopping Street, Cafes and Restaurants, Local Parks |
| Brüggen | A charming area known for its historic buildings and scenic views. Appeals to tourists seeking a peaceful countryside experience close to nature. | Nature Park Rheinland, Rondell von Brüggen, Local Vineyards, Cycling Trails, Brüggen Castle |
| Horrem | A suburban area with good transport links to Cologne. Attractive for business travelers and families looking for comfortable stays near the city. | Horrem Train Station, Local Shopping Centers, Family Parks, Cafes and Bakery Shops, Sports Facilities |
| Sindorf | A quiet residential area ideal for families and longer stays. Close to amenities and green spaces, making it perfect for those seeking relaxation. | Sindorf Village Square, Local Markets, Parks and Playgrounds, Community Events, Cycling Routes |
| Buir | Known for its accessibility and local charm, this area is ideal for travelers who want a mix of rural and urban experience. | Buir Nature Reserve, Local Historical Sites, Easy Access to Cologne, Cycling Paths |
| Kerpen-Sindorf Industrial Park | An economic hub that attracts business travelers. Ideal for those visiting for work-related reasons, offering convenient locations. | Business Centers, Corporate Offices, Transport Facilities |
| Stammheim | A family-friendly neighborhood with a mix of leisure options. Great for those looking for a serene environment away from the hustle. | Local Parks, Community Pools, Playgrounds, Family Friendly Cafes |
| Köln-Kerpen Border | Strategic location for easy access to both Kerpen and nearby Cologne, appealing to those who want to explore both areas easily. | Transport Links to Cologne, Local Attractions, Diverse Culinary Options, Parks |
Understanding Airbnb License Requirements & STR Laws in Kerpen (2026)
While Kerpen, North Rhine-Westphalia, Germany currently shows low STR regulations, specific Airbnb license requirements might still exist or change. Always verify the latest short term rental regulations and Airbnb license requirements directly with local government authorities for Kerpen to ensure full compliance before hosting.
(Source: AirROI data, 2026, finding no licensed listings among those analyzed)
Top Performing Airbnb Properties in Kerpen (2026)
Benchmark your potential! Explore examples of top-performing Airbnb properties in Kerpenbased on Trailing Twelve Month (TTM) revenue. Analyze their characteristics, revenue, occupancy rate, and ADR to understand what drives success in this market.
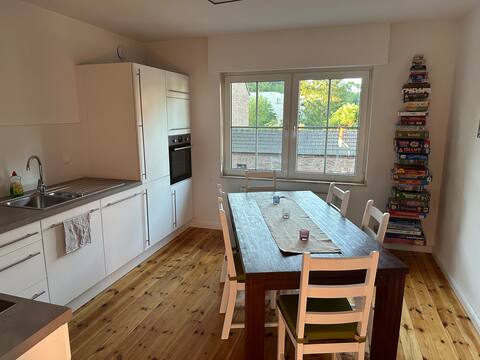
3 rooms, 2 bathrooms, 1 kitchen
Private Room • 3 bedrooms
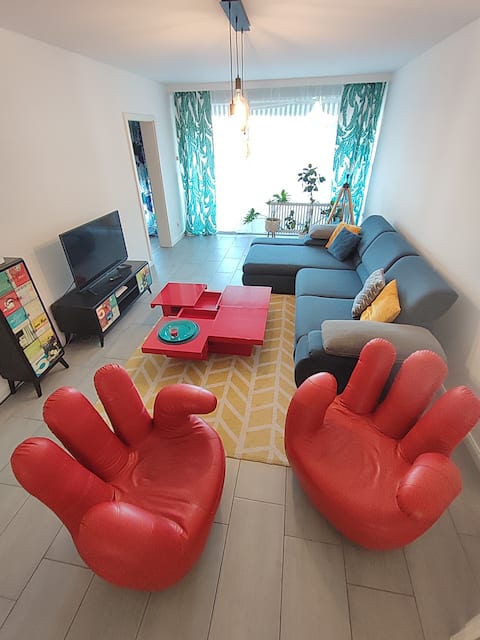
Künstler Suite: Business & Holidays for Groups
Entire Place • 3 bedrooms
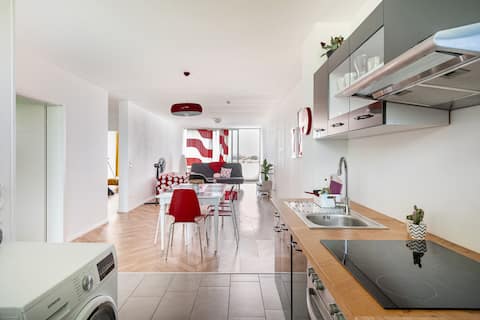
6 p. near Cologne & Phantasialand | balcony+WLAN
Entire Place • 2 bedrooms
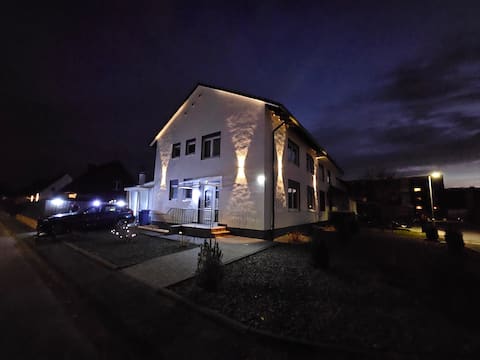
3 Room big Apartment with kitchen and Balcony
Entire Place • 2 bedrooms
Cozy three-room apartment with great connections!
Entire Place • 2 bedrooms

Beautiful, quiet apartment
Entire Place • 1 bedroom
Note: Performance varies based on location, size, amenities, seasonality, and management quality. Data reflects the past 12 months.
Top Performing Airbnb Hosts in Kerpen (2026)
Learn from the best! This table showcases top-performing Airbnb hosts in Kerpen based on the number of properties managed and estimated total revenue over the past year. Analyze their scale and performance metrics.
| Host Name | Properties | Grossing Revenue | Stay Reviews | Avg Rating |
|---|---|---|---|---|
| Judith | 2 | $73,754 | 247 | 4.92/5.0 |
| Ulf | 2 | $65,370 | 56 | 4.92/5.0 |
| Afshin | 9 | $31,490 | 236 | 4.45/5.0 |
| Tewei | 4 | $28,805 | 128 | 4.31/5.0 |
| Sandhu | 1 | $28,778 | 46 | 4.33/5.0 |
| Lena | 2 | $24,137 | 26 | 4.62/5.0 |
| Ahlam | 1 | $20,799 | 82 | 4.70/5.0 |
| Ali | 1 | $20,295 | 61 | 4.97/5.0 |
| Martina | 1 | $20,199 | 347 | 4.95/5.0 |
| Frank Und Alex | 1 | $19,067 | 42 | 5.00/5.0 |
Analyzing the strategies of top hosts, such as their property selection, pricing, and guest communication, can offer valuable lessons for optimizing your own Airbnb operations in Kerpen.
Dive Deeper: Advanced Kerpen STR Market Data (2026)
Ready to unlock more insights? AirROI provides access to advanced metrics and comprehensive Airbnb data for Kerpen. Explore detailed analytics beyond this report to refine your investment strategy, optimize pricing, and maximize your vacation rental profits.
Explore Advanced MetricsKerpen Short-Term Rental Market Composition (2026): Property & Room Types
Room Type Distribution
Property Type Distribution
Market Composition Insights for Kerpen
- The Kerpen Airbnb market composition is heavily skewed towards Entire Home/Apt listings, which make up 64.4% of the 45 active rentals. This indicates strong guest preference for privacy and space.
- However, a notable 35.6% share for Private Rooms suggests opportunities for budget-conscious travelers or hosts renting out spare rooms.
- Looking at the property type distribution in Kerpen, Apartment/Condo properties are the most common (66.7%), reflecting the local real estate landscape.
- Houses represent a significant 17.8% portion, catering likely to families or larger groups.
- The presence of 8.9% Hotel/Boutique listings indicates integration with traditional hospitality.
- Smaller segments like others, unique stays (combined 6.6%) offer potential for unique stay experiences.
Kerpen Airbnb Room Capacity Analysis (2026): Bedroom Distribution
Distribution of Listings by Number of Bedrooms
Room Capacity Insights for Kerpen
- The dominant room capacity in Kerpen is 1 bedroom listings, making up 42.2% of the market. This suggests a strong demand for properties suitable for couples or solo travelers.
- Together, 1 bedroom and 2 bedrooms properties represent 64.4% of the active Airbnb listings in Kerpen, indicating a high concentration in these sizes.
- Listings with 3+ bedrooms (4.4%) represent a smaller niche, potentially indicating an underserved market for larger group accommodations in Kerpen.
Kerpen Vacation Rental Guest Capacity Trends (2026)
Distribution of Listings by Guest Capacity
Guest Capacity Insights for Kerpen
- The most common guest capacity trend in Kerpen vacation rentals is listings accommodating 2 guests (26.7%). This suggests the primary traveler segment is likely couples or solo travelers.
- Properties designed for 2 guests and 3 guests dominate the Kerpen STR market, accounting for 42.3% of listings.
- On average, properties in Kerpen are equipped to host 2.2 guests.
Kerpen Airbnb Booking Patterns (2026): Available vs. Booked Days
Available Days Distribution
Booked Days Distribution
Booking Pattern Insights for Kerpen
- The most common availability pattern in Kerpen falls within the 271-366 days range, representing 55.6% of listings. This suggests many properties have significant open periods on their calendars.
- Approximately 84.5% of listings show high availability (181+ days open annually), indicating potential for increased bookings or specific owner usage patterns.
- For booked days, the 91-180 days range is most frequent in Kerpen (33.3%), reflecting common guest stay durations or potential owner blocking patterns.
- A notable 17.7% of properties secure long booking periods (181+ days booked per year), highlighting successful long-term rental strategies or significant owner usage.
Kerpen Airbnb Minimum Stay Requirements Analysis
Distribution of Listings by Minimum Night Requirement
1 Night
16 listings
35.6% of total
2 Nights
17 listings
37.8% of total
3 Nights
1 listings
2.2% of total
4-6 Nights
1 listings
2.2% of total
30+ Nights
10 listings
22.2% of total
Key Insights
- The most prevalent minimum stay requirement in Kerpen is 2 Nights, adopted by 37.8% of listings. This highlights the market's preference for shorter, flexible bookings.
- A strong majority (73.4%) of the Kerpen Airbnb data shows acceptance of very short stays (1-2 nights), indicating a dynamic, high-turnover market.
- A significant segment (22.2%) caters to monthly stays (30+ nights) in Kerpen, pointing to opportunities in the extended-stay market.
Recommendations
- Align with the market by considering a 2 Nights minimum stay, as 37.8% of Kerpen hosts use this setting.
- Explore offering discounts for stays of 30+ nights to attract the 22.2% of the market seeking extended stays.
- Adjust minimum nights based on seasonality – potentially shorter during low season and longer during peak demand periods in Kerpen.
Kerpen Airbnb Cancellation Policy Trends Analysis (2026)
Flexible
17 listings
37.8% of total
Moderate
9 listings
20% of total
Firm
16 listings
35.6% of total
Strict
3 listings
6.7% of total
Cancellation Policy Insights for Kerpen
- The prevailing Airbnb cancellation policy trend in Kerpen is Flexible, used by 37.8% of listings.
- There's a relatively balanced mix between guest-friendly (57.8%) and stricter (42.3%) policies, offering choices for different guest needs.
- Strict cancellation policies are quite rare (6.7%), potentially making listings with this policy less competitive unless justified by high demand or property type.
Recommendations for Hosts
- Consider adopting a Flexible policy to align with the 37.8% market standard in Kerpen.
- Using a Strict policy might deter some guests, as only 6.7% of listings use it. Evaluate if potential revenue protection outweighs possible lower booking rates.
- Regularly review your cancellation policy against competitors and market demand shifts in Kerpen.
Kerpen STR Booking Lead Time Analysis (2026)
Average Booking Lead Time by Month
Booking Lead Time Insights for Kerpen
- The overall average booking lead time for vacation rentals in Kerpen is 36 days.
- Guests book furthest in advance for stays during August (average 68 days), likely coinciding with peak travel demand or local events.
- The shortest booking windows occur for stays in November (average 23 days), indicating more last-minute travel plans during this time.
- Seasonally, Summer (41 days avg.) sees the longest lead times, while Spring (30 days avg.) has the shortest, reflecting typical travel planning cycles.
Recommendations for Hosts
- Use the overall average lead time (36 days) as a baseline for your pricing and availability strategy in Kerpen.
- For August stays, consider implementing length-of-stay discounts or slightly higher rates for bookings made less than 68 days out to capitalize on advance planning.
- Target marketing efforts for the Summer season well in advance (at least 41 days) to capture early planners.
- Monitor your own booking lead times against these Kerpen averages to identify opportunities for dynamic pricing adjustments.
Popular & Essential Airbnb Amenities in Kerpen (2026)
Amenity Prevalence
Amenity Insights for Kerpen
- Essential amenities in Kerpen that guests expect include: Wifi. Lacking these (this) could significantly impact bookings.
- Popular amenities like Kitchen, Smoke alarm, Heating are common but not universal. Offering these can provide a competitive edge.
Recommendations for Hosts
- Ensure your listing includes all essential amenities for Kerpen: Wifi.
- Prioritize adding missing essentials: Wifi.
- Consider adding popular differentiators like Kitchen or Smoke alarm to increase appeal.
- Highlight unique or less common amenities you offer (e.g., hot tub, dedicated workspace, EV charger) in your listing description and photos.
- Regularly check competitor amenities in Kerpen to stay competitive.
Kerpen Airbnb Guest Demographics & Profile Analysis (2026)
Guest Profile Summary for Kerpen
- The typical guest profile for Airbnb in Kerpen consists of a mix of domestic (47%) and international guests, with top international origins including France, typically belonging to the Post-2000s (Gen Z/Alpha) group (50%), primarily speaking English or German.
- Domestic travelers account for 46.7% of guests.
- Key international markets include Germany (46.7%) and France (19%).
- Top languages spoken are English (34.3%) followed by German (24.3%).
- A significant demographic segment is the Post-2000s (Gen Z/Alpha) group, representing 50% of guests.
Recommendations for Hosts
- Balance marketing efforts between domestic and international channels based on the guest mix.
- Tailor amenities and listing descriptions to appeal to the dominant Post-2000s (Gen Z/Alpha) demographic (e.g., highlight fast WiFi, smart home features, local guides).
- Highlight unique local experiences or amenities relevant to the primary guest profile.
- Consider seasonal promotions aligned with peak travel times for key origin markets.
Nearby Short-Term Rental Market Comparison
How does the Kerpen Airbnb market stack up against its neighbors? Compare key performance metrics like average monthly revenue, ADR, and occupancy rates in surrounding areas to understand the broader regional STR landscape.
| Market | Active Properties | Monthly Revenue | Daily Rate | Avg. Occupancy |
|---|---|---|---|---|
| Haghorst | 11 | $5,995 | $480.40 | 40% |
| Baarlo | 20 | $5,442 | $332.61 | 51% |
| Wellin | 12 | $4,365 | $446.64 | 42% |
| Aubel | 26 | $4,191 | $283.88 | 46% |
| Bertogne | 26 | $3,839 | $325.90 | 42% |
| Samrée | 18 | $3,497 | $375.75 | 31% |
| Heers | 30 | $3,405 | $294.43 | 39% |
| Chiny | 21 | $3,403 | $261.76 | 40% |
| Houffalize | 116 | $3,245 | $321.38 | 38% |
| Champlon | 11 | $3,189 | $252.57 | 41% |