Mettmann Airbnb Market Analysis 2026: Short Term Rental Data & Vacation Rental Statistics in North Rhine-Westphalia, Germany
Is Airbnb profitable in Mettmann in 2026? Explore comprehensive Airbnb analytics for Mettmann, North Rhine-Westphalia, Germany to uncover income potential. This 2026 STR market report for Mettmann, based on AirROI data from February 2025 to January 2026, reveals key trends in the niche market of 55 active listings.
Whether you're considering an Airbnb investment in Mettmann, optimizing your existing vacation rental, or exploring rental arbitrage opportunities, understanding the Mettmann Airbnb data is crucial. Leveraging the low regulation environment is key to maximizing your short term rental income potential. Let's dive into the specifics.
Key Mettmann Airbnb Performance Metrics Overview
Monthly Airbnb Revenue Variations & Income Potential in Mettmann (2026)
Understanding the monthly revenue variations for Airbnb listings in Mettmann is key to maximizing your short term rental income potential. Seasonality significantly impacts earnings. Our analysis, based on data from the past 12 months, shows that the peak revenue month for STRs in Mettmann is typically January, while February often presents the lowest earnings, highlighting opportunities for strategic pricing adjustments during shoulder and low seasons. Explore the typical Airbnb income in Mettmann across different performance tiers:
- Best-in-class properties (Top 10%) achieve $2,954+ monthly, often utilizing dynamic pricing and superior guest experiences.
- Strong performing properties (Top 25%) earn $1,750 or more, indicating effective management and desirable locations/amenities.
- Typical properties (Median) generate around $1,063 per month, representing the average market performance.
- Entry-level properties (Bottom 25%) see earnings around $556, often with potential for optimization.
Average Monthly Airbnb Earnings Trend in Mettmann
Mettmann Airbnb Occupancy Rate Trends (2026)
Maximize your bookings by understanding the Mettmann STR occupancy trends. Seasonal demand shifts significantly influence how often properties are booked. Typically, Augustsees the highest demand (peak season occupancy), while January experiences the lowest (low season). Effective strategies, like adjusting minimum stays or offering promotions, can boost occupancy during slower periods. Here's how different property tiers perform in Mettmann:
- Best-in-class properties (Top 10%) achieve 79%+ occupancy, indicating high desirability and potentially optimized availability.
- Strong performing properties (Top 25%) maintain 63% or higher occupancy, suggesting good market fit and guest satisfaction.
- Typical properties (Median) have an occupancy rate around 39%.
- Entry-level properties (Bottom 25%) average 19% occupancy, potentially facing higher vacancy.
Average Monthly Occupancy Rate Trend in Mettmann
Average Daily Rate (ADR) Airbnb Trends in Mettmann (2026)
Effective short term rental pricing strategy in Mettmann involves understanding monthly ADR fluctuations. The Average Daily Rate (ADR) for Airbnb in Mettmann typically peaks in January and dips lowest during February. Leveraging Airbnb dynamic pricing tools or strategies based on this seasonality can significantly boost revenue. Here's a look at the typical nightly rates achieved:
- Best-in-class properties (Top 10%) command rates of $270+ per night, often due to premium features or locations.
- Strong performing properties (Top 25%) achieve nightly rates of $154 or more.
- Typical properties (Median) charge around $111 per night.
- Entry-level properties (Bottom 25%) earn around $72 per night.
Average Daily Rate (ADR) Trend by Month in Mettmann
Get Live Mettmann Market Intelligence 👇

Explore Real-time Analytics
Airbnb Seasonality Analysis & Trends in Mettmann (2026)
Peak Season (January, October, November)
- Revenue averages $2,018 per month
- Occupancy rates average 42.5%
- Daily rates average $179
Shoulder Season
- Revenue averages $1,448 per month
- Occupancy maintains around 43.8%
- Daily rates hold near $135
Low Season (February, March, May)
- Revenue drops to average $1,044 per month
- Occupancy decreases to average 37.1%
- Daily rates adjust to average $113
Seasonality Insights for Mettmann
- The Airbnb seasonality in Mettmann shows highly seasonal trends requiring careful strategy. While the sections above show seasonal averages, it's also insightful to look at the extremes:
- During the high season, the absolute peak month showcases Mettmann's highest earning potential, with monthly revenues capable of climbing to $2,177, occupancy reaching a high of 49.6%, and ADRs peaking at $187.
- Conversely, the slowest single month of the year, typically falling within the low season, marks the market's lowest point. In this month, revenue might dip to $954, occupancy could drop to 32.4%, and ADRs may adjust down to $107.
- Understanding both the seasonal averages and these monthly peaks and troughs in revenue, occupancy, and ADR is crucial for maximizing your Airbnb profit potential in Mettmann.
Seasonal Strategies for Maximizing Profit
- Peak Season: Maximize revenue through premium pricing and potentially longer minimum stays. Ensure high availability.
- Low Season: Offer competitive pricing, special promotions (e.g., extended stay discounts), and flexible cancellation policies. Target off-season travelers like remote workers or budget-conscious guests.
- Shoulder Seasons: Implement dynamic pricing that balances peak and low rates. Target weekend travelers or specific events. Offer slightly more flexible terms than peak season.
- Regularly analyze your own performance against these Mettmann seasonality benchmarks and adjust your pricing and availability strategy accordingly.
Best Areas for Airbnb Investment in Mettmann (2026)
Exploring the top neighborhoods for short-term rentals in Mettmann? This section highlights key areas, outlining why they are attractive for hosts and guests, along with notable local attractions. Consider these locations based on your target guest profile and investment strategy.
| Neighborhood / Area | Why Host Here? (Target Guests & Appeal) | Key Attractions & Landmarks |
|---|---|---|
| Mettmann City Center | The vibrant heart of Mettmann with a mix of shops, cafes, and cultural sights. It attracts tourists and business travelers alike for its convenient amenities and local atmosphere. | Mettmann Museum, St. Lambertus Church, Neanderthal Museum, Kino Mettmann, Parks and plazas |
| Neanderthal Valley | A historical and natural area known for the discovery of the Neanderthal skeleton. It attracts nature enthusiasts, families, and history buffs. | Neanderthal Museum, Hiking trails, Scenic views of the valley, Local wildlife |
| Bergisch Land | A picturesque region surrounding Mettmann, popular for hiking and outdoor activities. It appeals to nature lovers and those seeking a retreat from urban life. | Schorfheide nature reserve, Hiking trails, Castle ruins, Local breweries |
| Haarhausen | A tranquil suburb with a small-town feel, ideal for families and long-term stays. Its peaceful environment draws visitors looking for relaxation. | Local parks, Community events, Historic buildings |
| Düsseldorf Proximity | Close to Düsseldorf, attracting business travelers and tourists seeking easy access to the city while enjoying a quieter stay in Mettmann. | Düsseldorf Old Town, Königsallee, Rheinuferpromenade, Cultural festivals in Düsseldorf |
| Ratingen | A neighboring town with rich history and easy transport links, making it popular among visitors who want to explore both Ratingen and Mettmann. | Ratingen Old Town, Castle Ratingen, Local markets, Parks and gardens |
| Wülfrath | Nearby town offering a blend of history and nature, attracting visitors looking to explore the wider area around Mettmann. | Historic buildings, Walking paths, Local cuisine |
| Local Restaurants and Cafés | Mettmann has a burgeoning dining scene, making it attractive for food tourism. Visitors love to experience local German cuisine. | Trattoria Mettmann, Schnitzel House, Bakery cafés, Local wine bars |
Understanding Airbnb License Requirements & STR Laws in Mettmann (2026)
While Mettmann, North Rhine-Westphalia, Germany currently shows low STR regulations, specific Airbnb license requirements might still exist or change. Always verify the latest short term rental regulations and Airbnb license requirements directly with local government authorities for Mettmann to ensure full compliance before hosting.
(Source: AirROI data, 2026, finding no licensed listings among those analyzed)
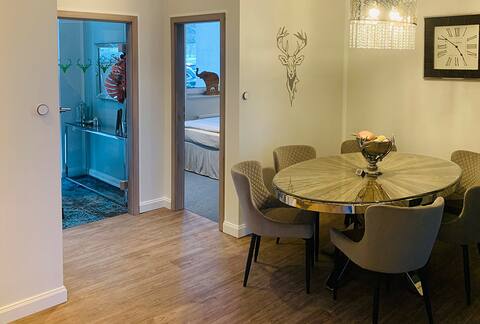
Top Performing Airbnb Properties in Mettmann (2026)
Benchmark your potential! Explore examples of top-performing Airbnb properties in Mettmannbased on Trailing Twelve Month (TTM) revenue. Analyze their characteristics, revenue, occupancy rate, and ADR to understand what drives success in this market.
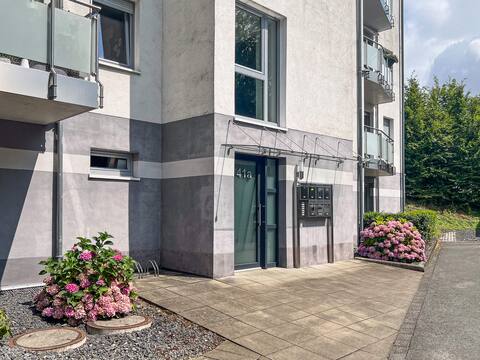
T&K Apartments - Mettmann - 5 Zimmer Maisonette
Entire Place • 4 bedrooms
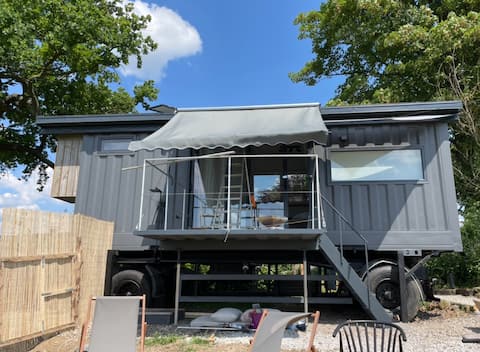
Mobile Shipping Container In Horse Farm
Entire Place • 1 bedroom
Besotel W4 modern 84 m² ground floor barrier-free parking
Entire Place • 3 bedrooms
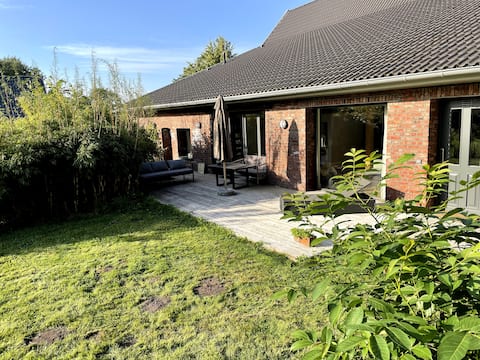
Terrace apartment with green view with 3 bedrooms
Entire Place • 3 bedrooms
Cozy style oasis Neanderthal
Entire Place • 2 bedrooms

Lovely apartment with hot tub
Entire Place • 1 bedroom
Note: Performance varies based on location, size, amenities, seasonality, and management quality. Data reflects the past 12 months.
Top Performing Airbnb Hosts in Mettmann (2026)
Learn from the best! This table showcases top-performing Airbnb hosts in Mettmann based on the number of properties managed and estimated total revenue over the past year. Analyze their scale and performance metrics.
| Host Name | Properties | Grossing Revenue | Stay Reviews | Avg Rating |
|---|---|---|---|---|
| Ivan | 1 | $100,135 | 19 | 4.68/5.0 |
| Team BESOTEL | 11 | $81,823 | 180 | 4.78/5.0 |
| Patrick | 5 | $51,798 | 13 | 4.22/5.0 |
| Andrea Walburga | 2 | $48,459 | 66 | 4.95/5.0 |
| Robert | 1 | $39,160 | 156 | 4.98/5.0 |
| Esther | 1 | $29,844 | 15 | 5.00/5.0 |
| Christian | 1 | $28,628 | 83 | 4.89/5.0 |
| David Christopher | 2 | $22,709 | 4 | 3.67/5.0 |
| Sabine & Bastien | 1 | $20,456 | 195 | 4.98/5.0 |
| Manuela | 1 | $16,665 | 8 | 5.00/5.0 |
Analyzing the strategies of top hosts, such as their property selection, pricing, and guest communication, can offer valuable lessons for optimizing your own Airbnb operations in Mettmann.
Dive Deeper: Advanced Mettmann STR Market Data (2026)
Ready to unlock more insights? AirROI provides access to advanced metrics and comprehensive Airbnb data for Mettmann. Explore detailed analytics beyond this report to refine your investment strategy, optimize pricing, and maximize your vacation rental profits.
Explore Advanced MetricsMettmann Short-Term Rental Market Composition (2026): Property & Room Types
Room Type Distribution
Property Type Distribution
Market Composition Insights for Mettmann
- The Mettmann Airbnb market composition is heavily skewed towards Entire Home/Apt listings, which make up 94.5% of the 55 active rentals. This indicates strong guest preference for privacy and space.
- Looking at the property type distribution in Mettmann, Apartment/Condo properties are the most common (87.3%), reflecting the local real estate landscape.
- Smaller segments like unique stays, outdoor/unique, hotel/boutique (combined 5.4%) offer potential for unique stay experiences.
Mettmann Airbnb Room Capacity Analysis (2026): Bedroom Distribution
Distribution of Listings by Number of Bedrooms
Room Capacity Insights for Mettmann
- The dominant room capacity in Mettmann is 1 bedroom listings, making up 41.8% of the market. This suggests a strong demand for properties suitable for couples or solo travelers.
- Together, 1 bedroom and 2 bedrooms properties represent 70.9% of the active Airbnb listings in Mettmann, indicating a high concentration in these sizes.
Mettmann Vacation Rental Guest Capacity Trends (2026)
Distribution of Listings by Guest Capacity
Guest Capacity Insights for Mettmann
- The most common guest capacity trend in Mettmann vacation rentals is listings accommodating 2 guests (40%). This suggests the primary traveler segment is likely couples or solo travelers.
- Properties designed for 2 guests and 4 guests dominate the Mettmann STR market, accounting for 61.8% of listings.
- 14.5% of properties accommodate 6+ guests, serving the market segment for larger families or group travel in Mettmann.
- On average, properties in Mettmann are equipped to host 3.2 guests.
Mettmann Airbnb Booking Patterns (2026): Available vs. Booked Days
Available Days Distribution
Booked Days Distribution
Booking Pattern Insights for Mettmann
- The most common availability pattern in Mettmann falls within the 271-366 days range, representing 45.5% of listings. This suggests many properties have significant open periods on their calendars.
- Approximately 78.2% of listings show high availability (181+ days open annually), indicating potential for increased bookings or specific owner usage patterns.
- For booked days, the 91-180 days range is most frequent in Mettmann (32.7%), reflecting common guest stay durations or potential owner blocking patterns.
- A notable 21.8% of properties secure long booking periods (181+ days booked per year), highlighting successful long-term rental strategies or significant owner usage.
Mettmann Airbnb Minimum Stay Requirements Analysis
Distribution of Listings by Minimum Night Requirement
1 Night
15 listings
27.3% of total
2 Nights
16 listings
29.1% of total
3 Nights
3 listings
5.5% of total
4-6 Nights
8 listings
14.5% of total
7-29 Nights
1 listings
1.8% of total
30+ Nights
12 listings
21.8% of total
Key Insights
- The most prevalent minimum stay requirement in Mettmann is 2 Nights, adopted by 29.1% of listings. This highlights the market's preference for shorter, flexible bookings.
- A significant segment (21.8%) caters to monthly stays (30+ nights) in Mettmann, pointing to opportunities in the extended-stay market.
Recommendations
- Align with the market by considering a 2 Nights minimum stay, as 29.1% of Mettmann hosts use this setting.
- If feasible, allowing 1-night stays, especially midweek or during low season, could capture last-minute bookings, as only 27.3% currently do.
- Explore offering discounts for stays of 30+ nights to attract the 21.8% of the market seeking extended stays.
- Adjust minimum nights based on seasonality – potentially shorter during low season and longer during peak demand periods in Mettmann.
Mettmann Airbnb Cancellation Policy Trends Analysis (2026)
Super Strict 60 Days
2 listings
3.6% of total
Flexible
8 listings
14.5% of total
Moderate
27 listings
49.1% of total
Firm
16 listings
29.1% of total
Strict
2 listings
3.6% of total
Cancellation Policy Insights for Mettmann
- The prevailing Airbnb cancellation policy trend in Mettmann is Moderate, used by 49.1% of listings.
- There's a relatively balanced mix between guest-friendly (63.6%) and stricter (32.7%) policies, offering choices for different guest needs.
- Strict cancellation policies are quite rare (3.6%), potentially making listings with this policy less competitive unless justified by high demand or property type.
Recommendations for Hosts
- Consider adopting a Moderate policy to align with the 49.1% market standard in Mettmann.
- Using a Strict policy might deter some guests, as only 3.6% of listings use it. Evaluate if potential revenue protection outweighs possible lower booking rates.
- Regularly review your cancellation policy against competitors and market demand shifts in Mettmann.
Mettmann STR Booking Lead Time Analysis (2026)
Average Booking Lead Time by Month
Booking Lead Time Insights for Mettmann
- The overall average booking lead time for vacation rentals in Mettmann is 40 days.
- Guests book furthest in advance for stays during October (average 76 days), likely coinciding with peak travel demand or local events.
- The shortest booking windows occur for stays in February (average 19 days), indicating more last-minute travel plans during this time.
- Seasonally, Fall (50 days avg.) sees the longest lead times, while Winter (29 days avg.) has the shortest, reflecting typical travel planning cycles.
Recommendations for Hosts
- Use the overall average lead time (40 days) as a baseline for your pricing and availability strategy in Mettmann.
- For October stays, consider implementing length-of-stay discounts or slightly higher rates for bookings made less than 76 days out to capitalize on advance planning.
- Target marketing efforts for the Fall season well in advance (at least 50 days) to capture early planners.
- Monitor your own booking lead times against these Mettmann averages to identify opportunities for dynamic pricing adjustments.
Popular & Essential Airbnb Amenities in Mettmann (2026)
Amenity Prevalence
Amenity Insights for Mettmann
- Essential amenities in Mettmann that guests expect include: Wifi, Smoke alarm, Heating. Lacking these (any) could significantly impact bookings.
- Popular amenities like Hangers, TV, Kitchen are common but not universal. Offering these can provide a competitive edge.
Recommendations for Hosts
- Ensure your listing includes all essential amenities for Mettmann: Wifi, Smoke alarm, Heating.
- Prioritize adding missing essentials: Smoke alarm, Heating.
- Consider adding popular differentiators like Hangers or TV to increase appeal.
- Highlight unique or less common amenities you offer (e.g., hot tub, dedicated workspace, EV charger) in your listing description and photos.
- Regularly check competitor amenities in Mettmann to stay competitive.
Mettmann Airbnb Guest Demographics & Profile Analysis (2026)
Guest Profile Summary for Mettmann
- The typical guest profile for Airbnb in Mettmann consists of primarily domestic travelers (70%), often arriving from nearby Cologne, typically belonging to the Post-2000s (Gen Z/Alpha) group (50%), primarily speaking English or German.
- Domestic travelers account for 69.5% of guests.
- Key international markets include Germany (69.5%) and Netherlands (5.7%).
- Top languages spoken are English (38.7%) followed by German (31.2%).
- A significant demographic segment is the Post-2000s (Gen Z/Alpha) group, representing 50% of guests.
Recommendations for Hosts
- Target domestic marketing efforts towards travelers from Cologne and Düsseldorf.
- Tailor amenities and listing descriptions to appeal to the dominant Post-2000s (Gen Z/Alpha) demographic (e.g., highlight fast WiFi, smart home features, local guides).
- Highlight unique local experiences or amenities relevant to the primary guest profile.
- Consider seasonal promotions aligned with peak travel times for key origin markets.
Nearby Short-Term Rental Market Comparison
How does the Mettmann Airbnb market stack up against its neighbors? Compare key performance metrics like average monthly revenue, ADR, and occupancy rates in surrounding areas to understand the broader regional STR landscape.
| Market | Active Properties | Monthly Revenue | Daily Rate | Avg. Occupancy |
|---|---|---|---|---|
| Losser | 10 | $7,954 | $1060.34 | 27% |
| Haghorst | 11 | $5,995 | $480.40 | 40% |
| Baarlo | 20 | $5,442 | $332.61 | 51% |
| Wellin | 12 | $4,365 | $446.64 | 42% |
| Aubel | 26 | $4,191 | $283.88 | 46% |
| Bertogne | 26 | $3,839 | $325.90 | 42% |
| Kortenhoef | 14 | $3,655 | $255.24 | 55% |
| Samrée | 18 | $3,497 | $375.75 | 31% |
| Zeewolde | 157 | $3,494 | $351.76 | 37% |
| Heers | 30 | $3,405 | $294.43 | 39% |