Tanne Airbnb Market Analysis 2025: Short Term Rental Data & Vacation Rental Statistics in Saxony-Anhalt, Germany
Is Airbnb profitable in Tanne in 2025? Explore comprehensive Airbnb analytics for Tanne, Saxony-Anhalt, Germany to uncover income potential. This 2025 STR market report for Tanne, based on AirROI data from June 2024 to May 2025, reveals key trends in the niche market of 18 active listings.
Whether you're considering an Airbnb investment in Tanne, optimizing your existing vacation rental, or exploring rental arbitrage opportunities, understanding the Tanne Airbnb data is crucial. Leveraging the low regulation environment is key to maximizing your short term rental income potential. Let's dive into the specifics.
Key Tanne Airbnb Performance Metrics Overview
Monthly Airbnb Revenue Variations & Income Potential in Tanne (2025)
Understanding the monthly revenue variations for Airbnb listings in Tanne is key to maximizing your short term rental income potential. Seasonality significantly impacts earnings. Our analysis, based on data from the past 12 months, shows that the peak revenue month for STRs in Tanne is typically October, while April often presents the lowest earnings, highlighting opportunities for strategic pricing adjustments during shoulder and low seasons. Explore the typical Airbnb income in Tanne across different performance tiers:
- Best-in-class properties (Top 10%) achieve $3,774+ monthly, often utilizing dynamic pricing and superior guest experiences.
- Strong performing properties (Top 25%) earn $1,472 or more, indicating effective management and desirable locations/amenities.
- Typical properties (Median) generate around $685 per month, representing the average market performance.
- Entry-level properties (Bottom 25%) see earnings around $382, often with potential for optimization.
Average Monthly Airbnb Earnings Trend in Tanne
Tanne Airbnb Occupancy Rate Trends (2025)
Maximize your bookings by understanding the Tanne STR occupancy trends. Seasonal demand shifts significantly influence how often properties are booked. Typically, Octobersees the highest demand (peak season occupancy), while November experiences the lowest (low season). Effective strategies, like adjusting minimum stays or offering promotions, can boost occupancy during slower periods. Here's how different property tiers perform in Tanne:
- Best-in-class properties (Top 10%) achieve 53%+ occupancy, indicating high desirability and potentially optimized availability.
- Strong performing properties (Top 25%) maintain 37% or higher occupancy, suggesting good market fit and guest satisfaction.
- Typical properties (Median) have an occupancy rate around 21%.
- Entry-level properties (Bottom 25%) average 13% occupancy, potentially facing higher vacancy.
Average Monthly Occupancy Rate Trend in Tanne
Average Daily Rate (ADR) Airbnb Trends in Tanne (2025)
Effective short term rental pricing strategy in Tanne involves understanding monthly ADR fluctuations. The Average Daily Rate (ADR) for Airbnb in Tanne typically peaks in June and dips lowest during December. Leveraging Airbnb dynamic pricing tools or strategies based on this seasonality can significantly boost revenue. Here's a look at the typical nightly rates achieved:
- Best-in-class properties (Top 10%) command rates of $435+ per night, often due to premium features or locations.
- Strong performing properties (Top 25%) achieve nightly rates of $207 or more.
- Typical properties (Median) charge around $110 per night.
- Entry-level properties (Bottom 25%) earn around $91 per night.
Average Daily Rate (ADR) Trend by Month in Tanne
Get Live Tanne Market Intelligence 👇

Explore Real-time Analytics
Airbnb Seasonality Analysis & Trends in Tanne (2025)
Peak Season (October, July, August)
- Revenue averages $2,523 per month
- Occupancy rates average 38.1%
- Daily rates average $186
Shoulder Season
- Revenue averages $1,551 per month
- Occupancy maintains around 27.4%
- Daily rates hold near $184
Low Season (March, April, November)
- Revenue drops to average $1,013 per month
- Occupancy decreases to average 16.8%
- Daily rates adjust to average $178
Seasonality Insights for Tanne
- The Airbnb seasonality in Tanne shows highly seasonal trends requiring careful strategy. While the sections above show seasonal averages, it's also insightful to look at the extremes:
- During the high season, the absolute peak month showcases Tanne's highest earning potential, with monthly revenues capable of climbing to $2,624, occupancy reaching a high of 48.4%, and ADRs peaking at $206.
- Conversely, the slowest single month of the year, typically falling within the low season, marks the market's lowest point. In this month, revenue might dip to $979, occupancy could drop to 14.2%, and ADRs may adjust down to $159.
- Understanding both the seasonal averages and these monthly peaks and troughs in revenue, occupancy, and ADR is crucial for maximizing your Airbnb profit potential in Tanne.
Seasonal Strategies for Maximizing Profit
- Peak Season: Maximize revenue through premium pricing and potentially longer minimum stays. Ensure high availability.
- Low Season: Offer competitive pricing, special promotions (e.g., extended stay discounts), and flexible cancellation policies. Target off-season travelers like remote workers or budget-conscious guests.
- Shoulder Seasons: Implement dynamic pricing that balances peak and low rates. Target weekend travelers or specific events. Offer slightly more flexible terms than peak season.
- Regularly analyze your own performance against these Tanne seasonality benchmarks and adjust your pricing and availability strategy accordingly.
Best Areas for Airbnb Investment in Tanne (2025)
Exploring the top neighborhoods for short-term rentals in Tanne? This section highlights key areas, outlining why they are attractive for hosts and guests, along with notable local attractions. Consider these locations based on your target guest profile and investment strategy.
| Neighborhood / Area | Why Host Here? (Target Guests & Appeal) | Key Attractions & Landmarks |
|---|---|---|
| Tanne Center | Central hub for visitors with easy access to local amenities and attractions. Ideal for tourists seeking a convenient base to explore the region. | Local parks, Cafes and restaurants, Shopping areas, Cultural centers, Public transport access |
| Tanne Nature Reserve | Beautiful natural area attracting outdoor enthusiasts and nature lovers. Perfect for those looking for a peaceful getaway among the scenic landscapes. | Hiking trails, Wildlife watching, Photography spots, Picnic areas, Natural lakes |
| Historic Old Town Tanne | Charming area with historical significance and traditional architecture. Great for travelers interested in history and culture. | Historic buildings, Local museums, Art galleries, Cultural events, Parks |
| Tanne Marketplace | Lively area known for its local markets and shops. Excellent for those wanting to experience local culture and cuisine. | Weekly farmer's market, Local artisan shops, Cafes, Food stalls, Community events |
| Tanne Sports Complex | Attractive to sports enthusiasts and families. Hosts various sporting events and activities year-round. | Sports facilities, Playgrounds, Community sports events, Walking trails, Open fields |
| Saxony-Anhalt Wine Region | Perfect for wine lovers and those wanting to explore local vineyards. A peaceful getaway with beautiful sceneries. | Local wineries, Wine tasting tours, Scenic drives, Culinary experiences, Cultural festivals |
| Tanne Art District | Emerging arts area showcasing local artists and galleries. Ideal for those interested in the arts and culture scene. | Art galleries, Workshops, Art fairs, Street art, Cafes |
| Tanne Lakeside | Serene lakeside location perfect for relaxation and leisure activities. Popular with families and those looking for a tranquil retreat. | Lake activities, Boating, Swimming areas, Picnic spots, Nature trails |
Understanding Airbnb License Requirements & STR Laws in Tanne (2025)
While Tanne, Saxony-Anhalt, Germany currently shows low STR regulations, specific Airbnb license requirements might still exist or change. Always verify the latest short term rental regulations and Airbnb license requirements directly with local government authorities for Tanne to ensure full compliance before hosting.
(Source: AirROI data, 2025, based on 6% licensed listings)
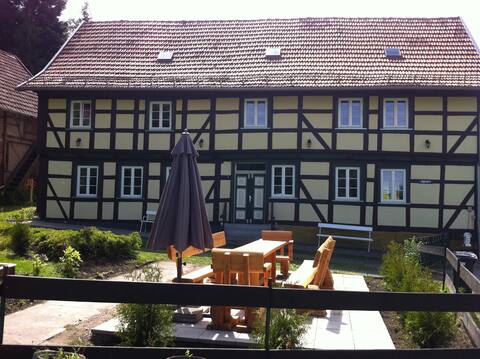
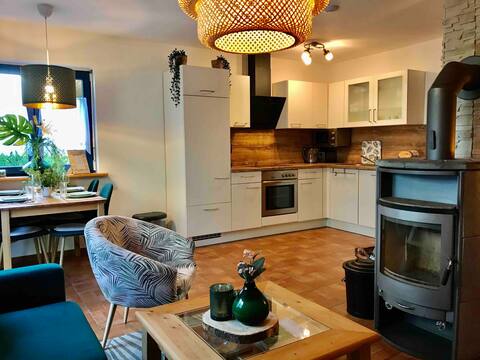
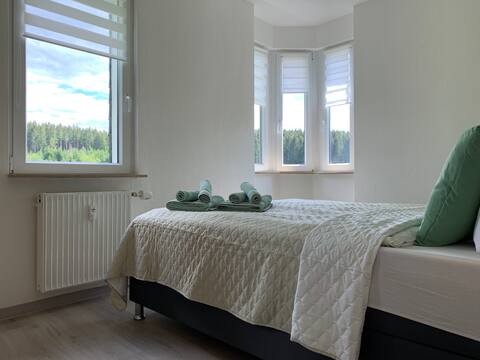
Top Performing Airbnb Properties in Tanne (2025)
Benchmark your potential! Explore examples of top-performing Airbnb properties in Tannebased on Trailing Twelve Month (TTM) revenue. Analyze their characteristics, revenue, occupancy rate, and ADR to understand what drives success in this market.

Feel-good holiday home with star comfort in Tanne
Entire Place • 5 bedrooms
Ferienhaus Oberharz am hiking trail up to 14 persons
Entire Place • 7 bedrooms

"Heart" fir (Braunlage) | Wifi | Fireplace
Entire Place • 2 bedrooms
Favorite fir tree (Braunlage) | Wi-Fi | Fireplace
Entire Place • 1 bedroom
Feel-good apartment with star comfort in Tanne
Entire Place • 2 bedrooms

Alpaka Haus Sanssouci Tanne Oberharz Kaminwohnung
Entire Place • 2 bedrooms
Note: Performance varies based on location, size, amenities, seasonality, and management quality. Data reflects the past 12 months.
Top Performing Airbnb Hosts in Tanne (2025)
Learn from the best! This table showcases top-performing Airbnb hosts in Tanne based on the number of properties managed and estimated total revenue over the past year. Analyze their scale and performance metrics.
| Host Name | Properties | Grossing Revenue | Stay Reviews | Avg Rating |
|---|---|---|---|---|
| Michael | 5 | $124,878 | 58 | 4.92/5.0 |
| Bernd | 1 | $49,119 | 4 | 4.75/5.0 |
| Maik Rohloff | 2 | $30,416 | 121 | 4.78/5.0 |
| Karolin | 3 | $20,651 | 143 | 4.92/5.0 |
| Ritesh | 2 | $9,925 | 16 | 4.51/5.0 |
| Enrico | 2 | $7,740 | 75 | 4.91/5.0 |
| Sonja | 1 | $6,957 | 9 | 4.89/5.0 |
| Host #384539543 | 1 | $4,025 | 0 | Not Rated |
| Host #478360806 | 1 | $749 | 0 | Not Rated |
Analyzing the strategies of top hosts, such as their property selection, pricing, and guest communication, can offer valuable lessons for optimizing your own Airbnb operations in Tanne.
Dive Deeper: Advanced Tanne STR Market Data (2025)
Ready to unlock more insights? AirROI provides access to advanced metrics and comprehensive Airbnb data for Tanne. Explore detailed analytics beyond this report to refine your investment strategy, optimize pricing, and maximize your vacation rental profits.
Explore Advanced MetricsTanne Short-Term Rental Market Composition (2025): Property & Room Types
Room Type Distribution
Property Type Distribution
Market Composition Insights for Tanne
- The Tanne Airbnb market composition is heavily skewed towards Entire Home/Apt listings, which make up 100% of the 18 active rentals. This indicates strong guest preference for privacy and space.
- Looking at the property type distribution in Tanne, House properties are the most common (55.6%), reflecting the local real estate landscape.
- Houses represent a significant 55.6% portion, catering likely to families or larger groups.
Tanne Airbnb Room Capacity Analysis (2025): Bedroom Distribution
Distribution of Listings by Number of Bedrooms
Room Capacity Insights for Tanne
- The dominant room capacity in Tanne is 1 bedroom listings, making up 38.9% of the market. This suggests a strong demand for properties suitable for couples or solo travelers.
- Together, 1 bedroom and 2 bedrooms properties represent 77.8% of the active Airbnb listings in Tanne, indicating a high concentration in these sizes.
- A significant 22.2% of listings offer 3+ bedrooms, catering to larger groups and families seeking more space in Tanne.
Tanne Vacation Rental Guest Capacity Trends (2025)
Distribution of Listings by Guest Capacity
Guest Capacity Insights for Tanne
- The most common guest capacity trend in Tanne vacation rentals is listings accommodating 3 guests (27.8%). This suggests the primary traveler segment is likely small families or groups.
- Properties designed for 3 guests and 8+ guests dominate the Tanne STR market, accounting for 50.0% of listings.
- 27.8% of properties accommodate 6+ guests, serving the market segment for larger families or group travel in Tanne.
- On average, properties in Tanne are equipped to host 4.8 guests.
Tanne Airbnb Booking Patterns (2025): Available vs. Booked Days
Available Days Distribution
Booked Days Distribution
Booking Pattern Insights for Tanne
- The most common availability pattern in Tanne falls within the 271-366 days range, representing 72.2% of listings. This suggests many properties have significant open periods on their calendars.
- Approximately 100.0% of listings show high availability (181+ days open annually), indicating potential for increased bookings or specific owner usage patterns.
- For booked days, the 31-90 days range is most frequent in Tanne (55.6%), reflecting common guest stay durations or potential owner blocking patterns.
Tanne Airbnb Minimum Stay Requirements Analysis
Distribution of Listings by Minimum Night Requirement
2 Nights
3 listings
16.7% of total
3 Nights
5 listings
27.8% of total
4-6 Nights
5 listings
27.8% of total
30+ Nights
5 listings
27.8% of total
Key Insights
- The most prevalent minimum stay requirement in Tanne is 3 Nights, adopted by 27.8% of listings. This highlights the market's preference for longer commitments.
- Very short stays (1-2 nights) are less common (16.7%), suggesting hosts prefer slightly longer bookings to optimize turnover.
- A significant segment (27.8%) caters to monthly stays (30+ nights) in Tanne, pointing to opportunities in the extended-stay market.
Recommendations
- Align with the market by considering a 3 Nights minimum stay, as 27.8% of Tanne hosts use this setting.
- Explore offering discounts for stays of 30+ nights to attract the 27.8% of the market seeking extended stays.
- Adjust minimum nights based on seasonality – potentially shorter during low season and longer during peak demand periods in Tanne.
Tanne Airbnb Cancellation Policy Trends Analysis (2025)
Moderate
1 listings
5.9% of total
Firm
8 listings
47.1% of total
Strict
8 listings
47.1% of total
Cancellation Policy Insights for Tanne
- The prevailing Airbnb cancellation policy trend in Tanne is Firm, used by 47.1% of listings.
- A majority (94.2%) of hosts in Tanne utilize Firm or Strict policies, indicating a market where hosts prioritize booking security.
Recommendations for Hosts
- Consider adopting a Firm policy to align with the 47.1% market standard in Tanne.
- With 47.1% using Strict terms, this is a viable option in Tanne, particularly for high-value properties or during peak demand periods.
- Regularly review your cancellation policy against competitors and market demand shifts in Tanne.
Tanne STR Booking Lead Time Analysis (2025)
Average Booking Lead Time by Month
Booking Lead Time Insights for Tanne
- The overall average booking lead time for vacation rentals in Tanne is 82 days.
- Guests book furthest in advance for stays during December (average 150 days), likely coinciding with peak travel demand or local events.
- The shortest booking windows occur for stays in July (average 33 days), indicating more last-minute travel plans during this time.
- Seasonally, Winter (99 days avg.) sees the longest lead times, while Summer (55 days avg.) has the shortest, reflecting typical travel planning cycles.
Recommendations for Hosts
- Use the overall average lead time (82 days) as a baseline for your pricing and availability strategy in Tanne.
- For December stays, consider implementing length-of-stay discounts or slightly higher rates for bookings made less than 150 days out to capitalize on advance planning.
- Target marketing efforts for the Winter season well in advance (at least 99 days) to capture early planners.
- Monitor your own booking lead times against these Tanne averages to identify opportunities for dynamic pricing adjustments.
Popular & Essential Airbnb Amenities in Tanne (2025)
Amenity Prevalence
Amenity Insights for Tanne
- Essential amenities in Tanne that guests expect include: Kitchen, TV, Heating. Lacking these (any) could significantly impact bookings.
- Popular amenities like Refrigerator, Hangers, Coffee maker are common but not universal. Offering these can provide a competitive edge.
- Warning: Wifi is not universally provided but is considered essential globally. Ensure reliable Wifi is offered.
Recommendations for Hosts
- Ensure your listing includes all essential amenities for Tanne: Kitchen, TV, Heating.
- Consider adding popular differentiators like Refrigerator or Hangers to increase appeal.
- Highlight unique or less common amenities you offer (e.g., hot tub, dedicated workspace, EV charger) in your listing description and photos.
- Regularly check competitor amenities in Tanne to stay competitive.
Tanne Airbnb Guest Demographics & Profile Analysis (2025)
Guest Profile Summary for Tanne
- The typical guest profile for Airbnb in Tanne consists of primarily domestic travelers (93%), often arriving from nearby Hamburg, typically belonging to the Post-2000s (Gen Z/Alpha) group (50%), primarily speaking German or English.
- Domestic travelers account for 93.1% of guests.
- Key international markets include Germany (93.1%) and Belgium (3.4%).
- Top languages spoken are German (47.2%) followed by English (41.7%).
- A significant demographic segment is the Post-2000s (Gen Z/Alpha) group, representing 50% of guests.
Recommendations for Hosts
- Target domestic marketing efforts towards travelers from Hamburg and Berlin.
- Tailor amenities and listing descriptions to appeal to the dominant Post-2000s (Gen Z/Alpha) demographic (e.g., highlight fast WiFi, smart home features, local guides).
- Highlight unique local experiences or amenities relevant to the primary guest profile.
- Consider seasonal promotions aligned with peak travel times for key origin markets.
Nearby Short-Term Rental Market Comparison
How does the Tanne Airbnb market stack up against its neighbors? Compare key performance metrics like average monthly revenue, ADR, and occupancy rates in surrounding areas to understand the broader regional STR landscape.
| Market | Active Properties | Monthly Revenue | Daily Rate | Avg. Occupancy |
|---|---|---|---|---|
| Meimbressen | 15 | $1,935 | $166.49 | 29% |
| Elgershausen | 11 | $1,773 | $98.53 | 51% |
| Herzberg | 18 | $1,694 | $179.03 | 41% |
| Elend | 13 | $1,666 | $288.58 | 29% |
| Uslar | 17 | $1,596 | $237.01 | 28% |
| Zella-Mehlis | 16 | $1,516 | $149.29 | 36% |
| Masserberg | 24 | $1,508 | $341.34 | 26% |
| Lüchow | 16 | $1,403 | $120.31 | 40% |
| Bad Tabarz | 10 | $1,400 | $107.34 | 48% |
| Warburg | 21 | $1,335 | $102.83 | 47% |