Norddorf auf Amrum Airbnb Market Analysis 2026: Short Term Rental Data & Vacation Rental Statistics in Schleswig-Holstein, Germany
Is Airbnb profitable in Norddorf auf Amrum in 2026? Explore comprehensive Airbnb analytics for Norddorf auf Amrum, Schleswig-Holstein, Germany to uncover income potential. This 2026 STR market report for Norddorf auf Amrum, based on AirROI data from February 2025 to January 2026, reveals key trends in the niche market of 18 active listings.
Whether you're considering an Airbnb investment in Norddorf auf Amrum, optimizing your existing vacation rental, or exploring rental arbitrage opportunities, understanding the Norddorf auf Amrum Airbnb data is crucial. Leveraging the low regulation environment is key to maximizing your short term rental income potential. Let's dive into the specifics.
Key Norddorf auf Amrum Airbnb Performance Metrics Overview
Monthly Airbnb Revenue Variations & Income Potential in Norddorf auf Amrum (2026)
Understanding the monthly revenue variations for Airbnb listings in Norddorf auf Amrum is key to maximizing your short term rental income potential. Seasonality significantly impacts earnings. Our analysis, based on data from the past 12 months, shows that the peak revenue month for STRs in Norddorf auf Amrum is typically July, while January often presents the lowest earnings, highlighting opportunities for strategic pricing adjustments during shoulder and low seasons. Explore the typical Airbnb income in Norddorf auf Amrum across different performance tiers:
- Best-in-class properties (Top 10%) achieve $3,421+ monthly, often utilizing dynamic pricing and superior guest experiences.
- Strong performing properties (Top 25%) earn $2,631 or more, indicating effective management and desirable locations/amenities.
- Typical properties (Median) generate around $1,615 per month, representing the average market performance.
- Entry-level properties (Bottom 25%) see earnings around $882, often with potential for optimization.
Average Monthly Airbnb Earnings Trend in Norddorf auf Amrum
Norddorf auf Amrum Airbnb Occupancy Rate Trends (2026)
Maximize your bookings by understanding the Norddorf auf Amrum STR occupancy trends. Seasonal demand shifts significantly influence how often properties are booked. Typically, Julysees the highest demand (peak season occupancy), while January experiences the lowest (low season). Effective strategies, like adjusting minimum stays or offering promotions, can boost occupancy during slower periods. Here's how different property tiers perform in Norddorf auf Amrum:
- Best-in-class properties (Top 10%) achieve 80%+ occupancy, indicating high desirability and potentially optimized availability.
- Strong performing properties (Top 25%) maintain 69% or higher occupancy, suggesting good market fit and guest satisfaction.
- Typical properties (Median) have an occupancy rate around 49%.
- Entry-level properties (Bottom 25%) average 24% occupancy, potentially facing higher vacancy.
Average Monthly Occupancy Rate Trend in Norddorf auf Amrum
Average Daily Rate (ADR) Airbnb Trends in Norddorf auf Amrum (2026)
Effective short term rental pricing strategy in Norddorf auf Amrum involves understanding monthly ADR fluctuations. The Average Daily Rate (ADR) for Airbnb in Norddorf auf Amrum typically peaks in July and dips lowest during February. Leveraging Airbnb dynamic pricing tools or strategies based on this seasonality can significantly boost revenue. Here's a look at the typical nightly rates achieved:
- Best-in-class properties (Top 10%) command rates of $175+ per night, often due to premium features or locations.
- Strong performing properties (Top 25%) achieve nightly rates of $161 or more.
- Typical properties (Median) charge around $134 per night.
- Entry-level properties (Bottom 25%) earn around $98 per night.
Average Daily Rate (ADR) Trend by Month in Norddorf auf Amrum
Get Live Norddorf auf Amrum Market Intelligence 👇
Explore Real-time Analytics
Airbnb Seasonality Analysis & Trends in Norddorf auf Amrum (2026)
Peak Season (July, August, September)
- Revenue averages $3,118 per month
- Occupancy rates average 68.5%
- Daily rates average $134
Shoulder Season
- Revenue averages $1,701 per month
- Occupancy maintains around 47.9%
- Daily rates hold near $125
Low Season (January, February, December)
- Revenue drops to average $859 per month
- Occupancy decreases to average 24.9%
- Daily rates adjust to average $125
Seasonality Insights for Norddorf auf Amrum
- The Airbnb seasonality in Norddorf auf Amrum shows highly seasonal trends requiring careful strategy. While the sections above show seasonal averages, it's also insightful to look at the extremes:
- During the high season, the absolute peak month showcases Norddorf auf Amrum's highest earning potential, with monthly revenues capable of climbing to $3,525, occupancy reaching a high of 76.3%, and ADRs peaking at $135.
- Conversely, the slowest single month of the year, typically falling within the low season, marks the market's lowest point. In this month, revenue might dip to $613, occupancy could drop to 12.6%, and ADRs may adjust down to $117.
- Understanding both the seasonal averages and these monthly peaks and troughs in revenue, occupancy, and ADR is crucial for maximizing your Airbnb profit potential in Norddorf auf Amrum.
Seasonal Strategies for Maximizing Profit
- Peak Season: Maximize revenue through premium pricing and potentially longer minimum stays. Ensure high availability.
- Low Season: Offer competitive pricing, special promotions (e.g., extended stay discounts), and flexible cancellation policies. Target off-season travelers like remote workers or budget-conscious guests.
- Shoulder Seasons: Implement dynamic pricing that balances peak and low rates. Target weekend travelers or specific events. Offer slightly more flexible terms than peak season.
- Regularly analyze your own performance against these Norddorf auf Amrum seasonality benchmarks and adjust your pricing and availability strategy accordingly.
Best Areas for Airbnb Investment in Norddorf auf Amrum (2026)
Exploring the top neighborhoods for short-term rentals in Norddorf auf Amrum? This section highlights key areas, outlining why they are attractive for hosts and guests, along with notable local attractions. Consider these locations based on your target guest profile and investment strategy.
| Neighborhood / Area | Why Host Here? (Target Guests & Appeal) | Key Attractions & Landmarks |
|---|---|---|
| Norddorf Beach | A beautiful sandy beach popular for sunbathing and water sports, perfect for tourists looking to enjoy the North Sea. | Amrum Lighthouse, Wulfser Strand, Wattenmeer National Park, beach bars, cycling tours |
| Village of Norddorf | Charming village atmosphere with local shops and restaurants, ideal for visitors wanting to experience local culture. | Amrum Museum, Local restaurants, Bicycle rental shops, Art galleries, Historic architecture |
| Nieblum | A picturesque village known for its traditional Frisian houses and serene atmosphere, attracting families and couples. | Nieblum Beach, Frisian restaurants, Historical sites, Church of St. John, Nature reserves |
| Amrum Dunes | Unique natural landscape with dunes and nature trails, appealing to nature lovers and hikers. | Dune hiking trails, Bird watching, Natural reserves, Scenic viewpoints, Peaceful surroundings |
| Amrum Golf Club | Attracts golf enthusiasts with beautiful views and a relaxing atmosphere, ideal for sporting tourists. | Golf course, Clubhouse restaurant, Golf events, Natural scenery, Relaxation areas |
| North Sea Cycle Route | Part of the scenic cycling route along the North Sea, attracting active tourists and cycling enthusiasts. | Cycling trails, Landscape views, Coastal towns, Cafés, Bicycle rental shops |
| Visit to Halligen | Offers unique boat trips to nearby Halligen islands, popular among adventurous travelers. | Boat tours, Wildlife experiences, Seaside vistas, Cultural experiences on Halligen, Photography opportunities |
| Kreuzung von Norddorf und Nebel | A central point for accessing various parts of the island, convenient for visitors to explore all attractions. | Bus connections, Cycle paths, Local shops, Parks, Access to other villages |
Understanding Airbnb License Requirements & STR Laws in Norddorf auf Amrum (2026)
While Norddorf auf Amrum, Schleswig-Holstein, Germany currently shows low STR regulations, specific Airbnb license requirements might still exist or change. Always verify the latest short term rental regulations and Airbnb license requirements directly with local government authorities for Norddorf auf Amrum to ensure full compliance before hosting.
(Source: AirROI data, 2026, finding no licensed listings among those analyzed)
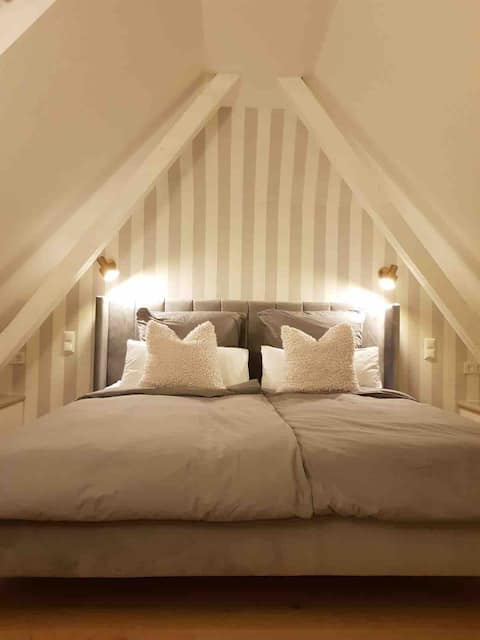
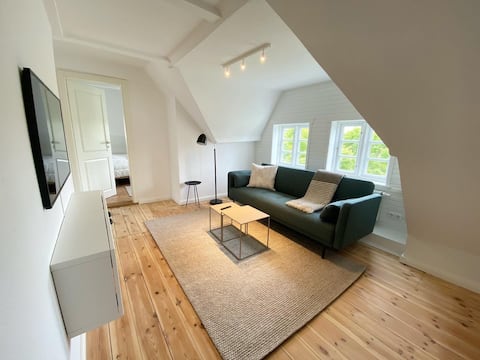
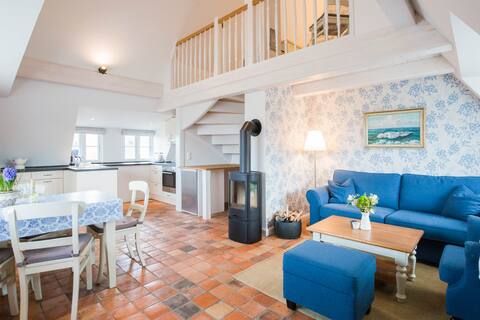
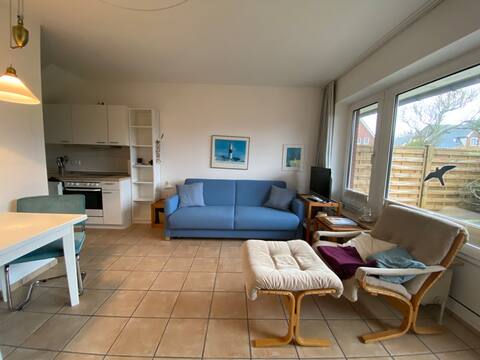
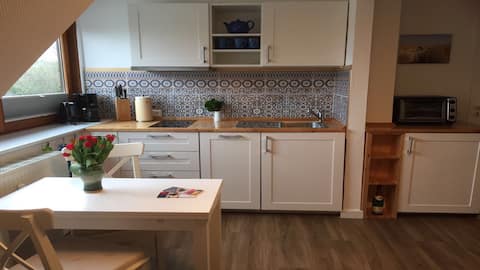
Top Performing Airbnb Properties in Norddorf auf Amrum (2026)
Benchmark your potential! Explore examples of top-performing Airbnb properties in Norddorf auf Amrumbased on Trailing Twelve Month (TTM) revenue. Analyze their characteristics, revenue, occupancy rate, and ADR to understand what drives success in this market.
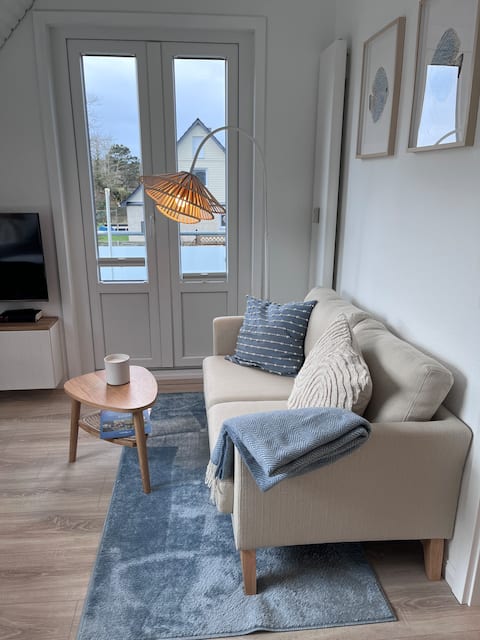
Cozy and newly furnished apartment
Entire Place • 1 bedroom
Beautiful light-flooded apartment in Norddorf
Entire Place • 2 bedrooms
Modern apartment with sea view in a Frisian house
Entire Place • 1 bedroom
TAU Vacation Rental
Entire Place • 3 bedrooms
Gemütliche 2-Zimmer Wohnung
Entire Place • 1 bedroom
Beautiful duplex apartment in Norddorf
Entire Place • 2 bedrooms
Note: Performance varies based on location, size, amenities, seasonality, and management quality. Data reflects the past 12 months.
Top Performing Airbnb Hosts in Norddorf auf Amrum (2026)
Learn from the best! This table showcases top-performing Airbnb hosts in Norddorf auf Amrum based on the number of properties managed and estimated total revenue over the past year. Analyze their scale and performance metrics.
| Host Name | Properties | Grossing Revenue | Stay Reviews | Avg Rating |
|---|---|---|---|---|
| Vivien | 2 | $62,625 | 33 | 4.88/5.0 |
| Mathias | 3 | $44,769 | 11 | 5.00/5.0 |
| I. | 1 | $24,933 | 38 | 4.92/5.0 |
| Juliane | 1 | $20,451 | 19 | 4.79/5.0 |
| Stefan | 1 | $19,784 | 78 | 4.88/5.0 |
| Friederike | 1 | $18,121 | 108 | 4.55/5.0 |
| Klaus | 2 | $18,004 | 22 | 4.60/5.0 |
| Theda | 6 | $12,716 | 21 | 4.58/5.0 |
| Sabine | 1 | $3,330 | 43 | 5.00/5.0 |
Analyzing the strategies of top hosts, such as their property selection, pricing, and guest communication, can offer valuable lessons for optimizing your own Airbnb operations in Norddorf auf Amrum.
Dive Deeper: Advanced Norddorf auf Amrum STR Market Data (2026)
Ready to unlock more insights? AirROI provides access to advanced metrics and comprehensive Airbnb data for Norddorf auf Amrum. Explore detailed analytics beyond this report to refine your investment strategy, optimize pricing, and maximize your vacation rental profits.
Explore Advanced MetricsNorddorf auf Amrum Short-Term Rental Market Composition (2026): Property & Room Types
Room Type Distribution
Property Type Distribution
Market Composition Insights for Norddorf auf Amrum
- The Norddorf auf Amrum Airbnb market composition is heavily skewed towards Entire Home/Apt listings, which make up 94.4% of the 18 active rentals. This indicates strong guest preference for privacy and space.
- Looking at the property type distribution in Norddorf auf Amrum, Apartment/Condo properties are the most common (94.4%), reflecting the local real estate landscape.
Norddorf auf Amrum Airbnb Room Capacity Analysis (2026): Bedroom Distribution
Distribution of Listings by Number of Bedrooms
Room Capacity Insights for Norddorf auf Amrum
- The dominant room capacity in Norddorf auf Amrum is 1 bedroom listings, making up 61.1% of the market. This suggests a strong demand for properties suitable for couples or solo travelers.
- Together, 1 bedroom and 2 bedrooms properties represent 88.9% of the active Airbnb listings in Norddorf auf Amrum, indicating a high concentration in these sizes.
- With over half the market (61.1%) consisting of studios or 1-bedroom units, Norddorf auf Amrum is particularly well-suited for individuals or couples.
- Listings with 3+ bedrooms (5.6%) represent a smaller niche, potentially indicating an underserved market for larger group accommodations in Norddorf auf Amrum.
Norddorf auf Amrum Vacation Rental Guest Capacity Trends (2026)
Distribution of Listings by Guest Capacity
Guest Capacity Insights for Norddorf auf Amrum
- The most common guest capacity trend in Norddorf auf Amrum vacation rentals is listings accommodating 2 guests (61.1%). This suggests the primary traveler segment is likely couples or solo travelers.
- Properties designed for 2 guests and 4 guests dominate the Norddorf auf Amrum STR market, accounting for 77.8% of listings.
- A significant 61.1% of listings cater specifically to 1-2 guests, highlighting strong demand from couples and solo travelers in Norddorf auf Amrum.
- On average, properties in Norddorf auf Amrum are equipped to host 2.6 guests.
Norddorf auf Amrum Airbnb Booking Patterns (2026): Available vs. Booked Days
Available Days Distribution
Booked Days Distribution
Booking Pattern Insights for Norddorf auf Amrum
- The most common availability pattern in Norddorf auf Amrum falls within the 271-366 days range, representing 55.6% of listings. This suggests many properties have significant open periods on their calendars.
- Approximately 77.8% of listings show high availability (181+ days open annually), indicating potential for increased bookings or specific owner usage patterns.
- For booked days, the 1-30 days range is most frequent in Norddorf auf Amrum (33.3%), reflecting common guest stay durations or potential owner blocking patterns.
- A notable 22.2% of properties secure long booking periods (181+ days booked per year), highlighting successful long-term rental strategies or significant owner usage.
Norddorf auf Amrum Airbnb Minimum Stay Requirements Analysis
Distribution of Listings by Minimum Night Requirement
1 Night
1 listings
5.6% of total
4-6 Nights
8 listings
44.4% of total
30+ Nights
9 listings
50% of total
Key Insights
- The most prevalent minimum stay requirement in Norddorf auf Amrum is 30+ Nights, adopted by 50% of listings. This highlights the market's preference for longer commitments.
- Very short stays (1-2 nights) are less common (5.6%), suggesting hosts prefer slightly longer bookings to optimize turnover.
- A significant segment (50%) caters to monthly stays (30+ nights) in Norddorf auf Amrum, pointing to opportunities in the extended-stay market.
Recommendations
- Align with the market by considering a 30+ Nights minimum stay, as 50% of Norddorf auf Amrum hosts use this setting.
- If feasible, allowing 1-night stays, especially midweek or during low season, could capture last-minute bookings, as only 5.6% currently do.
- Explore offering discounts for stays of 30+ nights to attract the 50% of the market seeking extended stays.
- Adjust minimum nights based on seasonality – potentially shorter during low season and longer during peak demand periods in Norddorf auf Amrum.
Norddorf auf Amrum Airbnb Cancellation Policy Trends Analysis (2026)
Flexible
3 listings
16.7% of total
Moderate
2 listings
11.1% of total
Strict
13 listings
72.2% of total
Cancellation Policy Insights for Norddorf auf Amrum
- The prevailing Airbnb cancellation policy trend in Norddorf auf Amrum is Strict, used by 72.2% of listings.
- A majority (72.2%) of hosts in Norddorf auf Amrum utilize Firm or Strict policies, indicating a market where hosts prioritize booking security.
Recommendations for Hosts
- Consider adopting a Strict policy to align with the 72.2% market standard in Norddorf auf Amrum.
- With 72.2% using Strict terms, this is a viable option in Norddorf auf Amrum, particularly for high-value properties or during peak demand periods.
- Regularly review your cancellation policy against competitors and market demand shifts in Norddorf auf Amrum.
Norddorf auf Amrum STR Booking Lead Time Analysis (2026)
Average Booking Lead Time by Month
Booking Lead Time Insights for Norddorf auf Amrum
- The overall average booking lead time for vacation rentals in Norddorf auf Amrum is 104 days.
- Guests book furthest in advance for stays during July (average 195 days), likely coinciding with peak travel demand or local events.
- The shortest booking windows occur for stays in February (average 19 days), indicating more last-minute travel plans during this time.
- Seasonally, Summer (163 days avg.) sees the longest lead times, while Winter (55 days avg.) has the shortest, reflecting typical travel planning cycles.
Recommendations for Hosts
- Use the overall average lead time (104 days) as a baseline for your pricing and availability strategy in Norddorf auf Amrum.
- For July stays, consider implementing length-of-stay discounts or slightly higher rates for bookings made less than 195 days out to capitalize on advance planning.
- Target marketing efforts for the Summer season well in advance (at least 163 days) to capture early planners.
- Monitor your own booking lead times against these Norddorf auf Amrum averages to identify opportunities for dynamic pricing adjustments.
Popular & Essential Airbnb Amenities in Norddorf auf Amrum (2026)
Amenity Prevalence
Amenity Insights for Norddorf auf Amrum
- Essential amenities in Norddorf auf Amrum that guests expect include: Hair dryer, Heating, Kitchen, TV, Smoke alarm. Lacking these (any) could significantly impact bookings.
- Popular amenities like Stove, Refrigerator, Wifi are common but not universal. Offering these can provide a competitive edge.
- Warning: Wifi is not universally provided but is considered essential globally. Ensure reliable Wifi is offered.
Recommendations for Hosts
- Ensure your listing includes all essential amenities for Norddorf auf Amrum: Hair dryer, Heating, Kitchen, TV, Smoke alarm.
- Consider adding popular differentiators like Stove or Refrigerator to increase appeal.
- Highlight unique or less common amenities you offer (e.g., hot tub, dedicated workspace, EV charger) in your listing description and photos.
- Regularly check competitor amenities in Norddorf auf Amrum to stay competitive.
Norddorf auf Amrum Airbnb Guest Demographics & Profile Analysis (2026)
Guest Profile Summary for Norddorf auf Amrum
- The typical guest profile for Airbnb in Norddorf auf Amrum consists of primarily domestic travelers (90%), often arriving from nearby Berlin, typically belonging to the Post-2000s (Gen Z/Alpha) group (50%), primarily speaking English or German.
- Domestic travelers account for 89.8% of guests.
- Key international markets include Germany (89.8%) and Switzerland (6.1%).
- Top languages spoken are English (40.7%) followed by German (40.7%).
- A significant demographic segment is the Post-2000s (Gen Z/Alpha) group, representing 50% of guests.
Recommendations for Hosts
- Target domestic marketing efforts towards travelers from Berlin and Hamburg.
- Tailor amenities and listing descriptions to appeal to the dominant Post-2000s (Gen Z/Alpha) demographic (e.g., highlight fast WiFi, smart home features, local guides).
- Highlight unique local experiences or amenities relevant to the primary guest profile.
- Consider seasonal promotions aligned with peak travel times for key origin markets.
Nearby Short-Term Rental Market Comparison
How does the Norddorf auf Amrum Airbnb market stack up against its neighbors? Compare key performance metrics like average monthly revenue, ADR, and occupancy rates in surrounding areas to understand the broader regional STR landscape.
| Market | Active Properties | Monthly Revenue | Daily Rate | Avg. Occupancy |
|---|---|---|---|---|
| Husum-Ballum | 13 | $4,837 | $499.93 | 44% |
| Blåvand | 16 | $2,374 | $318.93 | 40% |
| Helgoland | 11 | $2,199 | $167.07 | 58% |
| Billund | 105 | $2,027 | $194.14 | 46% |
| Vlagtwedde | 38 | $2,018 | $352.87 | 31% |
| Oberndorf | 10 | $1,872 | $186.86 | 28% |
| Tetenbüll | 29 | $1,849 | $238.36 | 34% |
| Hamburg | 2,515 | $1,836 | $157.66 | 49% |
| Kampen (Sylt) | 25 | $1,824 | $508.88 | 23% |
| Brake | 19 | $1,755 | $136.43 | 46% |