Oldsum Airbnb Market Analysis 2026: Short Term Rental Data & Vacation Rental Statistics in Schleswig-Holstein, Germany
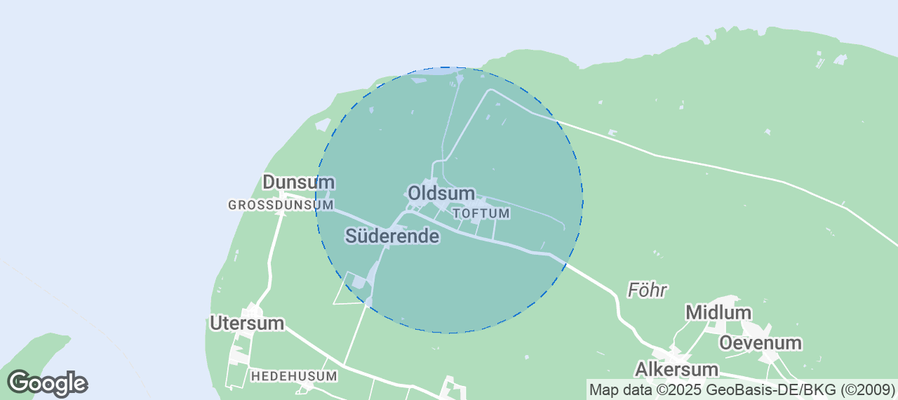
Is Airbnb profitable in Oldsum in 2026? Explore comprehensive Airbnb analytics for Oldsum, Schleswig-Holstein, Germany to uncover income potential. This 2026 STR market report for Oldsum, based on AirROI data from February 2025 to January 2026, reveals key trends in the niche market of 19 active listings.
Whether you're considering an Airbnb investment in Oldsum, optimizing your existing vacation rental, or exploring rental arbitrage opportunities, understanding the Oldsum Airbnb data is crucial. Leveraging the low regulation environment is key to maximizing your short term rental income potential. Let's dive into the specifics.
Key Oldsum Airbnb Performance Metrics Overview
Monthly Airbnb Revenue Variations & Income Potential in Oldsum (2026)
Understanding the monthly revenue variations for Airbnb listings in Oldsum is key to maximizing your short term rental income potential. Seasonality significantly impacts earnings. Our analysis, based on data from the past 12 months, shows that the peak revenue month for STRs in Oldsum is typically July, while November often presents the lowest earnings, highlighting opportunities for strategic pricing adjustments during shoulder and low seasons. Explore the typical Airbnb income in Oldsum across different performance tiers:
- Best-in-class properties (Top 10%) achieve $2,904+ monthly, often utilizing dynamic pricing and superior guest experiences.
- Strong performing properties (Top 25%) earn $2,041 or more, indicating effective management and desirable locations/amenities.
- Typical properties (Median) generate around $1,378 per month, representing the average market performance.
- Entry-level properties (Bottom 25%) see earnings around $675, often with potential for optimization.
Average Monthly Airbnb Earnings Trend in Oldsum
Oldsum Airbnb Occupancy Rate Trends (2026)
Maximize your bookings by understanding the Oldsum STR occupancy trends. Seasonal demand shifts significantly influence how often properties are booked. Typically, Augustsees the highest demand (peak season occupancy), while January experiences the lowest (low season). Effective strategies, like adjusting minimum stays or offering promotions, can boost occupancy during slower periods. Here's how different property tiers perform in Oldsum:
- Best-in-class properties (Top 10%) achieve 68%+ occupancy, indicating high desirability and potentially optimized availability.
- Strong performing properties (Top 25%) maintain 51% or higher occupancy, suggesting good market fit and guest satisfaction.
- Typical properties (Median) have an occupancy rate around 31%.
- Entry-level properties (Bottom 25%) average 15% occupancy, potentially facing higher vacancy.
Average Monthly Occupancy Rate Trend in Oldsum
Average Daily Rate (ADR) Airbnb Trends in Oldsum (2026)
Effective short term rental pricing strategy in Oldsum involves understanding monthly ADR fluctuations. The Average Daily Rate (ADR) for Airbnb in Oldsum typically peaks in January and dips lowest during February. Leveraging Airbnb dynamic pricing tools or strategies based on this seasonality can significantly boost revenue. Here's a look at the typical nightly rates achieved:
- Best-in-class properties (Top 10%) command rates of $229+ per night, often due to premium features or locations.
- Strong performing properties (Top 25%) achieve nightly rates of $191 or more.
- Typical properties (Median) charge around $145 per night.
- Entry-level properties (Bottom 25%) earn around $109 per night.
Average Daily Rate (ADR) Trend by Month in Oldsum
Get Live Oldsum Market Intelligence 👇
Explore Real-time Analytics
Airbnb Seasonality Analysis & Trends in Oldsum (2026)
Peak Season (July, August, September)
- Revenue averages $2,239 per month
- Occupancy rates average 53.2%
- Daily rates average $164
Shoulder Season
- Revenue averages $1,485 per month
- Occupancy maintains around 33.6%
- Daily rates hold near $159
Low Season (January, March, November)
- Revenue drops to average $761 per month
- Occupancy decreases to average 21.1%
- Daily rates adjust to average $164
Seasonality Insights for Oldsum
- The Airbnb seasonality in Oldsum shows highly seasonal trends requiring careful strategy. While the sections above show seasonal averages, it's also insightful to look at the extremes:
- During the high season, the absolute peak month showcases Oldsum's highest earning potential, with monthly revenues capable of climbing to $2,574, occupancy reaching a high of 57.0%, and ADRs peaking at $175.
- Conversely, the slowest single month of the year, typically falling within the low season, marks the market's lowest point. In this month, revenue might dip to $588, occupancy could drop to 16.9%, and ADRs may adjust down to $144.
- Understanding both the seasonal averages and these monthly peaks and troughs in revenue, occupancy, and ADR is crucial for maximizing your Airbnb profit potential in Oldsum.
Seasonal Strategies for Maximizing Profit
- Peak Season: Maximize revenue through premium pricing and potentially longer minimum stays. Ensure high availability.
- Low Season: Offer competitive pricing, special promotions (e.g., extended stay discounts), and flexible cancellation policies. Target off-season travelers like remote workers or budget-conscious guests.
- Shoulder Seasons: Implement dynamic pricing that balances peak and low rates. Target weekend travelers or specific events. Offer slightly more flexible terms than peak season.
- Regularly analyze your own performance against these Oldsum seasonality benchmarks and adjust your pricing and availability strategy accordingly.
Best Areas for Airbnb Investment in Oldsum (2026)
Exploring the top neighborhoods for short-term rentals in Oldsum? This section highlights key areas, outlining why they are attractive for hosts and guests, along with notable local attractions. Consider these locations based on your target guest profile and investment strategy.
| Neighborhood / Area | Why Host Here? (Target Guests & Appeal) | Key Attractions & Landmarks |
|---|---|---|
| Oldsum Village | Charming village atmosphere with traditional Frisian architecture, ideal for guests looking for a peaceful retreat in nature while still being close to the North Sea coast. | Frisian Wadden Sea, Oldsum Church, Traditional Frisian Farms, Local Art Galleries, Biking and Hiking Routes |
| Bølling | Located near the coastal area, this village offers a tranquil environment with easy access to the beach and water activities, making it perfect for families and beachgoers. | North Frisian Golf Club, Beachfront Access, Scenic Coastal Walks, Local Restaurants, Water Sports Activities |
| Nolde Museum | Home to the Nolde Museum, this area attracts art lovers and tourists interested in culture and history, providing a unique opportunity for a culturally rich stay. | Nolde Stiftung Museum, Art Exhibitions, Beautiful Gardens, Cultural Events, Local History Tours |
| Norddeich Beach | Popular beach destination that draws in tourists during summer months, known for its family-friendly atmosphere and water activities. | North Sea Coastline, Beachfront Promenade, Wellenbad Norddeich, Seehundstation Norddeich, Dune Walks |
| Dagebüll | Seaside village with ferry connections to the North Frisian Islands, making it an excellent spot for tourists heading to the islands. | Dagebüller Strand (Beach), Ferry Services to Islands, Nature Reserves, Local Seafood Restaurants, Coastal Hiking Trails |
| Föhr Island | Beautiful and popular island with a stunning coastline, rich in natural beauty, and ideal for tourists looking for a complete escape from city life. | Wyk Beach, Local Villages, Cycling Paths, Watersports Centers, Historic Sites |
| Sylt Island | Famous for its upscale clientele and beautiful beaches, attracting luxury travelers, yacht enthusiasts, and party-goers. | Westerland Beach, Kampen Lighthouse, Sylt Aquarium, Water Sports Activities, Fine Dining Restaurants |
| Schleswig-Holstein Wadden Sea | A UNESCO World Heritage site, perfect for nature enthusiasts and eco-tourists wanting to experience the unique tidal flats and diverse wildlife. | Wadden Sea National Park, Guided Nature Tours, Birdwatching, Walking Paths, Educational Centers |
Understanding Airbnb License Requirements & STR Laws in Oldsum (2026)
While Oldsum, Schleswig-Holstein, Germany currently shows low STR regulations, specific Airbnb license requirements might still exist or change. Always verify the latest short term rental regulations and Airbnb license requirements directly with local government authorities for Oldsum to ensure full compliance before hosting.
(Source: AirROI data, 2026, finding no licensed listings among those analyzed)
Top Performing Airbnb Properties in Oldsum (2026)
Benchmark your potential! Explore examples of top-performing Airbnb properties in Oldsumbased on Trailing Twelve Month (TTM) revenue. Analyze their characteristics, revenue, occupancy rate, and ADR to understand what drives success in this market.
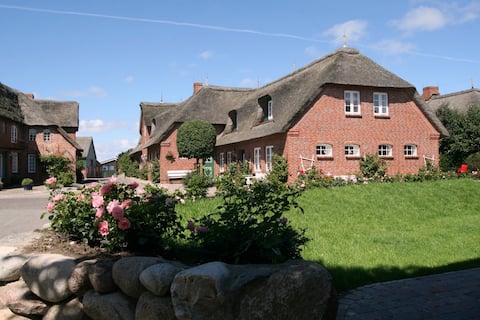
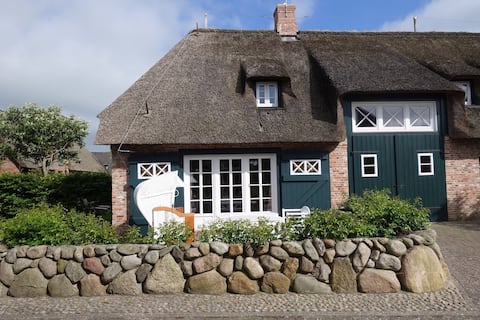
"Second home" Oldsum, vacation under the thatched roof
Entire Place • 3 bedrooms
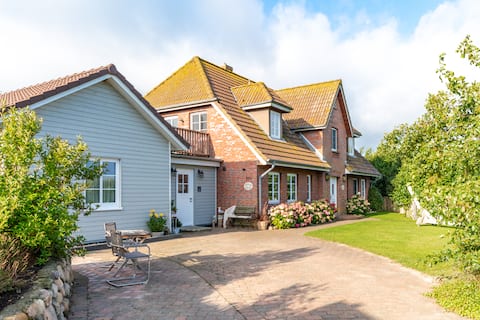
Morning sun apartment on Föhr
Entire Place • 2 bedrooms
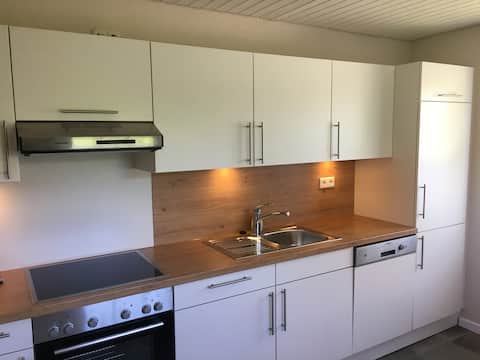
"Uun Olersam" vacation on Föhr
Entire Place • 2 bedrooms

Holiday home for 6 guests with 150m² in Oldsum (109337)
Entire Place • 3 bedrooms
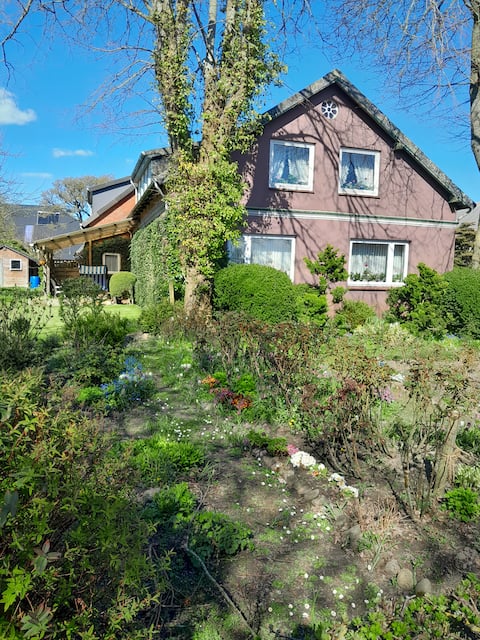
Historical cottage under thatch
Entire Place • 2 bedrooms
Top floor apartment with separate entrance
Entire Place • 1 bedroom
Note: Performance varies based on location, size, amenities, seasonality, and management quality. Data reflects the past 12 months.
Top Performing Airbnb Hosts in Oldsum (2026)
Learn from the best! This table showcases top-performing Airbnb hosts in Oldsum based on the number of properties managed and estimated total revenue over the past year. Analyze their scale and performance metrics.
| Host Name | Properties | Grossing Revenue | Stay Reviews | Avg Rating |
|---|---|---|---|---|
| Steffen | 5 | $51,959 | 11 | 5.00/5.0 |
| Inken | 3 | $40,634 | 44 | 5.00/5.0 |
| Ulrike | 1 | $21,145 | 7 | 5.00/5.0 |
| Sandra | 3 | $20,819 | 6 | 4.33/5.0 |
| Ingke | 1 | $20,079 | 100 | 4.98/5.0 |
| Sabine | 1 | $14,459 | 36 | 4.97/5.0 |
| Frauke | 1 | $14,228 | 21 | 4.86/5.0 |
| Ingke | 1 | $12,951 | 246 | 4.96/5.0 |
| Stefanie | 1 | $6,436 | 28 | 5.00/5.0 |
| Teresa - Belvilla | 1 | $2,483 | 1 | Not Rated |
Analyzing the strategies of top hosts, such as their property selection, pricing, and guest communication, can offer valuable lessons for optimizing your own Airbnb operations in Oldsum.
Dive Deeper: Advanced Oldsum STR Market Data (2026)
Ready to unlock more insights? AirROI provides access to advanced metrics and comprehensive Airbnb data for Oldsum. Explore detailed analytics beyond this report to refine your investment strategy, optimize pricing, and maximize your vacation rental profits.
Explore Advanced MetricsOldsum Short-Term Rental Market Composition (2026): Property & Room Types
Room Type Distribution
Property Type Distribution
Market Composition Insights for Oldsum
- The Oldsum Airbnb market composition is heavily skewed towards Entire Home/Apt listings, which make up 100% of the 19 active rentals. This indicates strong guest preference for privacy and space.
- Looking at the property type distribution in Oldsum, Apartment/Condo properties are the most common (63.2%), reflecting the local real estate landscape.
- Houses represent a significant 31.6% portion, catering likely to families or larger groups.
Oldsum Airbnb Room Capacity Analysis (2026): Bedroom Distribution
Distribution of Listings by Number of Bedrooms
Room Capacity Insights for Oldsum
- The dominant room capacity in Oldsum is 2 bedrooms listings, making up 63.2% of the market. This suggests a strong demand for properties suitable for couples or solo travelers.
- Together, 2 bedrooms and 1 bedroom properties represent 84.3% of the active Airbnb listings in Oldsum, indicating a high concentration in these sizes.
Oldsum Vacation Rental Guest Capacity Trends (2026)
Distribution of Listings by Guest Capacity
Guest Capacity Insights for Oldsum
- The most common guest capacity trend in Oldsum vacation rentals is listings accommodating 4 guests (52.6%). This suggests the primary traveler segment is likely small families or groups.
- Properties designed for 4 guests and 2 guests dominate the Oldsum STR market, accounting for 68.4% of listings.
- 10.5% of properties accommodate 6+ guests, serving the market segment for larger families or group travel in Oldsum.
- On average, properties in Oldsum are equipped to host 3.9 guests.
Oldsum Airbnb Booking Patterns (2026): Available vs. Booked Days
Available Days Distribution
Booked Days Distribution
Booking Pattern Insights for Oldsum
- The most common availability pattern in Oldsum falls within the 271-366 days range, representing 63.2% of listings. This suggests many properties have significant open periods on their calendars.
- Approximately 94.8% of listings show high availability (181+ days open annually), indicating potential for increased bookings or specific owner usage patterns.
- For booked days, the 31-90 days range is most frequent in Oldsum (42.1%), reflecting common guest stay durations or potential owner blocking patterns.
- A notable 10.5% of properties secure long booking periods (181+ days booked per year), highlighting successful long-term rental strategies or significant owner usage.
Oldsum Airbnb Minimum Stay Requirements Analysis
Distribution of Listings by Minimum Night Requirement
3 Nights
2 listings
10.5% of total
4-6 Nights
4 listings
21.1% of total
7-29 Nights
1 listings
5.3% of total
30+ Nights
12 listings
63.2% of total
Key Insights
- The most prevalent minimum stay requirement in Oldsum is 30+ Nights, adopted by 63.2% of listings. This highlights the market's preference for longer commitments.
- A significant segment (63.2%) caters to monthly stays (30+ nights) in Oldsum, pointing to opportunities in the extended-stay market.
Recommendations
- Align with the market by considering a 30+ Nights minimum stay, as 63.2% of Oldsum hosts use this setting.
- Explore offering discounts for stays of 30+ nights to attract the 63.2% of the market seeking extended stays.
- Adjust minimum nights based on seasonality – potentially shorter during low season and longer during peak demand periods in Oldsum.
Oldsum Airbnb Cancellation Policy Trends Analysis (2026)
Super Strict 30 Days
6 listings
31.6% of total
Super Strict 60 Days
3 listings
15.8% of total
Flexible
1 listings
5.3% of total
Firm
5 listings
26.3% of total
Strict
4 listings
21.1% of total
Cancellation Policy Insights for Oldsum
- The prevailing Airbnb cancellation policy trend in Oldsum is Super Strict 30 Days, used by 31.6% of listings.
- There's a relatively balanced mix between guest-friendly (5.3%) and stricter (47.4%) policies, offering choices for different guest needs.
Recommendations for Hosts
- Consider adopting a Super Strict 30 Days policy to align with the 31.6% market standard in Oldsum.
- Regularly review your cancellation policy against competitors and market demand shifts in Oldsum.
Oldsum STR Booking Lead Time Analysis (2026)
Average Booking Lead Time by Month
Booking Lead Time Insights for Oldsum
- The overall average booking lead time for vacation rentals in Oldsum is 98 days.
- Guests book furthest in advance for stays during August (average 131 days), likely coinciding with peak travel demand or local events.
- The shortest booking windows occur for stays in March (average 23 days), indicating more last-minute travel plans during this time.
- Seasonally, Summer (117 days avg.) sees the longest lead times, while Spring (75 days avg.) has the shortest, reflecting typical travel planning cycles.
Recommendations for Hosts
- Use the overall average lead time (98 days) as a baseline for your pricing and availability strategy in Oldsum.
- For August stays, consider implementing length-of-stay discounts or slightly higher rates for bookings made less than 131 days out to capitalize on advance planning.
- Target marketing efforts for the Summer season well in advance (at least 117 days) to capture early planners.
- Monitor your own booking lead times against these Oldsum averages to identify opportunities for dynamic pricing adjustments.
Popular & Essential Airbnb Amenities in Oldsum (2026)
Amenity Prevalence
Amenity Insights for Oldsum
- Essential amenities in Oldsum that guests expect include: TV, Kitchen, Wifi, Heating. Lacking these (any) could significantly impact bookings.
- Popular amenities like Hair dryer, Free parking on premises, Smoke alarm are common but not universal. Offering these can provide a competitive edge.
Recommendations for Hosts
- Ensure your listing includes all essential amenities for Oldsum: TV, Kitchen, Wifi, Heating.
- Consider adding popular differentiators like Hair dryer or Free parking on premises to increase appeal.
- Highlight unique or less common amenities you offer (e.g., hot tub, dedicated workspace, EV charger) in your listing description and photos.
- Regularly check competitor amenities in Oldsum to stay competitive.
Oldsum Airbnb Guest Demographics & Profile Analysis (2026)
Guest Profile Summary for Oldsum
- The typical guest profile for Airbnb in Oldsum consists of primarily domestic travelers (95%), often arriving from nearby Hamburg, typically belonging to the 1990s (Older Gen Z) group (50%), primarily speaking English or German.
- Domestic travelers account for 95.0% of guests.
- Key international markets include Germany (95%) and United States (2.5%).
- Top languages spoken are English (38.1%) followed by German (33.3%).
- A significant demographic segment is the Post-2000s (Gen Z/Alpha) group, representing 50% of guests.
Recommendations for Hosts
- Target domestic marketing efforts towards travelers from Hamburg and Munich.
- Tailor amenities and listing descriptions to appeal to the dominant 1990s (Older Gen Z) demographic (e.g., highlight fast WiFi, smart home features, local guides).
- Highlight unique local experiences or amenities relevant to the primary guest profile.
- Consider seasonal promotions aligned with peak travel times for key origin markets.
Nearby Short-Term Rental Market Comparison
How does the Oldsum Airbnb market stack up against its neighbors? Compare key performance metrics like average monthly revenue, ADR, and occupancy rates in surrounding areas to understand the broader regional STR landscape.
| Market | Active Properties | Monthly Revenue | Daily Rate | Avg. Occupancy |
|---|---|---|---|---|
| Husum-Ballum | 13 | $4,837 | $499.93 | 44% |
| Blåvand | 16 | $2,374 | $318.93 | 40% |
| Helgoland | 11 | $2,199 | $167.07 | 58% |
| Billund | 105 | $2,027 | $194.14 | 46% |
| Vlagtwedde | 38 | $2,018 | $352.87 | 31% |
| Oberndorf | 10 | $1,872 | $186.86 | 28% |
| Tetenbüll | 29 | $1,849 | $238.36 | 34% |
| Hamburg | 2,515 | $1,836 | $157.66 | 49% |
| Kampen (Sylt) | 25 | $1,824 | $508.88 | 23% |
| Brake | 19 | $1,755 | $136.43 | 46% |