Municipality of Nea Propontida Airbnb Market Analysis 2026: Short Term Rental Data & Vacation Rental Statistics in Macedonia and Thrace, Greece
Is Airbnb profitable in Municipality of Nea Propontida in 2026? Explore comprehensive Airbnb analytics for Municipality of Nea Propontida, Macedonia and Thrace, Greece to uncover income potential. This 2026 STR market report for Municipality of Nea Propontida, based on AirROI data from February 2025 to January 2026, reveals key trends in the niche market of 65 active listings.
Whether you're considering an Airbnb investment in Municipality of Nea Propontida, optimizing your existing vacation rental, or exploring rental arbitrage opportunities, understanding the Municipality of Nea Propontida Airbnb data is crucial. Navigating the high regulation landscape is key to maximizing your short term rental income potential. Let's dive into the specifics.
Key Municipality of Nea Propontida Airbnb Performance Metrics Overview
Monthly Airbnb Revenue Variations & Income Potential in Municipality of Nea Propontida (2026)
Understanding the monthly revenue variations for Airbnb listings in Municipality of Nea Propontida is key to maximizing your short term rental income potential. Seasonality significantly impacts earnings. Our analysis, based on data from the past 12 months, shows that the peak revenue month for STRs in Municipality of Nea Propontida is typically August, while December often presents the lowest earnings, highlighting opportunities for strategic pricing adjustments during shoulder and low seasons. Explore the typical Airbnb income in Municipality of Nea Propontida across different performance tiers:
- Best-in-class properties (Top 10%) achieve $4,623+ monthly, often utilizing dynamic pricing and superior guest experiences.
- Strong performing properties (Top 25%) earn $2,915 or more, indicating effective management and desirable locations/amenities.
- Typical properties (Median) generate around $1,642 per month, representing the average market performance.
- Entry-level properties (Bottom 25%) see earnings around $870, often with potential for optimization.
Average Monthly Airbnb Earnings Trend in Municipality of Nea Propontida
Municipality of Nea Propontida Airbnb Occupancy Rate Trends (2026)
Maximize your bookings by understanding the Municipality of Nea Propontida STR occupancy trends. Seasonal demand shifts significantly influence how often properties are booked. Typically, Augustsees the highest demand (peak season occupancy), while December experiences the lowest (low season). Effective strategies, like adjusting minimum stays or offering promotions, can boost occupancy during slower periods. Here's how different property tiers perform in Municipality of Nea Propontida:
- Best-in-class properties (Top 10%) achieve 75%+ occupancy, indicating high desirability and potentially optimized availability.
- Strong performing properties (Top 25%) maintain 60% or higher occupancy, suggesting good market fit and guest satisfaction.
- Typical properties (Median) have an occupancy rate around 37%.
- Entry-level properties (Bottom 25%) average 22% occupancy, potentially facing higher vacancy.
Average Monthly Occupancy Rate Trend in Municipality of Nea Propontida
Average Daily Rate (ADR) Airbnb Trends in Municipality of Nea Propontida (2026)
Effective short term rental pricing strategy in Municipality of Nea Propontida involves understanding monthly ADR fluctuations. The Average Daily Rate (ADR) for Airbnb in Municipality of Nea Propontida typically peaks in August and dips lowest during March. Leveraging Airbnb dynamic pricing tools or strategies based on this seasonality can significantly boost revenue. Here's a look at the typical nightly rates achieved:
- Best-in-class properties (Top 10%) command rates of $344+ per night, often due to premium features or locations.
- Strong performing properties (Top 25%) achieve nightly rates of $199 or more.
- Typical properties (Median) charge around $139 per night.
- Entry-level properties (Bottom 25%) earn around $106 per night.
Average Daily Rate (ADR) Trend by Month in Municipality of Nea Propontida
Get Live Municipality of Nea Propontida Market Intelligence 👇

Explore Real-time Analytics
Airbnb Seasonality Analysis & Trends in Municipality of Nea Propontida (2026)
Peak Season (August, July, March)
- Revenue averages $3,955 per month
- Occupancy rates average 66.4%
- Daily rates average $204
Shoulder Season
- Revenue averages $2,061 per month
- Occupancy maintains around 38.0%
- Daily rates hold near $184
Low Season (January, February, December)
- Revenue drops to average $580 per month
- Occupancy decreases to average 22.5%
- Daily rates adjust to average $178
Seasonality Insights for Municipality of Nea Propontida
- The Airbnb seasonality in Municipality of Nea Propontida shows highly seasonal trends requiring careful strategy. While the sections above show seasonal averages, it's also insightful to look at the extremes:
- During the high season, the absolute peak month showcases Municipality of Nea Propontida's highest earning potential, with monthly revenues capable of climbing to $4,470, occupancy reaching a high of 72.1%, and ADRs peaking at $224.
- Conversely, the slowest single month of the year, typically falling within the low season, marks the market's lowest point. In this month, revenue might dip to $544, occupancy could drop to 16.8%, and ADRs may adjust down to $168.
- Understanding both the seasonal averages and these monthly peaks and troughs in revenue, occupancy, and ADR is crucial for maximizing your Airbnb profit potential in Municipality of Nea Propontida.
Seasonal Strategies for Maximizing Profit
- Peak Season: Maximize revenue through premium pricing and potentially longer minimum stays. Ensure high availability.
- Low Season: Offer competitive pricing, special promotions (e.g., extended stay discounts), and flexible cancellation policies. Target off-season travelers like remote workers or budget-conscious guests.
- Shoulder Seasons: Implement dynamic pricing that balances peak and low rates. Target weekend travelers or specific events. Offer slightly more flexible terms than peak season.
- Regularly analyze your own performance against these Municipality of Nea Propontida seasonality benchmarks and adjust your pricing and availability strategy accordingly.
Best Areas for Airbnb Investment in Municipality of Nea Propontida (2026)
Exploring the top neighborhoods for short-term rentals in Municipality of Nea Propontida? This section highlights key areas, outlining why they are attractive for hosts and guests, along with notable local attractions. Consider these locations based on your target guest profile and investment strategy.
| Neighborhood / Area | Why Host Here? (Target Guests & Appeal) | Key Attractions & Landmarks |
|---|---|---|
| Nea Moudania | A bustling town with a vibrant beachfront, Nea Moudania is popular among tourists for its access to beautiful beaches and a variety of local eateries. The town serves as a hub for exploring the surrounding region and is well-suited for summer vacation rentals. | Nea Moudania Beach, Fish Market, Local Taverns, Agios Nikolaos Church, Beachfront Promenade |
| Nea Potidea | Known for its picturesque canal and stunning beaches, Nea Potidea offers a unique mix of relaxation and local culture. The area is appealing to families and couples looking for a peaceful getaway close to the sea. | Nea Potidea Beach, Potidea Canal, Ancient Potidea Ruins, Local Markets, Dining on the Waterfront |
| Sani | Famous for its luxurious resorts and crystal-clear waters, Sani is a prime spot for high-end vacation rentals. It's a trendy destination for affluent tourists and families seeking a lavish beach experience in Greece. | Sani Beach, Sani Resort, Sani Marina, Nature Trails, Water Sports |
| Pefkochori | This charming village features a lively atmosphere with plenty of beach bars and restaurants. Pefkochori is ideal for attracting young travelers looking for a fun beach vacation, along with families seeking a relaxing retreat. | Pefkochori Beach, Beach Clubs, Local Bars, Shops and Boutiques, Water Activities |
| Kassandria | As a central point of the Kassandra peninsula, Kassandria provides easy access to various beaches and is a lively area year-round. It’s perfect for tourists who want to explore other parts of the peninsula easily. | Kassandria Beach, Local Festivals, Historical Sites, Shopping Areas, Restaurants |
| Hanioti | A popular tourist destination, Hanioti offers beautiful beaches and a vibrant nightlife. It's known for its picturesque village center filled with shops, restaurants, and bars, making it attractive for young vacationers. | Hanioti Beach, Lively Nightlife, Shopping Streets, Local Cuisine, Nearby Nature Parks |
| Polychrono | With its long sandy beach and hospitality, Polychrono is an emerging destination for families and travelers. The laid-back vibe and proximity to other great summer spots make it a smart choice for rental properties. | Polychrono Beach, Family-Friendly Activities, Cafes and Bakeries, Cultural Events, Nearby Tours |
| Afitos | Perched on a cliff with stunning sea views, Afitos is a traditional village that attracts tourists looking for an authentic Greek experience. The beautiful architecture and charm of the village provide great potential for Airbnb hosting. | Afitos Beach, Traditional Village Square, Historical Stone Houses, Local Artisans, Restaurants with Seaviews |
Understanding Airbnb License Requirements & STR Laws in Municipality of Nea Propontida (2026)
Yes, Municipality of Nea Propontida, Macedonia and Thrace, Greece enforces high STR regulations. Obtaining a license and ensuring compliance is almost certainly required according to current 2026 STR laws. Always verify the latest short term rental regulations and Airbnb license requirements directly with local government authorities for Municipality of Nea Propontida to ensure full compliance before hosting.
(Source: AirROI data, 2026, based on 89% licensed listings)
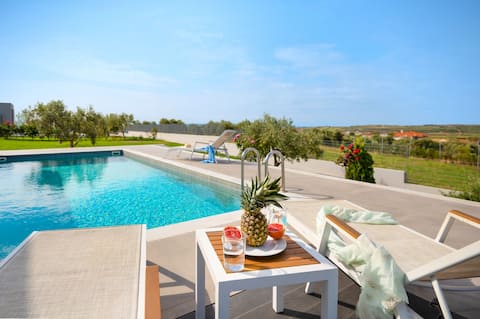
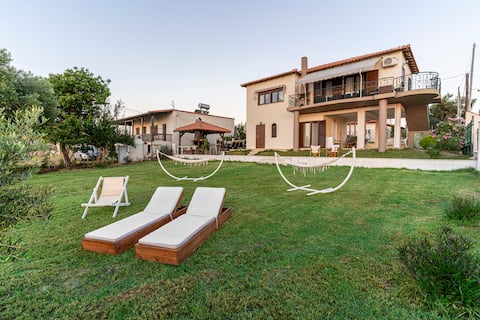
Top Performing Airbnb Properties in Municipality of Nea Propontida (2026)
Benchmark your potential! Explore examples of top-performing Airbnb properties in Municipality of Nea Propontidabased on Trailing Twelve Month (TTM) revenue. Analyze their characteristics, revenue, occupancy rate, and ADR to understand what drives success in this market.
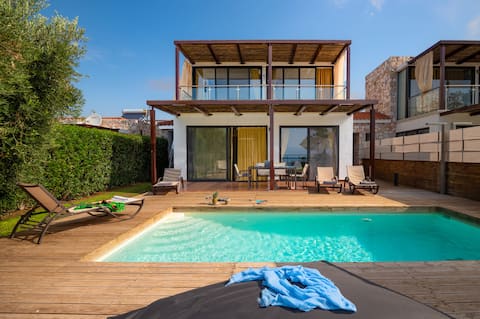
Kalma Villa Exi
Entire Place • 3 bedrooms
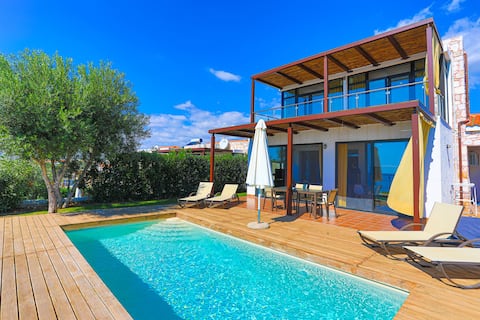
Kalma Villa Ena
Entire Place • 3 bedrooms
Sunset Villa
Entire Place • 2 bedrooms
Villa Karolina, Nea Potidea, Halkidiki
Entire Place • 4 bedrooms

Kalma Villa Dio
Entire Place • 3 bedrooms
#FLH - Beach Hut , Potidea
Entire Place • 2 bedrooms
Note: Performance varies based on location, size, amenities, seasonality, and management quality. Data reflects the past 12 months.
Top Performing Airbnb Hosts in Municipality of Nea Propontida (2026)
Learn from the best! This table showcases top-performing Airbnb hosts in Municipality of Nea Propontida based on the number of properties managed and estimated total revenue over the past year. Analyze their scale and performance metrics.
| Host Name | Properties | Grossing Revenue | Stay Reviews | Avg Rating |
|---|---|---|---|---|
| Eos Villas | 4 | $245,051 | 101 | 4.79/5.0 |
| Georgios | 3 | $66,623 | 20 | 4.53/5.0 |
| Karin | 1 | $49,416 | 12 | 5.00/5.0 |
| Victoria | 4 | $41,889 | 50 | 4.97/5.0 |
| FeelsLikeHomeGR | 1 | $34,622 | 11 | 4.73/5.0 |
| Theodoros | 2 | $29,951 | 30 | 4.93/5.0 |
| George | 3 | $29,560 | 46 | 4.68/5.0 |
| Panayiota | 1 | $27,449 | 40 | 4.98/5.0 |
| Μάριος | 1 | $24,073 | 24 | 5.00/5.0 |
| Γλαφυρα | 1 | $20,841 | 32 | 4.84/5.0 |
Analyzing the strategies of top hosts, such as their property selection, pricing, and guest communication, can offer valuable lessons for optimizing your own Airbnb operations in Municipality of Nea Propontida.
Dive Deeper: Advanced Municipality of Nea Propontida STR Market Data (2026)
Ready to unlock more insights? AirROI provides access to advanced metrics and comprehensive Airbnb data for Municipality of Nea Propontida. Explore detailed analytics beyond this report to refine your investment strategy, optimize pricing, and maximize your vacation rental profits.
Explore Advanced MetricsMunicipality of Nea Propontida Short-Term Rental Market Composition (2026): Property & Room Types
Room Type Distribution
Property Type Distribution
Market Composition Insights for Municipality of Nea Propontida
- The Municipality of Nea Propontida Airbnb market composition is heavily skewed towards Entire Home/Apt listings, which make up 98.5% of the 65 active rentals. This indicates strong guest preference for privacy and space.
- Looking at the property type distribution in Municipality of Nea Propontida, House properties are the most common (72.3%), reflecting the local real estate landscape.
- Houses represent a significant 72.3% portion, catering likely to families or larger groups.
- Smaller segments like hotel/boutique, outdoor/unique (combined 6.1%) offer potential for unique stay experiences.
Municipality of Nea Propontida Airbnb Room Capacity Analysis (2026): Bedroom Distribution
Distribution of Listings by Number of Bedrooms
Room Capacity Insights for Municipality of Nea Propontida
- The dominant room capacity in Municipality of Nea Propontida is 2 bedrooms listings, making up 52.3% of the market. This suggests a strong demand for properties suitable for couples or solo travelers.
- Together, 2 bedrooms and 1 bedroom properties represent 70.8% of the active Airbnb listings in Municipality of Nea Propontida, indicating a high concentration in these sizes.
- A significant 27.7% of listings offer 3+ bedrooms, catering to larger groups and families seeking more space in Municipality of Nea Propontida.
Municipality of Nea Propontida Vacation Rental Guest Capacity Trends (2026)
Distribution of Listings by Guest Capacity
Guest Capacity Insights for Municipality of Nea Propontida
- The most common guest capacity trend in Municipality of Nea Propontida vacation rentals is listings accommodating 4 guests (35.4%). This suggests the primary traveler segment is likely small families or groups.
- Properties designed for 4 guests and 8+ guests dominate the Municipality of Nea Propontida STR market, accounting for 56.9% of listings.
- 43.0% of properties accommodate 6+ guests, serving the market segment for larger families or group travel in Municipality of Nea Propontida.
- On average, properties in Municipality of Nea Propontida are equipped to host 5.5 guests.
Municipality of Nea Propontida Airbnb Booking Patterns (2026): Available vs. Booked Days
Available Days Distribution
Booked Days Distribution
Booking Pattern Insights for Municipality of Nea Propontida
- The most common availability pattern in Municipality of Nea Propontida falls within the 271-366 days range, representing 70.8% of listings. This suggests many properties have significant open periods on their calendars.
- Approximately 93.9% of listings show high availability (181+ days open annually), indicating potential for increased bookings or specific owner usage patterns.
- For booked days, the 31-90 days range is most frequent in Municipality of Nea Propontida (41.5%), reflecting common guest stay durations or potential owner blocking patterns.
- A notable 6.2% of properties secure long booking periods (181+ days booked per year), highlighting successful long-term rental strategies or significant owner usage.
Municipality of Nea Propontida Airbnb Minimum Stay Requirements Analysis
Distribution of Listings by Minimum Night Requirement
1 Night
1 listings
1.5% of total
2 Nights
3 listings
4.6% of total
3 Nights
4 listings
6.2% of total
4-6 Nights
32 listings
49.2% of total
7-29 Nights
2 listings
3.1% of total
30+ Nights
23 listings
35.4% of total
Key Insights
- The most prevalent minimum stay requirement in Municipality of Nea Propontida is 4-6 Nights, adopted by 49.2% of listings. This highlights the market's preference for longer commitments.
- Very short stays (1-2 nights) are less common (6.1%), suggesting hosts prefer slightly longer bookings to optimize turnover.
- A significant segment (35.4%) caters to monthly stays (30+ nights) in Municipality of Nea Propontida, pointing to opportunities in the extended-stay market.
Recommendations
- Align with the market by considering a 4-6 Nights minimum stay, as 49.2% of Municipality of Nea Propontida hosts use this setting.
- If feasible, allowing 1-night stays, especially midweek or during low season, could capture last-minute bookings, as only 1.5% currently do.
- Explore offering discounts for stays of 30+ nights to attract the 35.4% of the market seeking extended stays.
- Adjust minimum nights based on seasonality – potentially shorter during low season and longer during peak demand periods in Municipality of Nea Propontida.
Municipality of Nea Propontida Airbnb Cancellation Policy Trends Analysis (2026)
Super Strict 30 Days
4 listings
6.3% of total
Flexible
7 listings
10.9% of total
Moderate
7 listings
10.9% of total
Firm
37 listings
57.8% of total
Strict
9 listings
14.1% of total
Cancellation Policy Insights for Municipality of Nea Propontida
- The prevailing Airbnb cancellation policy trend in Municipality of Nea Propontida is Firm, used by 57.8% of listings.
- A majority (71.9%) of hosts in Municipality of Nea Propontida utilize Firm or Strict policies, indicating a market where hosts prioritize booking security.
Recommendations for Hosts
- Consider adopting a Firm policy to align with the 57.8% market standard in Municipality of Nea Propontida.
- Using a Strict policy might deter some guests, as only 14.1% of listings use it. Evaluate if potential revenue protection outweighs possible lower booking rates.
- Regularly review your cancellation policy against competitors and market demand shifts in Municipality of Nea Propontida.
Municipality of Nea Propontida STR Booking Lead Time Analysis (2026)
Average Booking Lead Time by Month
Booking Lead Time Insights for Municipality of Nea Propontida
- The overall average booking lead time for vacation rentals in Municipality of Nea Propontida is 71 days.
- Guests book furthest in advance for stays during March (average 123 days), likely coinciding with peak travel demand or local events.
- The shortest booking windows occur for stays in December (average 1 days), indicating more last-minute travel plans during this time.
- Seasonally, Summer (82 days avg.) sees the longest lead times, while Winter (1 days avg.) has the shortest, reflecting typical travel planning cycles.
Recommendations for Hosts
- Use the overall average lead time (71 days) as a baseline for your pricing and availability strategy in Municipality of Nea Propontida.
- For March stays, consider implementing length-of-stay discounts or slightly higher rates for bookings made less than 123 days out to capitalize on advance planning.
- During December, focus on last-minute booking availability and promotions, as guests book with very short notice (1 days avg.).
- Target marketing efforts for the Summer season well in advance (at least 82 days) to capture early planners.
- Monitor your own booking lead times against these Municipality of Nea Propontida averages to identify opportunities for dynamic pricing adjustments.
Popular & Essential Airbnb Amenities in Municipality of Nea Propontida (2026)
Amenity Prevalence
Amenity Insights for Municipality of Nea Propontida
- Essential amenities in Municipality of Nea Propontida that guests expect include: Wifi, Air conditioning. Lacking these (any) could significantly impact bookings.
- Popular amenities like TV, Refrigerator, Hair dryer are common but not universal. Offering these can provide a competitive edge.
Recommendations for Hosts
- Ensure your listing includes all essential amenities for Municipality of Nea Propontida: Wifi, Air conditioning.
- Prioritize adding missing essentials: Wifi, Air conditioning.
- Consider adding popular differentiators like TV or Refrigerator to increase appeal.
- Highlight unique or less common amenities you offer (e.g., hot tub, dedicated workspace, EV charger) in your listing description and photos.
- Regularly check competitor amenities in Municipality of Nea Propontida to stay competitive.
Municipality of Nea Propontida Airbnb Guest Demographics & Profile Analysis (2026)
Guest Profile Summary for Municipality of Nea Propontida
- The typical guest profile for Airbnb in Municipality of Nea Propontida consists of predominantly international visitors (97%), with top international origins including Germany, typically belonging to the Post-2000s (Gen Z/Alpha) group (50%), primarily speaking English or German.
- Domestic travelers account for 3.2% of guests.
- Key international markets include Bulgaria (21.8%) and Germany (16.9%).
- Top languages spoken are English (41.3%) followed by German (12.7%).
- A significant demographic segment is the Post-2000s (Gen Z/Alpha) group, representing 50% of guests.
Recommendations for Hosts
- Focus marketing internationally, particularly towards travelers from Germany.
- Tailor amenities and listing descriptions to appeal to the dominant Post-2000s (Gen Z/Alpha) demographic (e.g., highlight fast WiFi, smart home features, local guides).
- Highlight unique local experiences or amenities relevant to the primary guest profile.
- Consider seasonal promotions aligned with peak travel times for key origin markets.
Nearby Short-Term Rental Market Comparison
How does the Municipality of Nea Propontida Airbnb market stack up against its neighbors? Compare key performance metrics like average monthly revenue, ADR, and occupancy rates in surrounding areas to understand the broader regional STR landscape.
| Market | Active Properties | Monthly Revenue | Daily Rate | Avg. Occupancy |
|---|---|---|---|---|
| Skiathos Municipality | 68 | $2,488 | $456.24 | 48% |
| Achladias | 92 | $2,443 | $360.50 | 47% |
| Sporades | 22 | $2,433 | $326.24 | 53% |
| Klima | 20 | $2,023 | $348.92 | 40% |
| Panorama Municipal Unit | 11 | $1,735 | $285.42 | 36% |
| Kalyvia | 23 | $1,642 | $248.74 | 42% |
| Mourtero | 16 | $1,623 | $226.09 | 46% |
| Thermaikos Municipality | 23 | $1,600 | $193.25 | 45% |
| Myli | 52 | $1,580 | $228.03 | 44% |
| Νέα Μουδανιά | 18 | $1,572 | $193.08 | 46% |