La Barrita Airbnb Market Analysis 2026: Short Term Rental Data & Vacation Rental Statistics in Escuintla, Guatemala
Is Airbnb profitable in La Barrita in 2026? Explore comprehensive Airbnb analytics for La Barrita, Escuintla, Guatemala to uncover income potential. This 2026 STR market report for La Barrita, based on AirROI data from February 2025 to January 2026, reveals key trends in the niche market of 20 active listings.
Whether you're considering an Airbnb investment in La Barrita, optimizing your existing vacation rental, or exploring rental arbitrage opportunities, understanding the La Barrita Airbnb data is crucial. Leveraging the low regulation environment is key to maximizing your short term rental income potential. Let's dive into the specifics.
Key La Barrita Airbnb Performance Metrics Overview
Monthly Airbnb Revenue Variations & Income Potential in La Barrita (2026)
Understanding the monthly revenue variations for Airbnb listings in La Barrita is key to maximizing your short term rental income potential. Seasonality significantly impacts earnings. Our analysis, based on data from the past 12 months, shows that the peak revenue month for STRs in La Barrita is typically December, while October often presents the lowest earnings, highlighting opportunities for strategic pricing adjustments during shoulder and low seasons. Explore the typical Airbnb income in La Barrita across different performance tiers:
- Best-in-class properties (Top 10%) achieve $4,351+ monthly, often utilizing dynamic pricing and superior guest experiences.
- Strong performing properties (Top 25%) earn $2,793 or more, indicating effective management and desirable locations/amenities.
- Typical properties (Median) generate around $2,098 per month, representing the average market performance.
- Entry-level properties (Bottom 25%) see earnings around $1,454, often with potential for optimization.
Average Monthly Airbnb Earnings Trend in La Barrita
La Barrita Airbnb Occupancy Rate Trends (2026)
Maximize your bookings by understanding the La Barrita STR occupancy trends. Seasonal demand shifts significantly influence how often properties are booked. Typically, Aprilsees the highest demand (peak season occupancy), while October experiences the lowest (low season). Effective strategies, like adjusting minimum stays or offering promotions, can boost occupancy during slower periods. Here's how different property tiers perform in La Barrita:
- Best-in-class properties (Top 10%) achieve 60%+ occupancy, indicating high desirability and potentially optimized availability.
- Strong performing properties (Top 25%) maintain 49% or higher occupancy, suggesting good market fit and guest satisfaction.
- Typical properties (Median) have an occupancy rate around 37%.
- Entry-level properties (Bottom 25%) average 27% occupancy, potentially facing higher vacancy.
Average Monthly Occupancy Rate Trend in La Barrita
Average Daily Rate (ADR) Airbnb Trends in La Barrita (2026)
Effective short term rental pricing strategy in La Barrita involves understanding monthly ADR fluctuations. The Average Daily Rate (ADR) for Airbnb in La Barrita typically peaks in December and dips lowest during August. Leveraging Airbnb dynamic pricing tools or strategies based on this seasonality can significantly boost revenue. Here's a look at the typical nightly rates achieved:
- Best-in-class properties (Top 10%) command rates of $348+ per night, often due to premium features or locations.
- Strong performing properties (Top 25%) achieve nightly rates of $174 or more.
- Typical properties (Median) charge around $151 per night.
- Entry-level properties (Bottom 25%) earn around $140 per night.
Average Daily Rate (ADR) Trend by Month in La Barrita
Get Live La Barrita Market Intelligence 👇

Explore Real-time Analytics
Airbnb Seasonality Analysis & Trends in La Barrita (2026)
Peak Season (December, April, March)
- Revenue averages $3,911 per month
- Occupancy rates average 50.5%
- Daily rates average $226
Shoulder Season
- Revenue averages $2,172 per month
- Occupancy maintains around 38.9%
- Daily rates hold near $186
Low Season (August, September, October)
- Revenue drops to average $1,343 per month
- Occupancy decreases to average 25.5%
- Daily rates adjust to average $171
Seasonality Insights for La Barrita
- The Airbnb seasonality in La Barrita shows highly seasonal trends requiring careful strategy. While the sections above show seasonal averages, it's also insightful to look at the extremes:
- During the high season, the absolute peak month showcases La Barrita's highest earning potential, with monthly revenues capable of climbing to $4,653, occupancy reaching a high of 52.0%, and ADRs peaking at $260.
- Conversely, the slowest single month of the year, typically falling within the low season, marks the market's lowest point. In this month, revenue might dip to $890, occupancy could drop to 15.4%, and ADRs may adjust down to $159.
- Understanding both the seasonal averages and these monthly peaks and troughs in revenue, occupancy, and ADR is crucial for maximizing your Airbnb profit potential in La Barrita.
Seasonal Strategies for Maximizing Profit
- Peak Season: Maximize revenue through premium pricing and potentially longer minimum stays. Ensure high availability.
- Low Season: Offer competitive pricing, special promotions (e.g., extended stay discounts), and flexible cancellation policies. Target off-season travelers like remote workers or budget-conscious guests.
- Shoulder Seasons: Implement dynamic pricing that balances peak and low rates. Target weekend travelers or specific events. Offer slightly more flexible terms than peak season.
- Regularly analyze your own performance against these La Barrita seasonality benchmarks and adjust your pricing and availability strategy accordingly.
Best Areas for Airbnb Investment in La Barrita (2026)
Exploring the top neighborhoods for short-term rentals in La Barrita? This section highlights key areas, outlining why they are attractive for hosts and guests, along with notable local attractions. Consider these locations based on your target guest profile and investment strategy.
| Neighborhood / Area | Why Host Here? (Target Guests & Appeal) | Key Attractions & Landmarks |
|---|---|---|
| La Barrita Beach | A beautiful coastal area known for its warm waters and scenic views. Ideal for guests looking to relax on the beach or engage in water sports. | La Barrita Beach, Turtle Sanctuary, Water activities, Local seafood restaurants |
| Escuintla Central | The bustling central area of Escuintla, offering proximity to shops, cafes, and cultural landmarks. A great base for visitors exploring the city. | Central Plaza, Escuintla Cathedral, Local markets, Artisan shops |
| Mayan Ruins of Takalik Abaj | An important archaeological site that attracts history enthusiasts and tourists interested in Mayan culture. Great for educational stays and tours. | Takalik Abaj ruins, Guided tours, Local guides, Cultural experiences |
| Los volcanes | This area is known for its stunning volcanic landscapes, making it perfect for adventure seekers and nature lovers who enjoy hiking and outdoor activities. | Volcan de San Vicente, Hiking trails, Natural parks, Scenic views |
| Local Villages | Charming local villages near La Barrita provide a glimpse into Guatemalan culture and traditions. A unique experience for tourists looking to immerse themselves. | Traditional markets, Local workshops, Crafts and souvenirs, Cultural festivals |
| Escuintla Nature Park | A natural reserve offering hiking, bird watching, and relaxation amidst nature. Ideal for eco-tourism and families looking for outdoor fun. | Nature trails, Biodiversity, Picnic areas, Educational programs |
| Cultural Events Venues | Hosting various cultural events and festivals, this area attracts those interested in the local heritage and festivities. | Festivals, Concerts, Art exhibits, Cultural shows |
| Food and Wine Tour Areas | This area boasts a diverse culinary scene, perfect for foodies looking to explore local dishes and flavors. | Local cuisine, Wine tasting, Food festivals, Cooking classes |
Understanding Airbnb License Requirements & STR Laws in La Barrita (2026)
While La Barrita, Escuintla, Guatemala currently shows low STR regulations, specific Airbnb license requirements might still exist or change. Always verify the latest short term rental regulations and Airbnb license requirements directly with local government authorities for La Barrita to ensure full compliance before hosting.
(Source: AirROI data, 2026, finding no licensed listings among those analyzed)
Top Performing Airbnb Properties in La Barrita (2026)
Benchmark your potential! Explore examples of top-performing Airbnb properties in La Barritabased on Trailing Twelve Month (TTM) revenue. Analyze their characteristics, revenue, occupancy rate, and ADR to understand what drives success in this market.

Villas Iguana - Villa 1 Family, 5 rooms
Entire Place • 5 bedrooms
Iguana Villas - Villa 2 Family, 5 bedrooms
Entire Place • 5 bedrooms

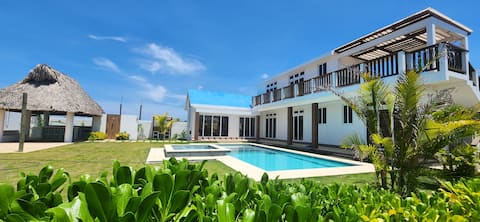
Seaside Chulamar house for 24 with large pool
Entire Place • 5 bedrooms

Iguana Villas - Villa 3 Petit, 2 Bedrooms
Entire Place • 2 bedrooms

olu' | Kalani love is celebrated here
Entire Place • 3 bedrooms
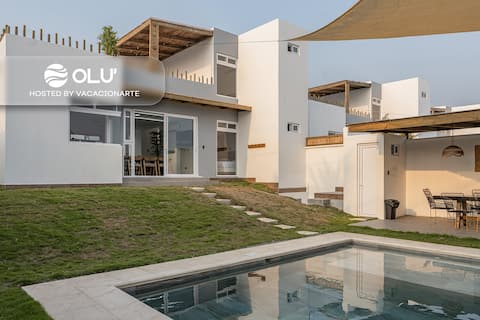
olu' | Ohana start the year stress-free
Entire Place • 3 bedrooms
Note: Performance varies based on location, size, amenities, seasonality, and management quality. Data reflects the past 12 months.
Top Performing Airbnb Hosts in La Barrita (2026)
Learn from the best! This table showcases top-performing Airbnb hosts in La Barrita based on the number of properties managed and estimated total revenue over the past year. Analyze their scale and performance metrics.
| Host Name | Properties | Grossing Revenue | Stay Reviews | Avg Rating |
|---|---|---|---|---|
| Villas Iguana | 6 | $225,429 | 344 | 4.79/5.0 |
| Vacacionartegt | 9 | $223,037 | 1409 | 4.69/5.0 |
| Sudicxa | 1 | $44,533 | 12 | 4.92/5.0 |
| Adamaris Vacacionarte | 3 | $39,865 | 464 | 4.76/5.0 |
| Maite | 1 | $12,562 | 33 | 4.82/5.0 |
Analyzing the strategies of top hosts, such as their property selection, pricing, and guest communication, can offer valuable lessons for optimizing your own Airbnb operations in La Barrita.
Dive Deeper: Advanced La Barrita STR Market Data (2026)
Ready to unlock more insights? AirROI provides access to advanced metrics and comprehensive Airbnb data for La Barrita. Explore detailed analytics beyond this report to refine your investment strategy, optimize pricing, and maximize your vacation rental profits.
Explore Advanced MetricsLa Barrita Short-Term Rental Market Composition (2026): Property & Room Types
Room Type Distribution
Property Type Distribution
Market Composition Insights for La Barrita
- The La Barrita Airbnb market composition is heavily skewed towards Entire Home/Apt listings, which make up 100% of the 20 active rentals. This indicates strong guest preference for privacy and space.
- Looking at the property type distribution in La Barrita, House properties are the most common (100%), reflecting the local real estate landscape.
- Houses represent a significant 100% portion, catering likely to families or larger groups.
La Barrita Airbnb Room Capacity Analysis (2026): Bedroom Distribution
Distribution of Listings by Number of Bedrooms
Room Capacity Insights for La Barrita
- The dominant room capacity in La Barrita is 3 bedrooms listings, making up 45% of the market. This suggests a strong demand for properties suitable for families or small groups.
- Together, 3 bedrooms and 2 bedrooms properties represent 80.0% of the active Airbnb listings in La Barrita, indicating a high concentration in these sizes.
- A significant 60.0% of listings offer 3+ bedrooms, catering to larger groups and families seeking more space in La Barrita.
La Barrita Vacation Rental Guest Capacity Trends (2026)
Distribution of Listings by Guest Capacity
Guest Capacity Insights for La Barrita
- The most common guest capacity trend in La Barrita vacation rentals is listings accommodating 8+ guests (80%). This suggests the primary traveler segment is likely larger groups.
- Properties designed for 8+ guests and 6 guests dominate the La Barrita STR market, accounting for 100.0% of listings.
- 100.0% of properties accommodate 6+ guests, serving the market segment for larger families or group travel in La Barrita.
- On average, properties in La Barrita are equipped to host 7.6 guests.
La Barrita Airbnb Booking Patterns (2026): Available vs. Booked Days
Available Days Distribution
Booked Days Distribution
Booking Pattern Insights for La Barrita
- The most common availability pattern in La Barrita falls within the 181-270 days range, representing 65% of listings. This suggests many properties have significant open periods on their calendars.
- Approximately 90.0% of listings show high availability (181+ days open annually), indicating potential for increased bookings or specific owner usage patterns.
- For booked days, the 91-180 days range is most frequent in La Barrita (65%), reflecting common guest stay durations or potential owner blocking patterns.
- A notable 10.0% of properties secure long booking periods (181+ days booked per year), highlighting successful long-term rental strategies or significant owner usage.
La Barrita Airbnb Minimum Stay Requirements Analysis
Distribution of Listings by Minimum Night Requirement
1 Night
19 listings
95% of total
2 Nights
1 listings
5% of total
Key Insights
- The most prevalent minimum stay requirement in La Barrita is 1 Night, adopted by 95% of listings. This highlights the market's preference for shorter, flexible bookings.
- A strong majority (100.0%) of the La Barrita Airbnb data shows acceptance of very short stays (1-2 nights), indicating a dynamic, high-turnover market.
Recommendations
- Align with the market by considering a 1 Night minimum stay, as 95% of La Barrita hosts use this setting.
- Adjust minimum nights based on seasonality – potentially shorter during low season and longer during peak demand periods in La Barrita.
La Barrita Airbnb Cancellation Policy Trends Analysis (2026)
Moderate
19 listings
95% of total
Firm
1 listings
5% of total
Cancellation Policy Insights for La Barrita
- The prevailing Airbnb cancellation policy trend in La Barrita is Moderate, used by 95% of listings.
- The market strongly favors guest-friendly terms, with 95.0% of listings offering Flexible or Moderate policies. This suggests guests in La Barrita may expect booking flexibility.
Recommendations for Hosts
- Consider adopting a Moderate policy to align with the 95% market standard in La Barrita.
- Regularly review your cancellation policy against competitors and market demand shifts in La Barrita.
La Barrita STR Booking Lead Time Analysis (2026)
Average Booking Lead Time by Month
Booking Lead Time Insights for La Barrita
- The overall average booking lead time for vacation rentals in La Barrita is 19 days.
- Guests book furthest in advance for stays during September (average 36 days), likely coinciding with peak travel demand or local events.
- The shortest booking windows occur for stays in February (average 9 days), indicating more last-minute travel plans during this time.
- Seasonally, Spring (22 days avg.) sees the longest lead times, while Winter (15 days avg.) has the shortest, reflecting typical travel planning cycles.
Recommendations for Hosts
- Use the overall average lead time (19 days) as a baseline for your pricing and availability strategy in La Barrita.
- For September stays, consider implementing length-of-stay discounts or slightly higher rates for bookings made less than 36 days out to capitalize on advance planning.
- During February, focus on last-minute booking availability and promotions, as guests book with very short notice (9 days avg.).
- Target marketing efforts for the Spring season well in advance (at least 22 days) to capture early planners.
- Monitor your own booking lead times against these La Barrita averages to identify opportunities for dynamic pricing adjustments.
Popular & Essential Airbnb Amenities in La Barrita (2026)
Amenity Prevalence
No amenities with partial availability (less than 100%) were found to display in the chart. All essential amenities might be present in all listings. Check insights below.
Amenity Insights for La Barrita
- Essential amenities in La Barrita that guests expect include: Beach access, Bed linens, Outdoor shower, Coffee maker, Kitchen, Cooking basics, BBQ grill, Sound system, Dishes and silverware, Microwave. Lacking these (any) could significantly impact bookings.
Recommendations for Hosts
- Ensure your listing includes all essential amenities for La Barrita: Beach access, Bed linens, Outdoor shower, Coffee maker, Kitchen, Cooking basics, BBQ grill, Sound system, Dishes and silverware, Microwave.
- Highlight unique or less common amenities you offer (e.g., hot tub, dedicated workspace, EV charger) in your listing description and photos.
- Regularly check competitor amenities in La Barrita to stay competitive.
La Barrita Airbnb Guest Demographics & Profile Analysis (2026)
Guest Profile Summary for La Barrita
- The typical guest profile for Airbnb in La Barrita consists of primarily domestic travelers (82%), often arriving from nearby Guatemala City, typically belonging to the Post-2000s (Gen Z/Alpha) group (50%), primarily speaking Spanish or English.
- Domestic travelers account for 82.1% of guests.
- Key international markets include Guatemala (82.1%) and United States (11.9%).
- Top languages spoken are Spanish (57.8%) followed by English (37.1%).
- A significant demographic segment is the Post-2000s (Gen Z/Alpha) group, representing 50% of guests.
Recommendations for Hosts
- Target domestic marketing efforts towards travelers from Guatemala City and Antigua Guatemala.
- Tailor amenities and listing descriptions to appeal to the dominant Post-2000s (Gen Z/Alpha) demographic (e.g., highlight fast WiFi, smart home features, local guides).
- Highlight unique local experiences or amenities relevant to the primary guest profile.
- Consider seasonal promotions aligned with peak travel times for key origin markets.
Nearby Short-Term Rental Market Comparison
How does the La Barrita Airbnb market stack up against its neighbors? Compare key performance metrics like average monthly revenue, ADR, and occupancy rates in surrounding areas to understand the broader regional STR landscape.
| Market | Active Properties | Monthly Revenue | Daily Rate | Avg. Occupancy |
|---|---|---|---|---|
| Municipio de Jicalapa | 11 | $3,708 | $371.37 | 27% |
| Municipio de El Congo | 40 | $3,371 | $325.78 | 37% |
| Santa Catarina Palopó | 52 | $2,910 | $240.56 | 40% |
| Municipio de Santa Isabel Ishuatán | 16 | $2,694 | $241.08 | 34% |
| Agua Escondida | 11 | $2,601 | $290.02 | 26% |
| Xanadu | 136 | $2,505 | $229.47 | 38% |
| Teotepeque | 12 | $2,463 | $233.38 | 36% |
| Municipio de San Luis Talpa | 31 | $2,400 | $257.96 | 32% |
| Cantón Planes de la Laguna | 11 | $2,364 | $287.05 | 36% |
| La Arenera | 17 | $2,212 | $291.58 | 25% |