San Marcos La Laguna Airbnb Market Analysis 2026: Short Term Rental Data & Vacation Rental Statistics in Sololá, Guatemala
Is Airbnb profitable in San Marcos La Laguna in 2026? Explore comprehensive Airbnb analytics for San Marcos La Laguna, Sololá, Guatemala to uncover income potential. This 2026 STR market report for San Marcos La Laguna, based on AirROI data from February 2025 to January 2026, reveals key trends in the market of 277 active listings.
Whether you're considering an Airbnb investment in San Marcos La Laguna, optimizing your existing vacation rental, or exploring rental arbitrage opportunities, understanding the San Marcos La Laguna Airbnb data is crucial. Leveraging the low regulation environment is key to maximizing your short term rental income potential. Let's dive into the specifics.
Key San Marcos La Laguna Airbnb Performance Metrics Overview
Monthly Airbnb Revenue Variations & Income Potential in San Marcos La Laguna (2026)
Understanding the monthly revenue variations for Airbnb listings in San Marcos La Laguna is key to maximizing your short term rental income potential. Seasonality significantly impacts earnings. Our analysis, based on data from the past 12 months, shows that the peak revenue month for STRs in San Marcos La Laguna is typically March, while September often presents the lowest earnings, highlighting opportunities for strategic pricing adjustments during shoulder and low seasons. Explore the typical Airbnb income in San Marcos La Laguna across different performance tiers:
- Best-in-class properties (Top 10%) achieve $3,832+ monthly, often utilizing dynamic pricing and superior guest experiences.
- Strong performing properties (Top 25%) earn $2,433 or more, indicating effective management and desirable locations/amenities.
- Typical properties (Median) generate around $1,129 per month, representing the average market performance.
- Entry-level properties (Bottom 25%) see earnings around $447, often with potential for optimization.
Average Monthly Airbnb Earnings Trend in San Marcos La Laguna
San Marcos La Laguna Airbnb Occupancy Rate Trends (2026)
Maximize your bookings by understanding the San Marcos La Laguna STR occupancy trends. Seasonal demand shifts significantly influence how often properties are booked. Typically, Februarysees the highest demand (peak season occupancy), while September experiences the lowest (low season). Effective strategies, like adjusting minimum stays or offering promotions, can boost occupancy during slower periods. Here's how different property tiers perform in San Marcos La Laguna:
- Best-in-class properties (Top 10%) achieve 80%+ occupancy, indicating high desirability and potentially optimized availability.
- Strong performing properties (Top 25%) maintain 64% or higher occupancy, suggesting good market fit and guest satisfaction.
- Typical properties (Median) have an occupancy rate around 42%.
- Entry-level properties (Bottom 25%) average 20% occupancy, potentially facing higher vacancy.
Average Monthly Occupancy Rate Trend in San Marcos La Laguna
Average Daily Rate (ADR) Airbnb Trends in San Marcos La Laguna (2026)
Effective short term rental pricing strategy in San Marcos La Laguna involves understanding monthly ADR fluctuations. The Average Daily Rate (ADR) for Airbnb in San Marcos La Laguna typically peaks in December and dips lowest during August. Leveraging Airbnb dynamic pricing tools or strategies based on this seasonality can significantly boost revenue. Here's a look at the typical nightly rates achieved:
- Best-in-class properties (Top 10%) command rates of $220+ per night, often due to premium features or locations.
- Strong performing properties (Top 25%) achieve nightly rates of $137 or more.
- Typical properties (Median) charge around $78 per night.
- Entry-level properties (Bottom 25%) earn around $47 per night.
Average Daily Rate (ADR) Trend by Month in San Marcos La Laguna
Get Live San Marcos La Laguna Market Intelligence 👇

Explore Real-time Analytics
Airbnb Seasonality Analysis & Trends in San Marcos La Laguna (2026)
Peak Season (March, February, April)
- Revenue averages $2,206 per month
- Occupancy rates average 56.9%
- Daily rates average $120
Shoulder Season
- Revenue averages $1,693 per month
- Occupancy maintains around 41.8%
- Daily rates hold near $117
Low Season (June, September, October)
- Revenue drops to average $1,364 per month
- Occupancy decreases to average 33.6%
- Daily rates adjust to average $116
Seasonality Insights for San Marcos La Laguna
- The Airbnb seasonality in San Marcos La Laguna shows moderate seasonality with distinct peak and low periods. While the sections above show seasonal averages, it's also insightful to look at the extremes:
- During the high season, the absolute peak month showcases San Marcos La Laguna's highest earning potential, with monthly revenues capable of climbing to $2,363, occupancy reaching a high of 62.5%, and ADRs peaking at $122.
- Conversely, the slowest single month of the year, typically falling within the low season, marks the market's lowest point. In this month, revenue might dip to $1,214, occupancy could drop to 32.4%, and ADRs may adjust down to $111.
- Understanding both the seasonal averages and these monthly peaks and troughs in revenue, occupancy, and ADR is crucial for maximizing your Airbnb profit potential in San Marcos La Laguna.
Seasonal Strategies for Maximizing Profit
- Peak Season: Maximize revenue through premium pricing and potentially longer minimum stays. Ensure high availability.
- Low Season: Offer competitive pricing, special promotions (e.g., extended stay discounts), and flexible cancellation policies. Target off-season travelers like remote workers or budget-conscious guests.
- Shoulder Seasons: Implement dynamic pricing that balances peak and low rates. Target weekend travelers or specific events. Offer slightly more flexible terms than peak season.
- Regularly analyze your own performance against these San Marcos La Laguna seasonality benchmarks and adjust your pricing and availability strategy accordingly.
Best Areas for Airbnb Investment in San Marcos La Laguna (2026)
Exploring the top neighborhoods for short-term rentals in San Marcos La Laguna? This section highlights key areas, outlining why they are attractive for hosts and guests, along with notable local attractions. Consider these locations based on your target guest profile and investment strategy.
| Neighborhood / Area | Why Host Here? (Target Guests & Appeal) | Key Attractions & Landmarks |
|---|---|---|
| Lakefront Area | Beautiful views of Lake Atitlán and direct access to water activities. This area is popular among tourists looking for relaxation and scenic beauty. | Lake Atitlán, Sunsets over the lake, Kayaking, Boat tours to nearby villages |
| Central San Marcos | Centrally located with easy access to local shops, restaurants, and transportation. Ideal for those who want to explore the vibrant local culture. | Local market, Restaurants, Cafes, San Marcos Church, Artisan shops |
| Panjachel | A nearby town with more tourists, easily accessible from San Marcos. Known for its bustling atmosphere and variety of services. | Panjachel Market, Boat rides to San Pedro, Natural Reserve, Cafes and nightlife |
| San Pedro La Laguna | Popular for backpackers and travelers looking for adventure, with many hostels and local experiences. | San Pedro Volcano, Hiking, Cultural experiences, Local restaurants |
| San Juan La Laguna | Famous for its community-driven tourism and arts and crafts. A great place for travelers seeking authentic cultural experiences. | Local art galleries, Cultural workshops, Traditional textile weaving, Lake access |
| Tzununá | A quieter village ideal for those looking for peace and tranquility while still being close to tourist activities. | Scenic views, Hiking trails, Natural surroundings, Local interactions |
| Layera | Less touristy and offers a more local experience. Great for those wanting to escape the crowds and enjoy nature. | Serene nature, Local village life, Tranquility, Simple guesthouses |
| Caminando de los Árboles | A scenic hiking area that attracts nature lovers and travelers interested in ecological tourism. | Hiking trails, Bird watching, Nature photography, Stunning views of the lake and mountains |
Understanding Airbnb License Requirements & STR Laws in San Marcos La Laguna (2026)
While San Marcos La Laguna, Sololá, Guatemala currently shows low STR regulations, specific Airbnb license requirements might still exist or change. Always verify the latest short term rental regulations and Airbnb license requirements directly with local government authorities for San Marcos La Laguna to ensure full compliance before hosting.
(Source: AirROI data, 2026, finding no licensed listings among those analyzed)
Top Performing Airbnb Properties in San Marcos La Laguna (2026)
Benchmark your potential! Explore examples of top-performing Airbnb properties in San Marcos La Lagunabased on Trailing Twelve Month (TTM) revenue. Analyze their characteristics, revenue, occupancy rate, and ADR to understand what drives success in this market.
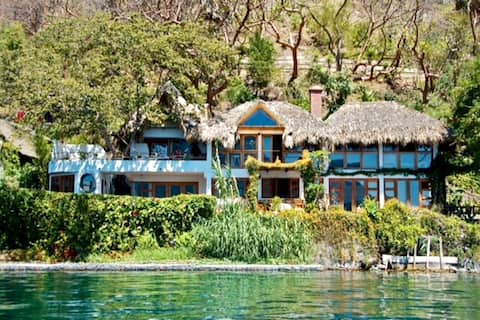
Casa Paloma - Lakefront - Waterfalls - Gardens
Entire Place • 4 bedrooms

NEW! Jacuzzi, lake-access luxury
Entire Place • 2 bedrooms

Lakefront 3 bedroom Villa with heated pool&hot tub
Entire Place • 3 bedrooms

Villa Close to the sky
Entire Place • 2 bedrooms

Luxury Lakefront Retreat at Casa Floresta
Entire Place • 5 bedrooms

A-Frame Madera • Stunning Views • Tranquil Escape
Entire Place • 1 bedroom
Note: Performance varies based on location, size, amenities, seasonality, and management quality. Data reflects the past 12 months.
Top Performing Airbnb Hosts in San Marcos La Laguna (2026)
Learn from the best! This table showcases top-performing Airbnb hosts in San Marcos La Laguna based on the number of properties managed and estimated total revenue over the past year. Analyze their scale and performance metrics.
| Host Name | Properties | Grossing Revenue | Stay Reviews | Avg Rating |
|---|---|---|---|---|
| Alas Del Angel | 11 | $386,811 | 1186 | 4.92/5.0 |
| Casa | 6 | $378,029 | 782 | 4.81/5.0 |
| Dar | 3 | $184,450 | 839 | 4.91/5.0 |
| Sergio | 4 | $184,431 | 891 | 4.82/5.0 |
| Daniel | 9 | $177,575 | 121 | 4.90/5.0 |
| Harsimar | 8 | $170,309 | 466 | 4.65/5.0 |
| Andrea | 4 | $143,304 | 920 | 4.77/5.0 |
| Alejandro | 10 | $140,690 | 311 | 4.75/5.0 |
| Sevonne | 4 | $105,848 | 590 | 4.83/5.0 |
| Michelle | 8 | $89,946 | 609 | 4.89/5.0 |
Analyzing the strategies of top hosts, such as their property selection, pricing, and guest communication, can offer valuable lessons for optimizing your own Airbnb operations in San Marcos La Laguna.
Dive Deeper: Advanced San Marcos La Laguna STR Market Data (2026)
Ready to unlock more insights? AirROI provides access to advanced metrics and comprehensive Airbnb data for San Marcos La Laguna. Explore detailed analytics beyond this report to refine your investment strategy, optimize pricing, and maximize your vacation rental profits.
Explore Advanced MetricsSan Marcos La Laguna Short-Term Rental Market Composition (2026): Property & Room Types
Room Type Distribution
Property Type Distribution
Market Composition Insights for San Marcos La Laguna
- The San Marcos La Laguna Airbnb market composition is heavily skewed towards Entire Home/Apt listings, which make up 65% of the 277 active rentals. This indicates strong guest preference for privacy and space.
- However, a notable 34.7% share for Private Rooms suggests opportunities for budget-conscious travelers or hosts renting out spare rooms.
- Looking at the property type distribution in San Marcos La Laguna, House properties are the most common (35%), reflecting the local real estate landscape.
- Houses represent a significant 35% portion, catering likely to families or larger groups.
- The presence of 21.3% Hotel/Boutique listings indicates integration with traditional hospitality.
- Smaller segments like others, unique stays (combined 3.9%) offer potential for unique stay experiences.
San Marcos La Laguna Airbnb Room Capacity Analysis (2026): Bedroom Distribution
Distribution of Listings by Number of Bedrooms
Room Capacity Insights for San Marcos La Laguna
- The dominant room capacity in San Marcos La Laguna is 1 bedroom listings, making up 70.4% of the market. This suggests a strong demand for properties suitable for couples or solo travelers.
- Together, 1 bedroom and 2 bedrooms properties represent 81.6% of the active Airbnb listings in San Marcos La Laguna, indicating a high concentration in these sizes.
- With over half the market (70.4%) consisting of studios or 1-bedroom units, San Marcos La Laguna is particularly well-suited for individuals or couples.
- Listings with 3+ bedrooms (7.2%) represent a smaller niche, potentially indicating an underserved market for larger group accommodations in San Marcos La Laguna.
San Marcos La Laguna Vacation Rental Guest Capacity Trends (2026)
Distribution of Listings by Guest Capacity
Guest Capacity Insights for San Marcos La Laguna
- The most common guest capacity trend in San Marcos La Laguna vacation rentals is listings accommodating 2 guests (46.6%). This suggests the primary traveler segment is likely couples or solo travelers.
- Properties designed for 2 guests and 4 guests dominate the San Marcos La Laguna STR market, accounting for 61.4% of listings.
- A significant 47.0% of listings cater specifically to 1-2 guests, highlighting strong demand from couples and solo travelers in San Marcos La Laguna.
- On average, properties in San Marcos La Laguna are equipped to host 2.8 guests.
San Marcos La Laguna Airbnb Booking Patterns (2026): Available vs. Booked Days
Available Days Distribution
Booked Days Distribution
Booking Pattern Insights for San Marcos La Laguna
- The most common availability pattern in San Marcos La Laguna falls within the 271-366 days range, representing 52% of listings. This suggests many properties have significant open periods on their calendars.
- Approximately 77.3% of listings show high availability (181+ days open annually), indicating potential for increased bookings or specific owner usage patterns.
- For booked days, the 31-90 days range is most frequent in San Marcos La Laguna (31.4%), reflecting common guest stay durations or potential owner blocking patterns.
- A notable 23.1% of properties secure long booking periods (181+ days booked per year), highlighting successful long-term rental strategies or significant owner usage.
San Marcos La Laguna Airbnb Minimum Stay Requirements Analysis
Distribution of Listings by Minimum Night Requirement
1 Night
129 listings
46.6% of total
2 Nights
60 listings
21.7% of total
3 Nights
15 listings
5.4% of total
4-6 Nights
4 listings
1.4% of total
7-29 Nights
5 listings
1.8% of total
30+ Nights
64 listings
23.1% of total
Key Insights
- The most prevalent minimum stay requirement in San Marcos La Laguna is 1 Night, adopted by 46.6% of listings. This highlights the market's preference for shorter, flexible bookings.
- A strong majority (68.3%) of the San Marcos La Laguna Airbnb data shows acceptance of very short stays (1-2 nights), indicating a dynamic, high-turnover market.
- A significant segment (23.1%) caters to monthly stays (30+ nights) in San Marcos La Laguna, pointing to opportunities in the extended-stay market.
Recommendations
- Align with the market by considering a 1 Night minimum stay, as 46.6% of San Marcos La Laguna hosts use this setting.
- Explore offering discounts for stays of 30+ nights to attract the 23.1% of the market seeking extended stays.
- Adjust minimum nights based on seasonality – potentially shorter during low season and longer during peak demand periods in San Marcos La Laguna.
San Marcos La Laguna Airbnb Cancellation Policy Trends Analysis (2026)
Super Strict 30 Days
8 listings
2.9% of total
Limited
3 listings
1.1% of total
Flexible
46 listings
16.8% of total
Moderate
32 listings
11.7% of total
Firm
155 listings
56.8% of total
Strict
29 listings
10.6% of total
Cancellation Policy Insights for San Marcos La Laguna
- The prevailing Airbnb cancellation policy trend in San Marcos La Laguna is Firm, used by 56.8% of listings.
- A majority (67.4%) of hosts in San Marcos La Laguna utilize Firm or Strict policies, indicating a market where hosts prioritize booking security.
Recommendations for Hosts
- Consider adopting a Firm policy to align with the 56.8% market standard in San Marcos La Laguna.
- Using a Strict policy might deter some guests, as only 10.6% of listings use it. Evaluate if potential revenue protection outweighs possible lower booking rates.
- Regularly review your cancellation policy against competitors and market demand shifts in San Marcos La Laguna.
San Marcos La Laguna STR Booking Lead Time Analysis (2026)
Average Booking Lead Time by Month
Booking Lead Time Insights for San Marcos La Laguna
- The overall average booking lead time for vacation rentals in San Marcos La Laguna is 39 days.
- Guests book furthest in advance for stays during January (average 52 days), likely coinciding with peak travel demand or local events.
- The shortest booking windows occur for stays in June (average 24 days), indicating more last-minute travel plans during this time.
- Seasonally, Winter (51 days avg.) sees the longest lead times, while Summer (28 days avg.) has the shortest, reflecting typical travel planning cycles.
Recommendations for Hosts
- Use the overall average lead time (39 days) as a baseline for your pricing and availability strategy in San Marcos La Laguna.
- For January stays, consider implementing length-of-stay discounts or slightly higher rates for bookings made less than 52 days out to capitalize on advance planning.
- Target marketing efforts for the Winter season well in advance (at least 51 days) to capture early planners.
- Monitor your own booking lead times against these San Marcos La Laguna averages to identify opportunities for dynamic pricing adjustments.
Popular & Essential Airbnb Amenities in San Marcos La Laguna (2026)
Amenity Prevalence
Amenity Insights for San Marcos La Laguna
- Essential amenities in San Marcos La Laguna that guests expect include: Wifi. Lacking these (this) could significantly impact bookings.
- Popular amenities like Kitchen, Hot water, Essentials are common but not universal. Offering these can provide a competitive edge.
Recommendations for Hosts
- Ensure your listing includes all essential amenities for San Marcos La Laguna: Wifi.
- Prioritize adding missing essentials: Wifi.
- Consider adding popular differentiators like Kitchen or Hot water to increase appeal.
- Highlight unique or less common amenities you offer (e.g., hot tub, dedicated workspace, EV charger) in your listing description and photos.
- Regularly check competitor amenities in San Marcos La Laguna to stay competitive.
San Marcos La Laguna Airbnb Guest Demographics & Profile Analysis (2026)
Guest Profile Summary for San Marcos La Laguna
- The typical guest profile for Airbnb in San Marcos La Laguna consists of predominantly international visitors (93%), with top international origins including Guatemala, typically belonging to the Post-2000s (Gen Z/Alpha) group (50%), primarily speaking English or Spanish.
- Domestic travelers account for 7.3% of guests.
- Key international markets include United States (49.3%) and Guatemala (7.3%).
- Top languages spoken are English (48.2%) followed by Spanish (24.9%).
- A significant demographic segment is the Post-2000s (Gen Z/Alpha) group, representing 50% of guests.
Recommendations for Hosts
- Focus marketing internationally, particularly towards travelers from Guatemala.
- Tailor amenities and listing descriptions to appeal to the dominant Post-2000s (Gen Z/Alpha) demographic (e.g., highlight fast WiFi, smart home features, local guides).
- Highlight unique local experiences or amenities relevant to the primary guest profile.
- Consider seasonal promotions aligned with peak travel times for key origin markets.
Nearby Short-Term Rental Market Comparison
How does the San Marcos La Laguna Airbnb market stack up against its neighbors? Compare key performance metrics like average monthly revenue, ADR, and occupancy rates in surrounding areas to understand the broader regional STR landscape.
| Market | Active Properties | Monthly Revenue | Daily Rate | Avg. Occupancy |
|---|---|---|---|---|
| Santa Catarina Palopó | 52 | $2,910 | $240.56 | 40% |
| Agua Escondida | 11 | $2,601 | $290.02 | 26% |
| La Barrita | 20 | $2,273 | $196.60 | 38% |
| Chulamar | 37 | $2,147 | $323.81 | 26% |
| San Jorge La Laguna | 24 | $2,118 | $205.66 | 40% |
| San Francisco Menéndez | 14 | $1,953 | $220.27 | 30% |
| Tzununá | 37 | $1,830 | $144.48 | 45% |
| Santa Cruz La Laguna | 76 | $1,737 | $131.69 | 46% |
| Puerto Quetzal | 41 | $1,680 | $301.06 | 24% |
| Chiquimulilla | 13 | $1,638 | $250.50 | 19% |