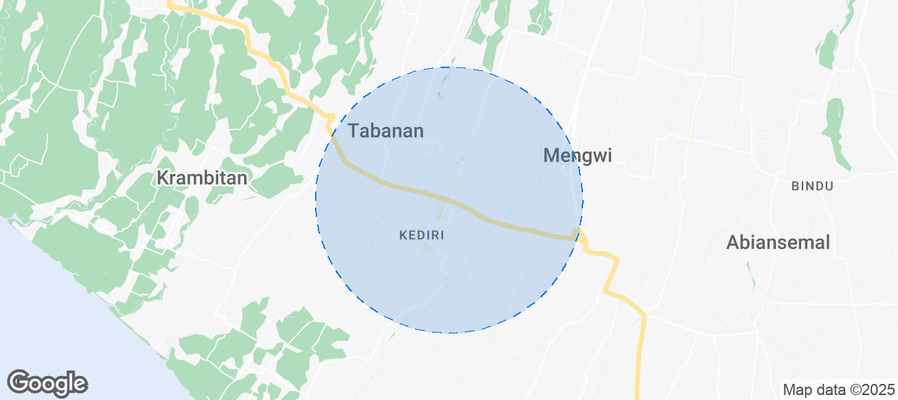
Kediri Airbnb Market Analysis 2026: Short Term Rental Data & Vacation Rental Statistics in Bali, Indonesia
Is Airbnb profitable in Kediri in 2026? Explore comprehensive Airbnb analytics for Kediri, Bali, Indonesia to uncover income potential. This 2026 STR market report for Kediri, based on AirROI data from February 2025 to January 2026, reveals key trends in the niche market of 43 active listings.
Whether you're considering an Airbnb investment in Kediri, optimizing your existing vacation rental, or exploring rental arbitrage opportunities, understanding the Kediri Airbnb data is crucial. Leveraging the low regulation environment is key to maximizing your short term rental income potential. Let's dive into the specifics.
Key Kediri Airbnb Performance Metrics Overview
Monthly Airbnb Revenue Variations & Income Potential in Kediri (2026)
Understanding the monthly revenue variations for Airbnb listings in Kediri is key to maximizing your short term rental income potential. Seasonality significantly impacts earnings. Our analysis, based on data from the past 12 months, shows that the peak revenue month for STRs in Kediri is typically August, while May often presents the lowest earnings, highlighting opportunities for strategic pricing adjustments during shoulder and low seasons. Explore the typical Airbnb income in Kediri across different performance tiers:
- Best-in-class properties (Top 10%) achieve $2,838+ monthly, often utilizing dynamic pricing and superior guest experiences.
- Strong performing properties (Top 25%) earn $1,601 or more, indicating effective management and desirable locations/amenities.
- Typical properties (Median) generate around $720 per month, representing the average market performance.
- Entry-level properties (Bottom 25%) see earnings around $313, often with potential for optimization.
Average Monthly Airbnb Earnings Trend in Kediri
Kediri Airbnb Occupancy Rate Trends (2026)
Maximize your bookings by understanding the Kediri STR occupancy trends. Seasonal demand shifts significantly influence how often properties are booked. Typically, Augustsees the highest demand (peak season occupancy), while May experiences the lowest (low season). Effective strategies, like adjusting minimum stays or offering promotions, can boost occupancy during slower periods. Here's how different property tiers perform in Kediri:
- Best-in-class properties (Top 10%) achieve 78%+ occupancy, indicating high desirability and potentially optimized availability.
- Strong performing properties (Top 25%) maintain 57% or higher occupancy, suggesting good market fit and guest satisfaction.
- Typical properties (Median) have an occupancy rate around 38%.
- Entry-level properties (Bottom 25%) average 20% occupancy, potentially facing higher vacancy.
Average Monthly Occupancy Rate Trend in Kediri
Average Daily Rate (ADR) Airbnb Trends in Kediri (2026)
Effective short term rental pricing strategy in Kediri involves understanding monthly ADR fluctuations. The Average Daily Rate (ADR) for Airbnb in Kediri typically peaks in January and dips lowest during October. Leveraging Airbnb dynamic pricing tools or strategies based on this seasonality can significantly boost revenue. Here's a look at the typical nightly rates achieved:
- Best-in-class properties (Top 10%) command rates of $209+ per night, often due to premium features or locations.
- Strong performing properties (Top 25%) achieve nightly rates of $144 or more.
- Typical properties (Median) charge around $108 per night.
- Entry-level properties (Bottom 25%) earn around $46 per night.
Average Daily Rate (ADR) Trend by Month in Kediri
Get Live Kediri Market Intelligence 👇
Explore Real-time Analytics
Airbnb Seasonality Analysis & Trends in Kediri (2026)
Peak Season (August, September, November)
- Revenue averages $1,897 per month
- Occupancy rates average 48.6%
- Daily rates average $110
Shoulder Season
- Revenue averages $1,249 per month
- Occupancy maintains around 37.4%
- Daily rates hold near $114
Low Season (March, April, May)
- Revenue drops to average $504 per month
- Occupancy decreases to average 38.7%
- Daily rates adjust to average $112
Seasonality Insights for Kediri
- The Airbnb seasonality in Kediri shows highly seasonal trends requiring careful strategy. While the sections above show seasonal averages, it's also insightful to look at the extremes:
- During the high season, the absolute peak month showcases Kediri's highest earning potential, with monthly revenues capable of climbing to $2,177, occupancy reaching a high of 53.1%, and ADRs peaking at $117.
- Conversely, the slowest single month of the year, typically falling within the low season, marks the market's lowest point. In this month, revenue might dip to $415, occupancy could drop to 19.7%, and ADRs may adjust down to $110.
- Understanding both the seasonal averages and these monthly peaks and troughs in revenue, occupancy, and ADR is crucial for maximizing your Airbnb profit potential in Kediri.
Seasonal Strategies for Maximizing Profit
- Peak Season: Maximize revenue through premium pricing and potentially longer minimum stays. Ensure high availability.
- Low Season: Offer competitive pricing, special promotions (e.g., extended stay discounts), and flexible cancellation policies. Target off-season travelers like remote workers or budget-conscious guests.
- Shoulder Seasons: Implement dynamic pricing that balances peak and low rates. Target weekend travelers or specific events. Offer slightly more flexible terms than peak season.
- Regularly analyze your own performance against these Kediri seasonality benchmarks and adjust your pricing and availability strategy accordingly.
Best Areas for Airbnb Investment in Kediri (2026)
Exploring the top neighborhoods for short-term rentals in Kediri? This section highlights key areas, outlining why they are attractive for hosts and guests, along with notable local attractions. Consider these locations based on your target guest profile and investment strategy.
| Neighborhood / Area | Why Host Here? (Target Guests & Appeal) | Key Attractions & Landmarks |
|---|---|---|
| Kuta | Famous for its surf beaches, vibrant nightlife, and close proximity to the airport, Kuta is a hotspot for tourists seeking sun and fun. | Kuta Beach, Waterbom Bali, Beachwalk Shopping Center, Ground Zero Memorial, Kerobokan Beach |
| Seminyak | Known for its upscale beach clubs, fine dining, and trendy boutiques, Seminyak attracts affluent travelers looking for a stylish experience. | Seminyak Beach, La Plancha Beach Bar, Eat Street, Petitenget Temple, Ku De Ta |
| Ubud | The cultural heart of Bali, Ubud is famous for its art, rice paddies, and yoga retreats, appealing to wellness tourists and nature lovers. | Ubud Monkey Forest, Tegallalang Rice Terraces, Ubud Art Market, Puri Saren Royal Palace, Tirta Empul Temple |
| Canggu | A trendy area popular among digital nomads and surfers, Canggu offers a laid-back vibe with a variety of cafes, coworking spaces, and surf breaks. | Canggu Beach, Echo Beach, Batu Bolong Beach, Finns Recreation Club, Deus Ex Machina |
| Nusa Dua | Known for its luxury resorts and pristine beaches, Nusa Dua is attractive to families and honeymooners seeking relaxation and pampering. | Nusa Dua Beach, Waterblow, Geger Beach, Bali Collection Shopping Center, Pasifika Museum |
| Jimbaran | Famous for its seafood restaurants on the beach, Jimbaran offers a more relaxed atmosphere with beautiful sunsets, perfect for romantic getaways. | Jimbaran Bay, Jimbaran Beach, Bali Seafood Grill, Jenggala Keramik, Pura Ulun Siwi Temple |
| Sanur | A peaceful coastal town with a charming laid-back vibe, Sanur is ideal for families and older tourists looking for a quiet beach experience. | Sanur Beach, Le Mayeur Museum, Matahari Terbit Beach, Bali Seawalker, Serangan Island |
| Amed | Known for its diving spots and scenic views, Amed is the perfect destination for those looking to explore Bali's underwater beauty. | Amed Beach, Japanese Shipwreck, Tulamben, Amed Dive Center, Mount Agung View |
Understanding Airbnb License Requirements & STR Laws in Kediri (2026)
While Kediri, Bali, Indonesia currently shows low STR regulations, specific Airbnb license requirements might still exist or change. Always verify the latest short term rental regulations and Airbnb license requirements directly with local government authorities for Kediri to ensure full compliance before hosting.
(Source: AirROI data, 2026, finding no licensed listings among those analyzed)
Top Performing Airbnb Properties in Kediri (2026)
Benchmark your potential! Explore examples of top-performing Airbnb properties in Kediribased on Trailing Twelve Month (TTM) revenue. Analyze their characteristics, revenue, occupancy rate, and ADR to understand what drives success in this market.

NEW 6BR Villa Rice Field View in Kaba Kaba
Entire Place • 6 bedrooms

Pleasant 3BR Tabanan Villa w/ Pool & Paddy Views
Entire Place • 3 bedrooms

NEW! Kaya Kedungu - 3BR Villa in Kedungu
Entire Place • 3 bedrooms

Villa Palmara 1BR•Kedungu beach with private pool
Entire Place • 1 bedroom

Hidden Gem in Kaba-Kaba Private Stylish 2BR Villa
Entire Place • 2 bedrooms

Natural, warm, jungle villa
Entire Place • 2 bedrooms
Note: Performance varies based on location, size, amenities, seasonality, and management quality. Data reflects the past 12 months.
Top Performing Airbnb Hosts in Kediri (2026)
Learn from the best! This table showcases top-performing Airbnb hosts in Kediri based on the number of properties managed and estimated total revenue over the past year. Analyze their scale and performance metrics.
| Host Name | Properties | Grossing Revenue | Stay Reviews | Avg Rating |
|---|---|---|---|---|
| Listings Bali | 8 | $78,673 | 65 | 4.83/5.0 |
| Daniel Marcel | 1 | $58,091 | 10 | 5.00/5.0 |
| Anak Agung Gede Wahyu | 1 | $27,467 | 13 | 4.92/5.0 |
| Labyrinth | 2 | $21,041 | 18 | 4.84/5.0 |
| Delima Housing | 1 | $17,249 | 31 | 4.94/5.0 |
| Tasvan Villas | 1 | $16,775 | 16 | 4.50/5.0 |
| Tini | 1 | $16,273 | 16 | 4.94/5.0 |
| Yoga | 6 | $14,870 | 172 | 4.92/5.0 |
| Edgar | 1 | $12,523 | 66 | 4.98/5.0 |
| Diola Villas Bali | 1 | $12,114 | 8 | 5.00/5.0 |
Analyzing the strategies of top hosts, such as their property selection, pricing, and guest communication, can offer valuable lessons for optimizing your own Airbnb operations in Kediri.
Dive Deeper: Advanced Kediri STR Market Data (2026)
Ready to unlock more insights? AirROI provides access to advanced metrics and comprehensive Airbnb data for Kediri. Explore detailed analytics beyond this report to refine your investment strategy, optimize pricing, and maximize your vacation rental profits.
Explore Advanced MetricsKediri Short-Term Rental Market Composition (2026): Property & Room Types
Room Type Distribution
Property Type Distribution
Market Composition Insights for Kediri
- The Kediri Airbnb market composition is heavily skewed towards Entire Home/Apt listings, which make up 86% of the 43 active rentals. This indicates strong guest preference for privacy and space.
- Looking at the property type distribution in Kediri, House properties are the most common (90.7%), reflecting the local real estate landscape.
- Houses represent a significant 90.7% portion, catering likely to families or larger groups.
- Smaller segments like hotel/boutique (combined 2.3%) offer potential for unique stay experiences.
Kediri Airbnb Room Capacity Analysis (2026): Bedroom Distribution
Distribution of Listings by Number of Bedrooms
Room Capacity Insights for Kediri
- The dominant room capacity in Kediri is 3 bedrooms listings, making up 32.6% of the market. This suggests a strong demand for properties suitable for families or small groups.
- Together, 3 bedrooms and 2 bedrooms properties represent 62.8% of the active Airbnb listings in Kediri, indicating a high concentration in these sizes.
- A significant 39.6% of listings offer 3+ bedrooms, catering to larger groups and families seeking more space in Kediri.
Kediri Vacation Rental Guest Capacity Trends (2026)
Distribution of Listings by Guest Capacity
Guest Capacity Insights for Kediri
- The most common guest capacity trend in Kediri vacation rentals is listings accommodating 6 guests (32.6%). This suggests the primary traveler segment is likely larger groups.
- Properties designed for 6 guests and 4 guests dominate the Kediri STR market, accounting for 60.5% of listings.
- 39.6% of properties accommodate 6+ guests, serving the market segment for larger families or group travel in Kediri.
- On average, properties in Kediri are equipped to host 4.1 guests.
Kediri Airbnb Booking Patterns (2026): Available vs. Booked Days
Available Days Distribution
Booked Days Distribution
Booking Pattern Insights for Kediri
- The most common availability pattern in Kediri falls within the 271-366 days range, representing 69.8% of listings. This suggests many properties have significant open periods on their calendars.
- Approximately 97.7% of listings show high availability (181+ days open annually), indicating potential for increased bookings or specific owner usage patterns.
- For booked days, the 31-90 days range is most frequent in Kediri (39.5%), reflecting common guest stay durations or potential owner blocking patterns.
- A notable 4.7% of properties secure long booking periods (181+ days booked per year), highlighting successful long-term rental strategies or significant owner usage.
Kediri Airbnb Minimum Stay Requirements Analysis
Distribution of Listings by Minimum Night Requirement
1 Night
17 listings
39.5% of total
2 Nights
5 listings
11.6% of total
4-6 Nights
1 listings
2.3% of total
7-29 Nights
6 listings
14% of total
30+ Nights
14 listings
32.6% of total
Key Insights
- The most prevalent minimum stay requirement in Kediri is 1 Night, adopted by 39.5% of listings. This highlights the market's preference for shorter, flexible bookings.
- A significant segment (32.6%) caters to monthly stays (30+ nights) in Kediri, pointing to opportunities in the extended-stay market.
Recommendations
- Align with the market by considering a 1 Night minimum stay, as 39.5% of Kediri hosts use this setting.
- Explore offering discounts for stays of 30+ nights to attract the 32.6% of the market seeking extended stays.
- Adjust minimum nights based on seasonality – potentially shorter during low season and longer during peak demand periods in Kediri.
Kediri Airbnb Cancellation Policy Trends Analysis (2026)
Super Strict 30 Days
3 listings
7% of total
Limited
1 listings
2.3% of total
Flexible
11 listings
25.6% of total
Moderate
8 listings
18.6% of total
Firm
5 listings
11.6% of total
Strict
15 listings
34.9% of total
Cancellation Policy Insights for Kediri
- The prevailing Airbnb cancellation policy trend in Kediri is Strict, used by 34.9% of listings.
- There's a relatively balanced mix between guest-friendly (44.2%) and stricter (46.5%) policies, offering choices for different guest needs.
Recommendations for Hosts
- Consider adopting a Strict policy to align with the 34.9% market standard in Kediri.
- With 34.9% using Strict terms, this is a viable option in Kediri, particularly for high-value properties or during peak demand periods.
- Regularly review your cancellation policy against competitors and market demand shifts in Kediri.
Kediri STR Booking Lead Time Analysis (2026)
Average Booking Lead Time by Month
Booking Lead Time Insights for Kediri
- The overall average booking lead time for vacation rentals in Kediri is 25 days.
- Guests book furthest in advance for stays during September (average 42 days), likely coinciding with peak travel demand or local events.
- The shortest booking windows occur for stays in December (average 11 days), indicating more last-minute travel plans during this time.
- Seasonally, Spring (31 days avg.) sees the longest lead times, while Winter (17 days avg.) has the shortest, reflecting typical travel planning cycles.
Recommendations for Hosts
- Use the overall average lead time (25 days) as a baseline for your pricing and availability strategy in Kediri.
- For September stays, consider implementing length-of-stay discounts or slightly higher rates for bookings made less than 42 days out to capitalize on advance planning.
- During December, focus on last-minute booking availability and promotions, as guests book with very short notice (11 days avg.).
- Target marketing efforts for the Spring season well in advance (at least 31 days) to capture early planners.
- Monitor your own booking lead times against these Kediri averages to identify opportunities for dynamic pricing adjustments.
Popular & Essential Airbnb Amenities in Kediri (2026)
Amenity Prevalence
Amenity Insights for Kediri
- Essential amenities in Kediri that guests expect include: Wifi, Air conditioning, Free parking on premises. Lacking these (any) could significantly impact bookings.
- Popular amenities like Kitchen, Pool, TV are common but not universal. Offering these can provide a competitive edge.
- A pool is a highly desired but not standard amenity, making it a key feature for attracting guests seeking leisure in Kediri.
Recommendations for Hosts
- Ensure your listing includes all essential amenities for Kediri: Wifi, Air conditioning, Free parking on premises.
- Prioritize adding missing essentials: Free parking on premises.
- Consider adding popular differentiators like Kitchen or Pool to increase appeal.
- Highlight unique or less common amenities you offer (e.g., hot tub, dedicated workspace, EV charger) in your listing description and photos.
- Regularly check competitor amenities in Kediri to stay competitive.
Kediri Airbnb Guest Demographics & Profile Analysis (2026)
Guest Profile Summary for Kediri
- The typical guest profile for Airbnb in Kediri consists of predominantly international visitors (91%), with top international origins including Australia, typically belonging to the Post-2000s (Gen Z/Alpha) group (50%), primarily speaking English or German.
- Domestic travelers account for 8.7% of guests.
- Key international markets include United States (12.2%) and Australia (12.2%).
- Top languages spoken are English (43%) followed by German (9.1%).
- A significant demographic segment is the Post-2000s (Gen Z/Alpha) group, representing 50% of guests.
Recommendations for Hosts
- Focus marketing internationally, particularly towards travelers from Australia.
- Tailor amenities and listing descriptions to appeal to the dominant Post-2000s (Gen Z/Alpha) demographic (e.g., highlight fast WiFi, smart home features, local guides).
- Highlight unique local experiences or amenities relevant to the primary guest profile.
- Consider seasonal promotions aligned with peak travel times for key origin markets.
Nearby Short-Term Rental Market Comparison
How does the Kediri Airbnb market stack up against its neighbors? Compare key performance metrics like average monthly revenue, ADR, and occupancy rates in surrounding areas to understand the broader regional STR landscape.
| Market | Active Properties | Monthly Revenue | Daily Rate | Avg. Occupancy |
|---|---|---|---|---|
| Pejeng | 11 | $6,447 | $575.53 | 43% |
| Padangaji | 16 | $6,120 | $300.47 | 64% |
| BATAS DESA BATU JANGKIH | 13 | $4,822 | $309.81 | 55% |
| Kecamatan Praya Barat | 30 | $3,939 | $414.82 | 39% |
| Bedulu | 34 | $3,142 | $269.69 | 42% |
| Tangkas | 16 | $2,982 | $276.74 | 30% |
| Pejeng Kawan | 105 | $2,909 | $237.67 | 41% |
| Pecatu | 1,743 | $2,845 | $229.93 | 48% |
| Uluwatu | 30 | $2,806 | $254.53 | 56% |
| Seminyak | 1,680 | $2,790 | $282.61 | 42% |