Munduk Village Airbnb Market Analysis 2026: Short Term Rental Data & Vacation Rental Statistics in Bali, Indonesia
Is Airbnb profitable in Munduk Village in 2026? Explore comprehensive Airbnb analytics for Munduk Village, Bali, Indonesia to uncover income potential. This 2026 STR market report for Munduk Village, based on AirROI data from February 2025 to January 2026, reveals key trends in the niche market of 28 active listings.
Whether you're considering an Airbnb investment in Munduk Village, optimizing your existing vacation rental, or exploring rental arbitrage opportunities, understanding the Munduk Village Airbnb data is crucial. Leveraging the low regulation environment is key to maximizing your short term rental income potential. Let's dive into the specifics.
Key Munduk Village Airbnb Performance Metrics Overview
Monthly Airbnb Revenue Variations & Income Potential in Munduk Village (2026)
Understanding the monthly revenue variations for Airbnb listings in Munduk Village is key to maximizing your short term rental income potential. Seasonality significantly impacts earnings. Our analysis, based on data from the past 12 months, shows that the peak revenue month for STRs in Munduk Village is typically July, while February often presents the lowest earnings, highlighting opportunities for strategic pricing adjustments during shoulder and low seasons. Explore the typical Airbnb income in Munduk Village across different performance tiers:
- Best-in-class properties (Top 10%) achieve $3,540+ monthly, often utilizing dynamic pricing and superior guest experiences.
- Strong performing properties (Top 25%) earn $900 or more, indicating effective management and desirable locations/amenities.
- Typical properties (Median) generate around $465 per month, representing the average market performance.
- Entry-level properties (Bottom 25%) see earnings around $155, often with potential for optimization.
Average Monthly Airbnb Earnings Trend in Munduk Village
Munduk Village Airbnb Occupancy Rate Trends (2026)
Maximize your bookings by understanding the Munduk Village STR occupancy trends. Seasonal demand shifts significantly influence how often properties are booked. Typically, Augustsees the highest demand (peak season occupancy), while January experiences the lowest (low season). Effective strategies, like adjusting minimum stays or offering promotions, can boost occupancy during slower periods. Here's how different property tiers perform in Munduk Village:
- Best-in-class properties (Top 10%) achieve 74%+ occupancy, indicating high desirability and potentially optimized availability.
- Strong performing properties (Top 25%) maintain 59% or higher occupancy, suggesting good market fit and guest satisfaction.
- Typical properties (Median) have an occupancy rate around 34%.
- Entry-level properties (Bottom 25%) average 13% occupancy, potentially facing higher vacancy.
Average Monthly Occupancy Rate Trend in Munduk Village
Average Daily Rate (ADR) Airbnb Trends in Munduk Village (2026)
Effective short term rental pricing strategy in Munduk Village involves understanding monthly ADR fluctuations. The Average Daily Rate (ADR) for Airbnb in Munduk Village typically peaks in August and dips lowest during February. Leveraging Airbnb dynamic pricing tools or strategies based on this seasonality can significantly boost revenue. Here's a look at the typical nightly rates achieved:
- Best-in-class properties (Top 10%) command rates of $89+ per night, often due to premium features or locations.
- Strong performing properties (Top 25%) achieve nightly rates of $64 or more.
- Typical properties (Median) charge around $38 per night.
- Entry-level properties (Bottom 25%) earn around $30 per night.
Average Daily Rate (ADR) Trend by Month in Munduk Village
Get Live Munduk Village Market Intelligence 👇

Explore Real-time Analytics
Airbnb Seasonality Analysis & Trends in Munduk Village (2026)
Peak Season (July, August, June)
- Revenue averages $1,411 per month
- Occupancy rates average 51.7%
- Daily rates average $59
Shoulder Season
- Revenue averages $1,061 per month
- Occupancy maintains around 37.6%
- Daily rates hold near $53
Low Season (January, February, December)
- Revenue drops to average $705 per month
- Occupancy decreases to average 24.4%
- Daily rates adjust to average $51
Seasonality Insights for Munduk Village
- The Airbnb seasonality in Munduk Village shows highly seasonal trends requiring careful strategy. While the sections above show seasonal averages, it's also insightful to look at the extremes:
- During the high season, the absolute peak month showcases Munduk Village's highest earning potential, with monthly revenues capable of climbing to $1,533, occupancy reaching a high of 54.7%, and ADRs peaking at $62.
- Conversely, the slowest single month of the year, typically falling within the low season, marks the market's lowest point. In this month, revenue might dip to $621, occupancy could drop to 21.6%, and ADRs may adjust down to $50.
- Understanding both the seasonal averages and these monthly peaks and troughs in revenue, occupancy, and ADR is crucial for maximizing your Airbnb profit potential in Munduk Village.
Seasonal Strategies for Maximizing Profit
- Peak Season: Maximize revenue through premium pricing and potentially longer minimum stays. Ensure high availability.
- Low Season: Offer competitive pricing, special promotions (e.g., extended stay discounts), and flexible cancellation policies. Target off-season travelers like remote workers or budget-conscious guests.
- Shoulder Seasons: Implement dynamic pricing that balances peak and low rates. Target weekend travelers or specific events. Offer slightly more flexible terms than peak season.
- Regularly analyze your own performance against these Munduk Village seasonality benchmarks and adjust your pricing and availability strategy accordingly.
Best Areas for Airbnb Investment in Munduk Village (2026)
Exploring the top neighborhoods for short-term rentals in Munduk Village? This section highlights key areas, outlining why they are attractive for hosts and guests, along with notable local attractions. Consider these locations based on your target guest profile and investment strategy.
| Neighborhood / Area | Why Host Here? (Target Guests & Appeal) | Key Attractions & Landmarks |
|---|---|---|
| Munduk Waterfall | A mesmerizing waterfall surrounded by lush tropical forests, perfect for nature lovers looking for a serene getaway. A popular destination for sightseeing and photography. | Munduk Waterfall, Gitgit Waterfall, Tamblingan Lake, Buyan Lake, Munduk Village Temple |
| Handara Golf & Resort | A picturesque golf course set in the mountains of Bali, known for its stunning views and lush greenery. Ideal for guests seeking leisure activities and picturesque scenery. | Handara Golf Course, Bali Handara Kosaido Country Club, Lake Buyan, Lake Tamblingan, Wanagiri Hidden Hills |
| Munduk Village | A quaint and charming village known for its coffee plantations and beautiful landscapes. Attracts travelers looking for local experiences and cultural immersion. | Munduk Coffee Plantations, Traditional Balinese cuisine, Local markets, Scenic rice terraces, Cultural workshops |
| Tamblingan Lake | A beautiful, tranquil lake surrounded by rich forests, ideal for kayaking and enjoying nature. Attracts adventure seekers and tranquility hunters alike. | Kayaking on Lake Tamblingan, Nature hikes, Bali's traditional temples, Bird watching, Scenic viewpoints |
| Banyumala Waterfall | A stunning waterfall located a bit off the beaten path, perfect for adventurous travelers. A great spot for swimming and relaxing in nature. | Banyumala Waterfall, Hidden trekking trails, Natural swimming pools, Photography spots, Surrounding rice fields |
| Wanagiri Hidden Hills | An Instagram-friendly spot famous for its scenic viewpoint and hanging swings over the hills. Great for social media enthusiasts and families. | Giant swings, Photo spots, Nature trails, Local eateries, Stunning panoramic views |
| Bali Eco Stay | An eco-friendly retreat located in the heart of Munduk known for its sustainable practices and beautiful natural surroundings. Appeals to eco-conscious travelers. | Eco-friendly accommodations, Nature hikes, Organic farm tours, Cultural experiences, Relaxation spots |
| Seririt Beach | A quiet and less touristy beach area, perfect for those looking to relax and enjoy Bali's coastal beauty without the crowds. | Seririt Beach, Local seafood restaurants, Snorkeling spots, Sunset views, Cultural exhibits |
Understanding Airbnb License Requirements & STR Laws in Munduk Village (2026)
While Munduk Village, Bali, Indonesia currently shows low STR regulations, specific Airbnb license requirements might still exist or change. Always verify the latest short term rental regulations and Airbnb license requirements directly with local government authorities for Munduk Village to ensure full compliance before hosting.
(Source: AirROI data, 2026, finding no licensed listings among those analyzed)
Top Performing Airbnb Properties in Munduk Village (2026)
Benchmark your potential! Explore examples of top-performing Airbnb properties in Munduk Villagebased on Trailing Twelve Month (TTM) revenue. Analyze their characteristics, revenue, occupancy rate, and ADR to understand what drives success in this market.
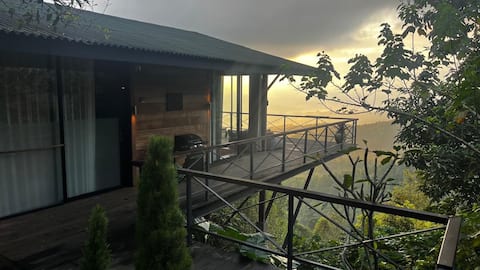
Waterfall Lodge Wood-Fire place, Sauna & Ice-Bath
Entire Place • 1 bedroom
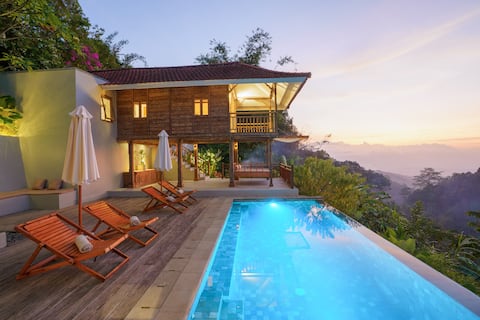
Ocean-Mountain View Villa | Waterfalls Munduk Lux
Private Room • 1 bedroom
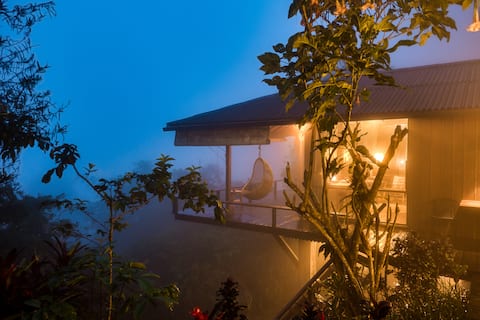
The Clove House in Munduk - Island in the Sky
Entire Place • 1 bedroom
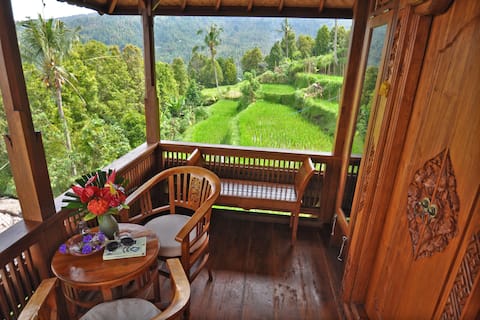
Lumbung Castle, Alam Dewata Villa Room
Entire Place • 1 bedroom
Bali villa
Entire Place • 2 bedrooms
Melanting
Private Room • N/A
Note: Performance varies based on location, size, amenities, seasonality, and management quality. Data reflects the past 12 months.
Top Performing Airbnb Hosts in Munduk Village (2026)
Learn from the best! This table showcases top-performing Airbnb hosts in Munduk Village based on the number of properties managed and estimated total revenue over the past year. Analyze their scale and performance metrics.
| Host Name | Properties | Grossing Revenue | Stay Reviews | Avg Rating |
|---|---|---|---|---|
| Erik | 1 | $54,389 | 25 | 5.00/5.0 |
| Sheila | 1 | $50,144 | 29 | 4.86/5.0 |
| Kadek & Daniel | 1 | $40,958 | 525 | 4.80/5.0 |
| Puri Sunny | 4 | $12,638 | 108 | 4.42/5.0 |
| Arya | 3 | $11,072 | 34 | 4.25/5.0 |
| Puri Lumbung Cottages Munduk | 1 | $9,177 | 4 | 5.00/5.0 |
| Pietro Giovanni | 1 | $9,019 | 36 | 4.56/5.0 |
| Putu | 1 | $8,171 | 96 | 4.86/5.0 |
| Komang | 1 | $8,055 | 359 | 4.59/5.0 |
| Ayudiah | 1 | $5,408 | 29 | 4.83/5.0 |
Analyzing the strategies of top hosts, such as their property selection, pricing, and guest communication, can offer valuable lessons for optimizing your own Airbnb operations in Munduk Village.
Dive Deeper: Advanced Munduk Village STR Market Data (2026)
Ready to unlock more insights? AirROI provides access to advanced metrics and comprehensive Airbnb data for Munduk Village. Explore detailed analytics beyond this report to refine your investment strategy, optimize pricing, and maximize your vacation rental profits.
Explore Advanced MetricsMunduk Village Short-Term Rental Market Composition (2026): Property & Room Types
Room Type Distribution
Property Type Distribution
Market Composition Insights for Munduk Village
- The Munduk Village Airbnb market composition is heavily skewed towards Private Room listings, which make up 82.1% of the 28 active rentals. This indicates strong guest preference for privacy and space.
- Looking at the property type distribution in Munduk Village, Hotel/Boutique properties are the most common (53.6%), reflecting the local real estate landscape.
- Houses represent a significant 28.6% portion, catering likely to families or larger groups.
- The presence of 53.6% Hotel/Boutique listings indicates integration with traditional hospitality.
- Smaller segments like unique stays, others (combined 7.2%) offer potential for unique stay experiences.
Munduk Village Airbnb Room Capacity Analysis (2026): Bedroom Distribution
Distribution of Listings by Number of Bedrooms
Room Capacity Insights for Munduk Village
- The dominant room capacity in Munduk Village is 1 bedroom listings, making up 60.7% of the market. This suggests a strong demand for properties suitable for couples or solo travelers.
- Together, 1 bedroom and 2 bedrooms properties represent 67.8% of the active Airbnb listings in Munduk Village, indicating a high concentration in these sizes.
- With over half the market (60.7%) consisting of studios or 1-bedroom units, Munduk Village is particularly well-suited for individuals or couples.
- Listings with 3+ bedrooms (7.2%) represent a smaller niche, potentially indicating an underserved market for larger group accommodations in Munduk Village.
Munduk Village Vacation Rental Guest Capacity Trends (2026)
Distribution of Listings by Guest Capacity
Guest Capacity Insights for Munduk Village
- The most common guest capacity trend in Munduk Village vacation rentals is listings accommodating 2 guests (46.4%). This suggests the primary traveler segment is likely couples or solo travelers.
- Properties designed for 2 guests and 3 guests dominate the Munduk Village STR market, accounting for 60.7% of listings.
- A significant 46.4% of listings cater specifically to 1-2 guests, highlighting strong demand from couples and solo travelers in Munduk Village.
- Listings for large groups (6+ guests) are relatively rare (3.6%), potentially indicating an opportunity for hosts targeting this segment in Munduk Village.
- On average, properties in Munduk Village are equipped to host 2.1 guests.
Munduk Village Airbnb Booking Patterns (2026): Available vs. Booked Days
Available Days Distribution
Booked Days Distribution
Booking Pattern Insights for Munduk Village
- The most common availability pattern in Munduk Village falls within the 271-366 days range, representing 60.7% of listings. This suggests many properties have significant open periods on their calendars.
- Approximately 78.6% of listings show high availability (181+ days open annually), indicating potential for increased bookings or specific owner usage patterns.
- For booked days, the 1-30 days range is most frequent in Munduk Village (39.3%), reflecting common guest stay durations or potential owner blocking patterns.
- A notable 21.4% of properties secure long booking periods (181+ days booked per year), highlighting successful long-term rental strategies or significant owner usage.
Munduk Village Airbnb Minimum Stay Requirements Analysis
Distribution of Listings by Minimum Night Requirement
1 Night
26 listings
92.9% of total
2 Nights
1 listings
3.6% of total
4-6 Nights
1 listings
3.6% of total
Key Insights
- The most prevalent minimum stay requirement in Munduk Village is 1 Night, adopted by 92.9% of listings. This highlights the market's preference for shorter, flexible bookings.
- A strong majority (96.5%) of the Munduk Village Airbnb data shows acceptance of very short stays (1-2 nights), indicating a dynamic, high-turnover market.
Recommendations
- Align with the market by considering a 1 Night minimum stay, as 92.9% of Munduk Village hosts use this setting.
- Adjust minimum nights based on seasonality – potentially shorter during low season and longer during peak demand periods in Munduk Village.
Munduk Village Airbnb Cancellation Policy Trends Analysis (2026)
Flexible
18 listings
64.3% of total
Moderate
3 listings
10.7% of total
Firm
6 listings
21.4% of total
Strict
1 listings
3.6% of total
Cancellation Policy Insights for Munduk Village
- The prevailing Airbnb cancellation policy trend in Munduk Village is Flexible, used by 64.3% of listings.
- The market strongly favors guest-friendly terms, with 75.0% of listings offering Flexible or Moderate policies. This suggests guests in Munduk Village may expect booking flexibility.
- Strict cancellation policies are quite rare (3.6%), potentially making listings with this policy less competitive unless justified by high demand or property type.
Recommendations for Hosts
- Consider adopting a Flexible policy to align with the 64.3% market standard in Munduk Village.
- Given the high prevalence of Flexible policies (64.3%), offering this can enhance booking appeal, especially during shoulder seasons.
- Using a Strict policy might deter some guests, as only 3.6% of listings use it. Evaluate if potential revenue protection outweighs possible lower booking rates.
- Regularly review your cancellation policy against competitors and market demand shifts in Munduk Village.
Munduk Village STR Booking Lead Time Analysis (2026)
Average Booking Lead Time by Month
Booking Lead Time Insights for Munduk Village
- The overall average booking lead time for vacation rentals in Munduk Village is 54 days.
- Guests book furthest in advance for stays during September (average 86 days), likely coinciding with peak travel demand or local events.
- The shortest booking windows occur for stays in February (average 18 days), indicating more last-minute travel plans during this time.
- Seasonally, Fall (76 days avg.) sees the longest lead times, while Winter (30 days avg.) has the shortest, reflecting typical travel planning cycles.
Recommendations for Hosts
- Use the overall average lead time (54 days) as a baseline for your pricing and availability strategy in Munduk Village.
- For September stays, consider implementing length-of-stay discounts or slightly higher rates for bookings made less than 86 days out to capitalize on advance planning.
- Target marketing efforts for the Fall season well in advance (at least 76 days) to capture early planners.
- Monitor your own booking lead times against these Munduk Village averages to identify opportunities for dynamic pricing adjustments.
Popular & Essential Airbnb Amenities in Munduk Village (2026)
Amenity Prevalence
Amenity Insights for Munduk Village
- Essential amenities in Munduk Village that guests expect include: Wifi. Lacking these (this) could significantly impact bookings.
- Popular amenities like Free parking on premises, Essentials, Shampoo are common but not universal. Offering these can provide a competitive edge.
Recommendations for Hosts
- Ensure your listing includes all essential amenities for Munduk Village: Wifi.
- Prioritize adding missing essentials: Wifi.
- Consider adding popular differentiators like Free parking on premises or Essentials to increase appeal.
- Highlight unique or less common amenities you offer (e.g., hot tub, dedicated workspace, EV charger) in your listing description and photos.
- Regularly check competitor amenities in Munduk Village to stay competitive.
Munduk Village Airbnb Guest Demographics & Profile Analysis (2026)
Guest Profile Summary for Munduk Village
- The typical guest profile for Airbnb in Munduk Village consists of predominantly international visitors (99%), with top international origins including United States, typically belonging to the Post-2000s (Gen Z/Alpha) group (50%), primarily speaking English or French.
- Domestic travelers account for 1.4% of guests.
- Key international markets include France (39.9%) and United States (12.8%).
- Top languages spoken are English (37.7%) followed by French (24.1%).
- A significant demographic segment is the Post-2000s (Gen Z/Alpha) group, representing 50% of guests.
Recommendations for Hosts
- Focus marketing internationally, particularly towards travelers from United States.
- Tailor amenities and listing descriptions to appeal to the dominant Post-2000s (Gen Z/Alpha) demographic (e.g., highlight fast WiFi, smart home features, local guides).
- Highlight unique local experiences or amenities relevant to the primary guest profile.
- Consider seasonal promotions aligned with peak travel times for key origin markets.
Nearby Short-Term Rental Market Comparison
How does the Munduk Village Airbnb market stack up against its neighbors? Compare key performance metrics like average monthly revenue, ADR, and occupancy rates in surrounding areas to understand the broader regional STR landscape.
| Market | Active Properties | Monthly Revenue | Daily Rate | Avg. Occupancy |
|---|---|---|---|---|
| Pejeng | 11 | $6,447 | $575.53 | 43% |
| Padangaji | 16 | $6,120 | $300.47 | 64% |
| BATAS DESA BATU JANGKIH | 13 | $4,822 | $309.81 | 55% |
| Kecamatan Praya Barat | 30 | $3,939 | $414.82 | 39% |
| Bedulu | 34 | $3,142 | $269.69 | 42% |
| Tangkas | 16 | $2,982 | $276.74 | 30% |
| Pejeng Kawan | 105 | $2,909 | $237.67 | 41% |
| Pecatu | 1,743 | $2,845 | $229.93 | 48% |
| Uluwatu | 30 | $2,806 | $254.53 | 56% |
| Seminyak | 1,680 | $2,790 | $282.61 | 42% |