Suwat, Bali Airbnb Market Data 2025: STR Report & Statistics
How much can you earn on Airbnb in Suwat, Bali? Based on AirROI's 2025 dataset (June 2024 – May 2025), the short answer is $15,255 per year — at a $223 nightly rate, 29.3% occupancy, and a N/A RevPAR.
With just 20 active listings, Suwat is a micro-market where selective demand that rewards strong listing quality and pricing strategy. Supply grew 150.0% year over year, and the market is recalibrating around a new competitive baseline. This is the stage where hosts who invest in amenities, guest experience, and dynamic pricing build durable advantages that compound as the market matures.
Regulation is high, and hosts should factor licensing costs and compliance timelines into their launch plan. In a market this size, differentiated listings with strong reviews can capture outsized returns relative to the competition.

Table of Contents [hide] [show]
What Are the Key Airbnb Metrics in Suwat?
In Suwat, the headline Airbnb metrics are $15,255 in average annual revenue,29.3% occupancy, $223 ADR, and $0 in RevPAR, and guests book about 42 days in advance.
How Much Do Airbnb Hosts Earn Monthly in Suwat?
Understanding the monthly revenue variations for Airbnb listings in Suwat is key to maximizing your short term rental income potential. Seasonality significantly impacts earnings. Our analysis, based on data from the past 12 months, shows that the peak revenue month for STRs in Suwat is typically September, while November often presents the lowest earnings, highlighting opportunities for strategic pricing adjustments during shoulder and low seasons. Explore the typical Airbnb income in Suwat across different performance tiers:
- Best-in-class properties (Top 10%) achieve $7,333+ monthly, often utilizing dynamic pricing and superior guest experiences.
- Strong performing properties (Top 25%) earn $3,068 or more, indicating effective management and desirable locations/amenities.
- Typical properties (Median) generate around $1,673 per month, representing the average market performance.
- Entry-level properties (Bottom 25%) see earnings around $512, often with potential for optimization.
Average Monthly Airbnb Earnings Trend in Suwat
What Is the Monthly Airbnb Occupancy Rate in Suwat?
Maximize your bookings by understanding the Suwat STR occupancy trends. Seasonal demand shifts significantly influence how often properties are booked. Typically, Octobersees the highest demand (peak season occupancy), while June experiences the lowest (low season). Effective strategies, like adjusting minimum stays or offering promotions, can boost occupancy during slower periods. Here's how different property tiers perform in Suwat:
- Best-in-class properties (Top 10%) achieve 70%+ occupancy, indicating high desirability and potentially optimized availability.
- Strong performing properties (Top 25%) maintain 44% or higher occupancy, suggesting good market fit and guest satisfaction.
- Typical properties (Median) have an occupancy rate around 24%.
- Entry-level properties (Bottom 25%) average 14% occupancy, potentially facing higher vacancy.
Average Monthly Occupancy Rate Trend in Suwat
What Is the Average Airbnb Nightly Rate in Suwat?
Effective short term rental pricing strategy in Suwat involves understanding monthly ADR fluctuations. The Average Daily Rate (ADR) for Airbnb in Suwat typically peaks in January and dips lowest during March. Leveraging Airbnb dynamic pricing tools or strategies based on this seasonality can significantly boost revenue. Here's a look at the typical nightly rates achieved:
- Best-in-class properties (Top 10%) command rates of $533+ per night, often due to premium features or locations.
- Strong performing properties (Top 25%) achieve nightly rates of $264 or more.
- Typical properties (Median) charge around $208 per night.
- Entry-level properties (Bottom 25%) earn around $139 per night.
Average Daily Rate (ADR) Trend by Month in Suwat
What Is the RevPAR for Airbnb in Suwat?
RevPAR in Suwat is currently N/A. Because RevPAR combines nightly rates with realized occupancy, it is one of the cleanest ways to compare how efficiently listings turn demand into revenue across the market.
- Entry-level properties (Bottom 25%) see N/A RevPAR.
- Typical properties (Median) generate N/A RevPAR.
- Strong performers (Top 25%) earn N/A RevPAR.
- Best-in-class (Top 10%) achieve N/A RevPAR.
Average Monthly RevPAR Trend in Suwat
RevPAR Insights for Suwat
- RevPAR peaks in Jan and bottoms out in Jan, mirroring the broader seasonal demand pattern and suggesting opportunities for dynamic pricing.
Recommendations for Hosts
- Track your own RevPAR monthly against these Suwat benchmarks. If your RevPAR falls below the median of N/A, examine whether low occupancy or low ADR is the primary drag.
- Use RevPAR rather than revenue alone when comparing properties of different sizes — it normalizes for available nights and gives a more accurate picture of performance.
Get Live Suwat Market Intelligence 👇
Explore Real-time Analytics
When Is the Peak Season for Airbnb in Suwat?
Suwat's peak Airbnb season falls in September, July, August, while the softest stretch is February, May, November. Overall, the market shows highly seasonal trends requiring careful strategy, which should guide pricing, minimum stays, and cash-flow planning.
Peak Season (September, July, August)
- Revenue averages $3,555 per month
- Occupancy rates average 42.0%
- Daily rates average $241
Shoulder Season
- Revenue averages $2,612 per month
- Occupancy maintains around 32.2%
- Daily rates hold near $243
Low Season (February, May, November)
- Revenue drops to average $1,704 per month
- Occupancy decreases to average 23.2%
- Daily rates adjust to average $245
Seasonality Insights for Suwat
- Airbnb seasonality in Suwat is pronounced. Revenue swings sharply between peak and low months, which means pricing strategy, minimum-stay settings, and cash reserves all need to account for extended slower periods.
- During the high season, the absolute peak month showcases Suwat's highest earning potential, with monthly revenues climbing to $4,242, occupancy reaching 51.0%, and ADRs peaking at $260.
- Conversely, the slowest single month marks the market's lowest point — revenue may dip to $1,311, occupancy could drop to 18.3%, and ADRs may adjust to $236.
- Lower occupancy paired with meaningful seasonality means hosts in Suwat need to maximize every peak-season booking and seriously consider whether off-season pricing adjustments or minimum-stay changes can capture incremental revenue.
Seasonal Strategies for Maximizing Profit
- Peak Season: Maximize revenue through premium pricing. In a high-regulation market like Suwat, ensure your permit covers the number of nights you plan to book — some jurisdictions cap annual rental days.
- Low Season: Offer competitive pricing, extended-stay discounts, and flexible cancellation policies. Target off-season travelers like remote workers, budget-conscious guests, and travelers with flexible schedules.
- Shoulder Seasons: Implement dynamic pricing that bridges peak and low rates. Target weekend travelers, local events, and business visitors. Slightly more flexible terms than peak season can help maintain occupancy without deep discounting.
- In a highly seasonal market like Suwat, building a cash reserve during the top months is essential for covering fixed costs during the slow period. Automated pricing tools can help capture demand shifts in real time.
Do You Need a License for Airbnb in Suwat?
Suwat, Bali, Indonesia has a high regulation classification, yet only 35% of listings show registration evidence. That gap between regulation on the books and compliance on the ground can shift quickly — municipalities often tighten enforcement in waves, putting unregistered operators at risk of fines or delisting. Always verify the latest short-term rental regulations and Airbnb license requirements directly with local government authorities for Suwat to ensure full compliance before hosting.
(Source: AirROI data, 2026, based on 35% licensed listings)
What Are the Best Neighborhoods for Airbnb in Suwat?
With a compact short-term rental market, Suwat gives early-mover hosts an advantage in the right neighborhoods. The areas listed below are where guest demand and local attractions converge — a useful lens for investors evaluating whether to enter this market and where to position their listing.
| Neighborhood / Area | Why Host Here? (Target Guests & Appeal) | Key Attractions & Landmarks |
|---|---|---|
| Ubud | Cultural heart of Bali, famous for its art scene, rice terraces, and wellness retreats. Ideal for tourists looking for a peaceful retreat surrounded by nature. | Ubud Monkey Forest, Tegallalang Rice Terrace, Campuhan Ridge Walk, Ubud Art Market, Puri Saren Royal Palace |
| Seminyak | Trendy and upscale beach area known for its vibrant nightlife, shopping, and dining options. A popular choice for tourists who want luxury and convenience. | Seminyak Beach, Eat Street, Petitenget Temple, Ku De Ta Beach Club, Seminyak Village |
| Canggu | Hip and laid-back coastal town popular among surfers and digital nomads. Offers a mix of beach life, cafes, and rice fields, attracting a younger crowd. | Echo Beach, Canggu Beach, Batu Bolong Beach, Finn's Beach Club, Old Man's Cafe |
| Kuta | Famous for its nightlife, shopping, and beach activities. A top destination for young travelers looking for excitement and entertainment. | Kuta Beach, Waterbom Bali, Beachwalk Shopping Center, Kuta Night Market, Poppies Lane |
| Nusa Dua | Luxury resort area with beautiful beaches, golf courses, and upscale amenities. Attracts families and honeymooners seeking a relaxing getaway. | Nusa Dua Beach, Bali Collection, Pasifika Museum, Geger Beach, Water Blow |
| Jimbaran | Known for its seafood restaurants on the beach and stunning sunsets. Ideal for those who appreciate a more laid-back experience with good dining options. | Jimbaran Beach, Jimbaran Fish Market, Rock Bar, Balangan Beach, Ayana Resort |
| Sanur | Quieter beach area with a laid-back vibe, known for its long sandy beach and beautiful sunrises. Great for families and retirees looking for a peaceful stay. | Sanur Beach, Bali Seaside Walking Path, Sindhu Beach, Le Mayeur Museum, Serangan Island |
| Amed | Scenic coastal village known for snorkeling and diving spots, as well as its relaxed atmosphere. Perfect for those looking to escape the crowds and enjoy nature. | Amed Beach, Jemeluk Bay, Tirta Gangga, Japanese Shipwreck Point, Amed Dive Center |
Because Suwat has a high regulation profile, confirming that short-term rental permits are available in your target neighborhood is a critical first step before committing to a property purchase. Regulation can vary at the neighborhood or district level even within the same city.
What Types of Properties Are on Airbnb in Suwat?
Room Type Distribution
Property Type Distribution
Market Composition Insights for Suwat
- The Suwat Airbnb market composition is heavily skewed towards Entire Home/Apt listings, which make up 70% of the 20 active rentals. This indicates strong guest preference for privacy and space.
- Looking at the property type distribution in Suwat, House properties are the most common (80%), reflecting the local real estate landscape.
- Houses represent a significant 80% portion, catering likely to families or larger groups.
Suwat Airbnb Room Capacity Analysis (2026): Bedroom Distribution
Distribution of Listings by Number of Bedrooms
Room Capacity Insights for Suwat
- The dominant room capacity in Suwat is 2 bedrooms listings, making up 40% of the market. This suggests a strong demand for properties suitable for couples or solo travelers.
- Together, 2 bedrooms and 1 bedroom properties represent 80.0% of the active Airbnb listings in Suwat, indicating a high concentration in these sizes.
Suwat Vacation Rental Guest Capacity Trends (2026)
Distribution of Listings by Guest Capacity
Guest Capacity Insights for Suwat
- The most common guest capacity trend in Suwat vacation rentals is listings accommodating 4 guests (40%). This suggests the primary traveler segment is likely small families or groups.
- Properties designed for 4 guests and 2 guests dominate the Suwat STR market, accounting for 70.0% of listings.
- 15.0% of properties accommodate 6+ guests, serving the market segment for larger families or group travel in Suwat.
- On average, properties in Suwat are equipped to host 3.6 guests.
What Amenities Do Airbnb Guests Expect in Suwat?
Amenity Prevalence
Amenity Insights for Suwat
- Essential amenities in Suwat that guests expect include: Hot water, Wifi, Free parking on premises, Air conditioning. Lacking these (any) could significantly impact bookings.
- Popular amenities like TV, Pool, Kitchen are common but not universal. Offering these can provide a competitive edge.
- A pool is a highly desired but not standard amenity, making it a key feature for attracting guests seeking leisure in Suwat.
Recommendations for Hosts
- Ensure your listing includes all essential amenities for Suwat: Hot water, Wifi, Free parking on premises, Air conditioning.
- Prioritize adding missing essentials: Air conditioning.
- Consider adding popular differentiators like TV or Pool to increase appeal.
- Highlight unique or less common amenities you offer (e.g., hot tub, dedicated workspace, EV charger) in your listing description and photos.
- Regularly check competitor amenities in Suwat to stay competitive.
Dive Deeper: Advanced Suwat STR Market Data (2026)
Ready to unlock more insights? AirROI provides access to advanced metrics and comprehensive Airbnb data for Suwat. Explore detailed analytics beyond this report to refine your investment strategy, optimize pricing, and maximize your vacation rental profits.
Explore Advanced MetricsSuwat Airbnb Guest Demographics & Profile Analysis (2026)
Guest Profile Summary for Suwat
- The typical guest profile for Airbnb in Suwat consists of predominantly international visitors (89%), with top international origins including Indonesia, typically belonging to the Post-2000s (Gen Z/Alpha) group (50%), primarily speaking English or French.
- Domestic travelers account for 10.8% of guests.
- Key international markets include United States (13.5%) and Indonesia (10.8%).
- Top languages spoken are English (48.6%) followed by French (8.6%).
- A significant demographic segment is the Post-2000s (Gen Z/Alpha) group, representing 50% of guests.
Recommendations for Hosts
- Focus marketing internationally, particularly towards travelers from Indonesia.
- Tailor amenities and listing descriptions to appeal to the dominant Post-2000s (Gen Z/Alpha) demographic (e.g., highlight fast WiFi, smart home features, local guides).
- Highlight unique local experiences or amenities relevant to the primary guest profile.
- Consider seasonal promotions aligned with peak travel times for key origin markets.
Suwat Airbnb Booking Patterns (2026): Available vs. Booked Days
Available Days Distribution
Booked Days Distribution
Booking Pattern Insights for Suwat
- The most common availability pattern in Suwat falls within the 271-366 days range, representing 80% of listings. This suggests many properties have significant open periods on their calendars.
- Approximately 90.0% of listings show high availability (181+ days open annually), indicating potential for increased bookings or specific owner usage patterns.
- For booked days, the 31-90 days range is most frequent in Suwat (45%), reflecting common guest stay durations or potential owner blocking patterns.
- A notable 10.0% of properties secure long booking periods (181+ days booked per year), highlighting successful long-term rental strategies or significant owner usage.
How Far in Advance Do Guests Book Airbnb in Suwat?
Average Booking Lead Time by Month
Booking Lead Time Insights for Suwat
- The overall average booking lead time for vacation rentals in Suwat is 42 days.
- Guests book furthest in advance for stays during May (average 102 days), likely coinciding with peak travel demand or local events.
- The shortest booking windows occur for stays in June (average 23 days), indicating more last-minute travel plans during this time.
- Seasonally, Spring (74 days avg.) sees the longest lead times, while Winter (36 days avg.) has the shortest, reflecting typical travel planning cycles.
Recommendations for Hosts
- Use the overall average lead time (42 days) as a baseline for your pricing and availability strategy in Suwat.
- For May stays, consider implementing length-of-stay discounts or slightly higher rates for bookings made less than 102 days out to capitalize on advance planning.
- Target marketing efforts for the Spring season well in advance (at least 74 days) to capture early planners.
- Monitor your own booking lead times against these Suwat averages to identify opportunities for dynamic pricing adjustments.
Suwat Airbnb Minimum Stay Requirements Analysis
Distribution of Listings by Minimum Night Requirement
1 Night
16 listings
80% of total
2 Nights
1 listings
5% of total
3 Nights
1 listings
5% of total
30+ Nights
2 listings
10% of total
Key Insights
- The most prevalent minimum stay requirement in Suwat is 1 Night, adopted by 80% of listings. This highlights the market's preference for shorter, flexible bookings.
- A strong majority (85.0%) of the Suwat Airbnb data shows acceptance of very short stays (1-2 nights), indicating a dynamic, high-turnover market.
Recommendations
- Align with the market by considering a 1 Night minimum stay, as 80% of Suwat hosts use this setting.
- Explore offering discounts for stays of 30+ nights to attract the 10% of the market seeking extended stays.
- Adjust minimum nights based on seasonality – potentially shorter during low season and longer during peak demand periods in Suwat.
Suwat Airbnb Cancellation Policy Trends Analysis (2026)
Flexible
1 listings
6.7% of total
Moderate
3 listings
20% of total
Strict
11 listings
73.3% of total
Cancellation Policy Insights for Suwat
- The prevailing Airbnb cancellation policy trend in Suwat is Strict, used by 73.3% of listings.
- A majority (73.3%) of hosts in Suwat utilize Firm or Strict policies, indicating a market where hosts prioritize booking security.
Recommendations for Hosts
- Consider adopting a Strict policy to align with the 73.3% market standard in Suwat.
- With 73.3% using Strict terms, this is a viable option in Suwat, particularly for high-value properties or during peak demand periods.
- Regularly review your cancellation policy against competitors and market demand shifts in Suwat.
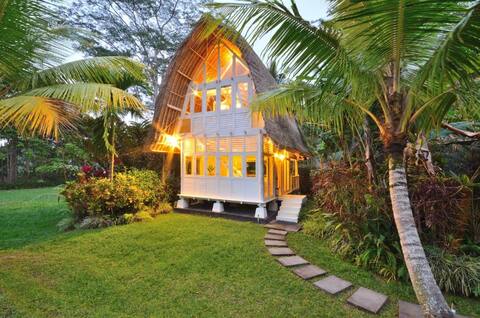
What Do the Top Airbnb Listings in Suwat Look Like?
Benchmark your potential! Explore examples of top-performing Airbnb properties in Suwatbased on Trailing Twelve Month (TTM) revenue. Analyze their characteristics, revenue, occupancy rate, and ADR to understand what drives success in this market.

Real peace & tranquility near Ubud
Entire Place • 6 bedrooms

UBUD Bamboo Villa 6 Jungle view 240m2
Entire Place • 3 bedrooms
Stunning View In Marvelous 1BR Villa Close to Ubud
Entire Place • 1 bedroom
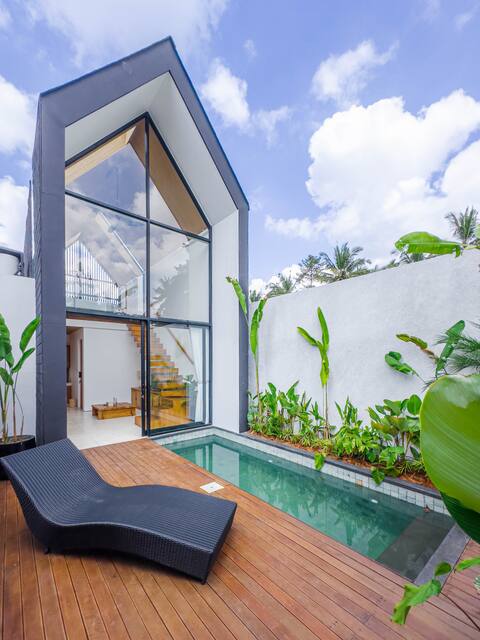
2 Bedroom Pool Villa
Entire Place • 2 bedrooms
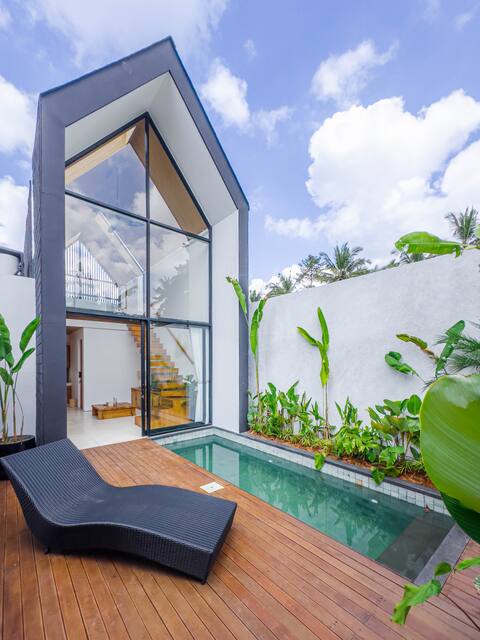
2 Bedroom Pool Villa
Entire Place • 2 bedrooms
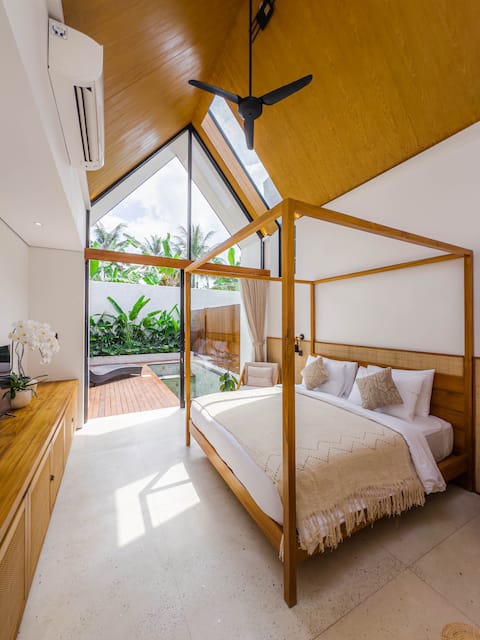
One Bedroom Pool Villa
Entire Place • 1 bedroom
Note: Performance varies based on location, size, amenities, seasonality, and management quality. Data reflects the past 12 months.
Who Are the Top Airbnb Hosts in Suwat?
Learn from the best! This table showcases top-performing Airbnb hosts in Suwat based on the number of properties managed and estimated total revenue over the past year. Analyze their scale and performance metrics.
| Host Name | Properties | Grossing Revenue | Stay Reviews | Avg Rating |
|---|---|---|---|---|
| Mailie | 1 | $110,062 | 36 | 4.92/5.0 |
| Agus | 8 | $78,771 | 1 | Not Rated |
| Gusti Ayu Eka Lehner | 1 | $48,835 | 16 | 5.00/5.0 |
| Kampung | 4 | $25,471 | 3 | Not Rated |
| Host #485995634 | 1 | $19,509 | 0 | Not Rated |
| Host #229488766 | 2 | $13,265 | 0 | Not Rated |
| Christene | 1 | $6,717 | 105 | 4.71/5.0 |
| Vic | 2 | $2,464 | 9 | 4.78/5.0 |
Analyzing the strategies of top hosts, such as their property selection, pricing, and guest communication, can offer valuable lessons for optimizing your own Airbnb operations in Suwat.
How Does Suwat's Airbnb Market Compare to Nearby Cities?
How does the Suwat Airbnb market stack up against its neighbors? Compare key performance metrics like average monthly revenue, ADR, and occupancy rates in surrounding areas to understand the broader regional STR landscape.
Compared with Padangaji, Suwat has 43 percentage points lower occupancy and about $98 lower ADR. That helps frame whether this market is winning more on demand, pricing, or both.
| Market | Active Properties | Monthly Revenue | Daily Rate | Avg. Occupancy |
|---|---|---|---|---|
| Padangaji | 15 | $6,920 | $321.08 | 72% |
| Pejeng | 13 | $4,078 | $396.14 | 45% |
| Pejeng Kawan | 127 | $2,940 | $228.85 | 44% |
| Bedulu | 40 | $2,929 | $257.72 | 41% |
| BATAS DESA BATU JANGKIH | 17 | $2,905 | $414.01 | 37% |
| Seminyak | 2,095 | $2,856 | $300.43 | 43% |
| Pecatu | 1,858 | $2,738 | $252.31 | 48% |
| Duda | 28 | $2,667 | $222.48 | 46% |
| Sanding | 17 | $2,543 | $374.92 | 32% |
| Dencarik | 54 | $2,516 | $187.32 | 47% |
Frequently Asked Questions About Airbnb in Suwat
These quick answers summarize the most common investor and operator questions using AirROI's latest market data for Suwat.
How much do Airbnb hosts make in Suwat?
Suwat hosts earn about $15,255 per year on average, with an average nightly rate of $223 and RevPAR of N/A. Those figures describe the typical revenue environment for active listings in Suwat, Bali, not the ceiling for the best operators. Source: AirROI 2025 data, Suwat market, June 2024 to May 2025.
What is the average Airbnb occupancy rate in Suwat?
The average Airbnb occupancy rate in Suwat is 29.3%. September is the strongest month and November is the softest, so hosts should expect demand to move meaningfully throughout the year rather than stay flat.
What is the average Airbnb daily rate in Suwat?
Listings in Suwat average $223 per night. The broader pricing spread also matters: lower-performing listings cluster closer to the lower quartiles, while premium homes can price materially above the city average when demand spikes or listing quality stands out.
How many Airbnb listings are active in Suwat?
Suwat currently has about 20 active Airbnb listings in AirROI's market dataset. That supply count helps explain how competitive the market is, how much depth there is for benchmarking, and whether the market behaves like a niche destination or a scaled urban market.
How strict are short-term rental regulations in Suwat?
AirROI currently classifies the short-term rental regulation level in Suwat as High. The dataset also shows about 35.0% of listings with registration evidence. That is a market signal, not legal advice, so hosts should still confirm current licensing and compliance rules locally before listing.
What is the RevPAR for Airbnb in Suwat?
RevPAR in Suwat is about N/A. That metric combines pricing and occupancy into one efficiency number, so it is often a better quick benchmark than ADR alone when investors want to compare how well listings convert nightly rates into realized revenue.
Is Airbnb profitable in Suwat?
Occupancy of 29.3% means Suwat is a more selective market. Profitability is achievable but requires careful cost management, premium positioning, or targeting longer stays to reduce turnover. Average annual revenue is $15,255, but individual returns depend on property type, location within the city, and the host's operating efficiency.
How far in advance do guests book Airbnb in Suwat?
The average booking lead time in Suwat is about 42 days — a moderate lead time that gives hosts planning visibility while still benefiting from last-minute bookings. Hosts who understand their market's booking cadence can adjust minimum stays and pricing windows accordingly.
What are the best neighborhoods for Airbnb in Suwat?
Based on AirROI's analysis, some of the top neighborhoods for short-term rentals in Suwat include Ubud, Seminyak, Canggu. Each area attracts different guest profiles — from business travelers to leisure visitors — so the best location depends on the property type and target audience a host is aiming for. See the full neighborhood breakdown above.
What type of property performs best on Airbnb in Suwat?
entire_home listings make up 70.0% of the active supply in Suwat. The most common configuration does not always mean the most profitable — operators who identify underserved property types or bedroom counts can sometimes outperform the market average by filling a gap in local supply.
How does Suwat compare to nearby Airbnb markets?
Among neighboring markets, Padangaji posts $83,043 in average annual revenue with 72.1% occupancy, compared to Suwat's $15,255 and 29.3%. Comparing nearby markets helps investors understand whether a destination's performance reflects local demand or broader regional trends.
When is the peak season for Airbnb in Suwat?
September is the highest-revenue month in Suwat, while November is the softest. The revenue spread between them indicates a highly seasonal market — revenue in the peak month is more than double the low month, so cash-flow planning and pricing automation are critical.
About AirROI Market Data
AirROI tracks over 20 million properties across 190+ countries and maintains 15+ years of historical performance data, making it one of the deepest Airbnb and STR intelligence platforms available. The analytics pipeline aggregates listing-level data monthly — revenue, occupancy, nightly rates, RevPAR, guest demographics, booking patterns, and competitive supply — so investors and operators can benchmark any market against its own history and against neighboring destinations.
Real estate investors, property managers, financial institutions, hedge funds, tourism boards, hospitality consultants, tech platforms, and academic researchers rely on AirROI data to underwrite acquisitions, optimize pricing, model macro trends, and conduct peer-reviewed research. Data is available through in-depth market reports like this one and the Airbnb API with 22 endpoints and an Airbnb MCP Server for AI agents.
AirROI proprietary analytics as of 2025-05-31. Metrics reflect trailing twelve-month aggregates from active listings. Revenue figures are market averages, not projections. Neighborhood descriptions are AI-generated and reviewed for accuracy. For full methodology, see the data methodology page.