Tuban Airbnb Market Analysis 2026: Short Term Rental Data & Vacation Rental Statistics in Bali, Indonesia
Is Airbnb profitable in Tuban in 2026? Explore comprehensive Airbnb analytics for Tuban, Bali, Indonesia to uncover income potential. This 2026 STR market report for Tuban, based on AirROI data from February 2025 to January 2026, reveals key trends in the niche market of 30 active listings.
Whether you're considering an Airbnb investment in Tuban, optimizing your existing vacation rental, or exploring rental arbitrage opportunities, understanding the Tuban Airbnb data is crucial. Leveraging the low regulation environment is key to maximizing your short term rental income potential. Let's dive into the specifics.
Key Tuban Airbnb Performance Metrics Overview
Monthly Airbnb Revenue Variations & Income Potential in Tuban (2026)
Understanding the monthly revenue variations for Airbnb listings in Tuban is key to maximizing your short term rental income potential. Seasonality significantly impacts earnings. Our analysis, based on data from the past 12 months, shows that the peak revenue month for STRs in Tuban is typically July, while November often presents the lowest earnings, highlighting opportunities for strategic pricing adjustments during shoulder and low seasons. Explore the typical Airbnb income in Tuban across different performance tiers:
- Best-in-class properties (Top 10%) achieve $638+ monthly, often utilizing dynamic pricing and superior guest experiences.
- Strong performing properties (Top 25%) earn $413 or more, indicating effective management and desirable locations/amenities.
- Typical properties (Median) generate around $195 per month, representing the average market performance.
- Entry-level properties (Bottom 25%) see earnings around $89, often with potential for optimization.
Average Monthly Airbnb Earnings Trend in Tuban
Tuban Airbnb Occupancy Rate Trends (2026)
Maximize your bookings by understanding the Tuban STR occupancy trends. Seasonal demand shifts significantly influence how often properties are booked. Typically, Julysees the highest demand (peak season occupancy), while November experiences the lowest (low season). Effective strategies, like adjusting minimum stays or offering promotions, can boost occupancy during slower periods. Here's how different property tiers perform in Tuban:
- Best-in-class properties (Top 10%) achieve 63%+ occupancy, indicating high desirability and potentially optimized availability.
- Strong performing properties (Top 25%) maintain 46% or higher occupancy, suggesting good market fit and guest satisfaction.
- Typical properties (Median) have an occupancy rate around 20%.
- Entry-level properties (Bottom 25%) average 10% occupancy, potentially facing higher vacancy.
Average Monthly Occupancy Rate Trend in Tuban
Average Daily Rate (ADR) Airbnb Trends in Tuban (2026)
Effective short term rental pricing strategy in Tuban involves understanding monthly ADR fluctuations. The Average Daily Rate (ADR) for Airbnb in Tuban typically peaks in September and dips lowest during May. Leveraging Airbnb dynamic pricing tools or strategies based on this seasonality can significantly boost revenue. Here's a look at the typical nightly rates achieved:
- Best-in-class properties (Top 10%) command rates of $110+ per night, often due to premium features or locations.
- Strong performing properties (Top 25%) achieve nightly rates of $72 or more.
- Typical properties (Median) charge around $39 per night.
- Entry-level properties (Bottom 25%) earn around $26 per night.
Average Daily Rate (ADR) Trend by Month in Tuban
Get Live Tuban Market Intelligence 👇

Explore Real-time Analytics
Airbnb Seasonality Analysis & Trends in Tuban (2026)
Peak Season (July, August, April)
- Revenue averages $455 per month
- Occupancy rates average 37.4%
- Daily rates average $59
Shoulder Season
- Revenue averages $302 per month
- Occupancy maintains around 28.6%
- Daily rates hold near $59
Low Season (January, October, November)
- Revenue drops to average $212 per month
- Occupancy decreases to average 19.6%
- Daily rates adjust to average $60
Seasonality Insights for Tuban
- The Airbnb seasonality in Tuban shows highly seasonal trends requiring careful strategy. While the sections above show seasonal averages, it's also insightful to look at the extremes:
- During the high season, the absolute peak month showcases Tuban's highest earning potential, with monthly revenues capable of climbing to $544, occupancy reaching a high of 43.4%, and ADRs peaking at $63.
- Conversely, the slowest single month of the year, typically falling within the low season, marks the market's lowest point. In this month, revenue might dip to $186, occupancy could drop to 16.1%, and ADRs may adjust down to $57.
- Understanding both the seasonal averages and these monthly peaks and troughs in revenue, occupancy, and ADR is crucial for maximizing your Airbnb profit potential in Tuban.
Seasonal Strategies for Maximizing Profit
- Peak Season: Maximize revenue through premium pricing and potentially longer minimum stays. Ensure high availability.
- Low Season: Offer competitive pricing, special promotions (e.g., extended stay discounts), and flexible cancellation policies. Target off-season travelers like remote workers or budget-conscious guests.
- Shoulder Seasons: Implement dynamic pricing that balances peak and low rates. Target weekend travelers or specific events. Offer slightly more flexible terms than peak season.
- Regularly analyze your own performance against these Tuban seasonality benchmarks and adjust your pricing and availability strategy accordingly.
Best Areas for Airbnb Investment in Tuban (2026)
Exploring the top neighborhoods for short-term rentals in Tuban? This section highlights key areas, outlining why they are attractive for hosts and guests, along with notable local attractions. Consider these locations based on your target guest profile and investment strategy.
| Neighborhood / Area | Why Host Here? (Target Guests & Appeal) | Key Attractions & Landmarks |
|---|---|---|
| Kuta | Famous for its surf beaches and vibrant nightlife, Kuta attracts tourists from all over the world looking for sun, sand, and partying. It's a prime location for lively beach activities and shopping. | Kuta Beach, Waterbom Bali, Beachwalk Shopping Center, Ground Zero Monument, Kuta Art Market, Legian Beach |
| Seminyak | Known for its upscale beach clubs, fine dining, and boutique shopping, Seminyak offers a more sophisticated vibe than Kuta, making it a favorite for couples and luxury travelers. | Seminyak Beach, Potato Head Beach Club, Seminyak Square, W Retreat and Spa, La Plancha, Eat Street |
| Canggu | A laid-back coastal village popular with surfers and digital nomads. Canggu boasts a vibrant cafe culture, yoga studios, and beautiful rice fields, appealing to a younger demographic. | Echo Beach, Canggu Beach, Tanah Lot Temple, Finns Beach Club, Bali Equestrian Centre, Batu Bolong Beach |
| Ubud | Culturally rich and set in the lush hills, Ubud is the heart of Bali's arts scene and wellness movement, known for its yoga retreats, tranquil rice terraces, and traditional crafts. | Ubud Monkey Forest, Tegallalang Rice Terraces, Ubud Art Market, Campuhan Ridge Walk, Goa Gajah Temple, Agung Rai Museum of Art |
| Nusa Dua | Geared towards luxury tourism, Nusa Dua features high-end resorts, pristine beaches, and world-class golf courses. It provides a peaceful experience away from the party scene. | Nusa Dua Beach, Geger Beach, Bali Collection Shopping Center, Water Blow Nusa Dua, Puja Mandala, Museum Pasifika |
| Jimbaran | Known for its seafood restaurants right on the beach, Jimbaran offers a relaxed atmosphere with stunning sunsets and a more local Balinese experience. | Jimbaran Beach, Jimbaran Bay Seafood, Jenggala Ceramics, Balangan Beach, Pura Ulun Siwi, Kuta Golf |
| Sanur | Ideal for families and those looking for a quieter beach experience. Sanur is known for its calm waters, beachside cafes, and a laid-back atmosphere while still being close to attractions. | Sanur Beach, Candi Dasa, Le Mayeur Museum, Sanur Night Market, Bajra Sandhi Monument, Mangrove Forest |
| Badung | Central area in Bali home to many attractions and convenient access to other popular destinations. Badung features a blend of the traditional and modern Balinese lifestyle. | Uluwatu Temple, Dreamland Beach, Bali Sea Turtle Society, Garuda Wisnu Kencana Cultural Park, Padang Padang Beach, Bingin Beach |
Understanding Airbnb License Requirements & STR Laws in Tuban (2026)
While Tuban, Bali, Indonesia currently shows low STR regulations, specific Airbnb license requirements might still exist or change. Always verify the latest short term rental regulations and Airbnb license requirements directly with local government authorities for Tuban to ensure full compliance before hosting.
(Source: AirROI data, 2026, finding no licensed listings among those analyzed)
Top Performing Airbnb Properties in Tuban (2026)
Benchmark your potential! Explore examples of top-performing Airbnb properties in Tubanbased on Trailing Twelve Month (TTM) revenue. Analyze their characteristics, revenue, occupancy rate, and ADR to understand what drives success in this market.
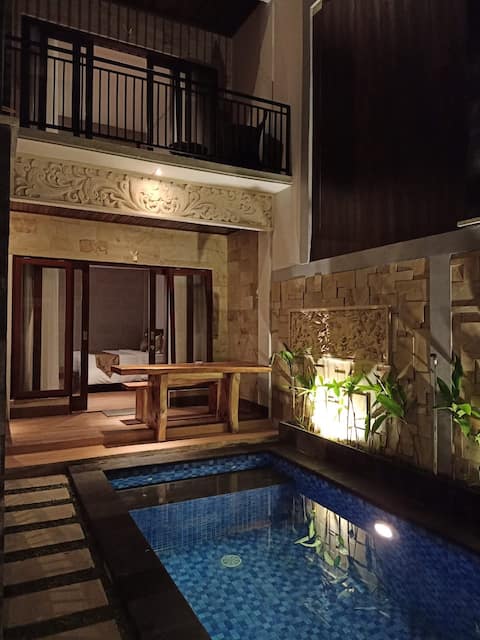
The Surya Kuta Villa ( Deluxe Two Bedroom Villa )
Entire Place • 2 bedrooms
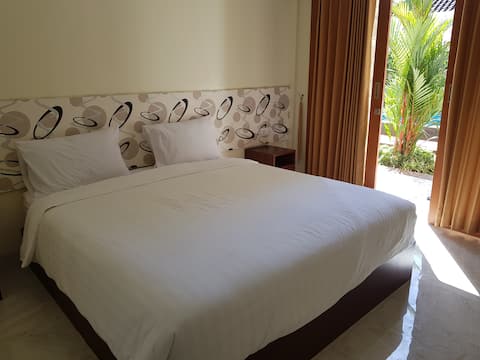
Praba Guesthouse
Private Room • 5 bedrooms
Diana Suite/Breakfast
Private Room • 1 bedroom
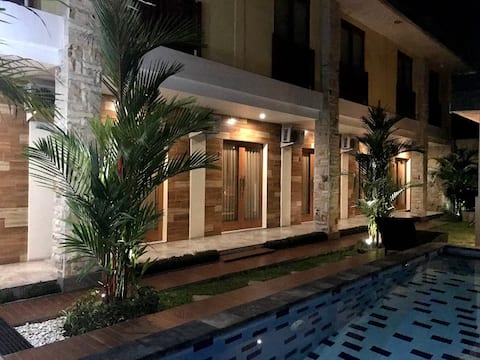
Mandala House 6 Adult Near Airport Bali
Private Room • 3 bedrooms

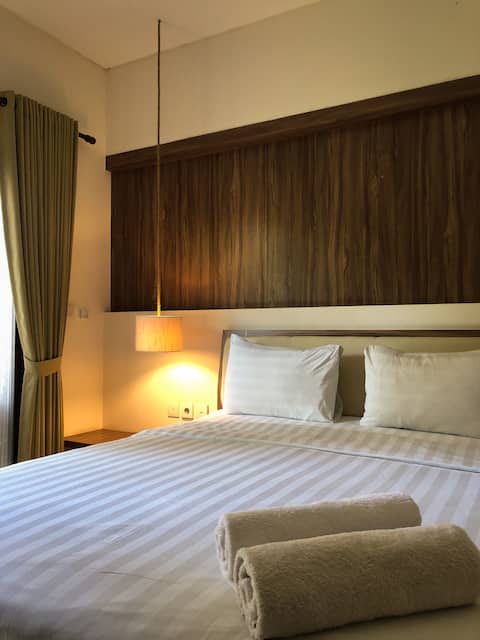
Cozy Stay near Airport, Self Check in, Walkable
Private Room • 1 bedroom
Cozy Stay near Airport, Self Check in, Walkable
Private Room • 1 bedroom
Note: Performance varies based on location, size, amenities, seasonality, and management quality. Data reflects the past 12 months.
Top Performing Airbnb Hosts in Tuban (2026)
Learn from the best! This table showcases top-performing Airbnb hosts in Tuban based on the number of properties managed and estimated total revenue over the past year. Analyze their scale and performance metrics.
| Host Name | Properties | Grossing Revenue | Stay Reviews | Avg Rating |
|---|---|---|---|---|
| Pandhu | 4 | $14,266 | 636 | 4.71/5.0 |
| Agustina | 1 | $12,227 | 47 | 4.32/5.0 |
| Famous Hotel | 5 | $9,857 | 155 | 4.13/5.0 |
| Malya | 3 | $9,346 | 385 | 4.77/5.0 |
| Host #127793171 | 1 | $6,760 | 69 | 4.43/5.0 |
| Arifin | 1 | $5,952 | 2 | Not Rated |
| Yany | 5 | $5,007 | 214 | 4.70/5.0 |
| Maya | 1 | $3,256 | 69 | 4.78/5.0 |
| Phuc An | 1 | $1,432 | 11 | 4.55/5.0 |
| Arifin | 1 | $846 | 1 | Not Rated |
Analyzing the strategies of top hosts, such as their property selection, pricing, and guest communication, can offer valuable lessons for optimizing your own Airbnb operations in Tuban.
Dive Deeper: Advanced Tuban STR Market Data (2026)
Ready to unlock more insights? AirROI provides access to advanced metrics and comprehensive Airbnb data for Tuban. Explore detailed analytics beyond this report to refine your investment strategy, optimize pricing, and maximize your vacation rental profits.
Explore Advanced MetricsTuban Short-Term Rental Market Composition (2026): Property & Room Types
Room Type Distribution
Property Type Distribution
Market Composition Insights for Tuban
- The Tuban Airbnb market composition is heavily skewed towards Private Room listings, which make up 86.7% of the 30 active rentals. This indicates strong guest preference for privacy and space.
- Looking at the property type distribution in Tuban, Hotel/Boutique properties are the most common (60%), reflecting the local real estate landscape.
- Houses represent a significant 23.3% portion, catering likely to families or larger groups.
- The presence of 60% Hotel/Boutique listings indicates integration with traditional hospitality.
Tuban Airbnb Room Capacity Analysis (2026): Bedroom Distribution
Distribution of Listings by Number of Bedrooms
Room Capacity Insights for Tuban
- The dominant room capacity in Tuban is 1 bedroom listings, making up 66.7% of the market. This suggests a strong demand for properties suitable for couples or solo travelers.
- Together, 1 bedroom and 5+ bedrooms properties represent 76.7% of the active Airbnb listings in Tuban, indicating a high concentration in these sizes.
- With over half the market (66.7%) consisting of studios or 1-bedroom units, Tuban is particularly well-suited for individuals or couples.
Tuban Vacation Rental Guest Capacity Trends (2026)
Distribution of Listings by Guest Capacity
Guest Capacity Insights for Tuban
- The most common guest capacity trend in Tuban vacation rentals is listings accommodating 2 guests (53.3%). This suggests the primary traveler segment is likely couples or solo travelers.
- Properties designed for 2 guests and 3 guests dominate the Tuban STR market, accounting for 60.0% of listings.
- A significant 56.6% of listings cater specifically to 1-2 guests, highlighting strong demand from couples and solo travelers in Tuban.
- On average, properties in Tuban are equipped to host 2.0 guests.
Tuban Airbnb Booking Patterns (2026): Available vs. Booked Days
Available Days Distribution
Booked Days Distribution
Booking Pattern Insights for Tuban
- The most common availability pattern in Tuban falls within the 271-366 days range, representing 73.3% of listings. This suggests many properties have significant open periods on their calendars.
- Approximately 90.0% of listings show high availability (181+ days open annually), indicating potential for increased bookings or specific owner usage patterns.
- For booked days, the 31-90 days range is most frequent in Tuban (40%), reflecting common guest stay durations or potential owner blocking patterns.
- A notable 10.0% of properties secure long booking periods (181+ days booked per year), highlighting successful long-term rental strategies or significant owner usage.
Tuban Airbnb Minimum Stay Requirements Analysis
Distribution of Listings by Minimum Night Requirement
1 Night
30 listings
100% of total
Key Insights
- The most prevalent minimum stay requirement in Tuban is 1 Night, adopted by 100% of listings. This highlights the market's preference for shorter, flexible bookings.
- A strong majority (100.0%) of the Tuban Airbnb data shows acceptance of very short stays (1-2 nights), indicating a dynamic, high-turnover market.
Recommendations
- Align with the market by considering a 1 Night minimum stay, as 100% of Tuban hosts use this setting.
- Adjust minimum nights based on seasonality – potentially shorter during low season and longer during peak demand periods in Tuban.
Tuban Airbnb Cancellation Policy Trends Analysis (2026)
Flexible
10 listings
34.5% of total
Moderate
12 listings
41.4% of total
Firm
1 listings
3.4% of total
Strict
6 listings
20.7% of total
Cancellation Policy Insights for Tuban
- The prevailing Airbnb cancellation policy trend in Tuban is Moderate, used by 41.4% of listings.
- The market strongly favors guest-friendly terms, with 75.9% of listings offering Flexible or Moderate policies. This suggests guests in Tuban may expect booking flexibility.
Recommendations for Hosts
- Consider adopting a Moderate policy to align with the 41.4% market standard in Tuban.
- Regularly review your cancellation policy against competitors and market demand shifts in Tuban.
Tuban STR Booking Lead Time Analysis (2026)
Average Booking Lead Time by Month
Booking Lead Time Insights for Tuban
- The overall average booking lead time for vacation rentals in Tuban is 32 days.
- Guests book furthest in advance for stays during December (average 52 days), likely coinciding with peak travel demand or local events.
- The shortest booking windows occur for stays in January (average 17 days), indicating more last-minute travel plans during this time.
- Seasonally, Summer (36 days avg.) sees the longest lead times, while Spring (28 days avg.) has the shortest, reflecting typical travel planning cycles.
Recommendations for Hosts
- Use the overall average lead time (32 days) as a baseline for your pricing and availability strategy in Tuban.
- For December stays, consider implementing length-of-stay discounts or slightly higher rates for bookings made less than 52 days out to capitalize on advance planning.
- Target marketing efforts for the Summer season well in advance (at least 36 days) to capture early planners.
- Monitor your own booking lead times against these Tuban averages to identify opportunities for dynamic pricing adjustments.
Popular & Essential Airbnb Amenities in Tuban (2026)
Amenity Prevalence
Amenity Insights for Tuban
- Essential amenities in Tuban that guests expect include: Air conditioning, Wifi, Free parking on premises. Lacking these (any) could significantly impact bookings.
- Popular amenities like TV, Shampoo, Pool are common but not universal. Offering these can provide a competitive edge.
- A pool is a highly desired but not standard amenity, making it a key feature for attracting guests seeking leisure in Tuban.
Recommendations for Hosts
- Ensure your listing includes all essential amenities for Tuban: Air conditioning, Wifi, Free parking on premises.
- Prioritize adding missing essentials: Free parking on premises.
- Consider adding popular differentiators like TV or Shampoo to increase appeal.
- Highlight unique or less common amenities you offer (e.g., hot tub, dedicated workspace, EV charger) in your listing description and photos.
- Regularly check competitor amenities in Tuban to stay competitive.
Tuban Airbnb Guest Demographics & Profile Analysis (2026)
Guest Profile Summary for Tuban
- The typical guest profile for Airbnb in Tuban consists of predominantly international visitors (98%), with top international origins including United States, typically belonging to the Post-2000s (Gen Z/Alpha) group (50%), primarily speaking English or French.
- Domestic travelers account for 1.9% of guests.
- Key international markets include Australia (18.1%) and United States (14.2%).
- Top languages spoken are English (46.4%) followed by French (10.4%).
- A significant demographic segment is the Post-2000s (Gen Z/Alpha) group, representing 50% of guests.
Recommendations for Hosts
- Focus marketing internationally, particularly towards travelers from United States.
- Tailor amenities and listing descriptions to appeal to the dominant Post-2000s (Gen Z/Alpha) demographic (e.g., highlight fast WiFi, smart home features, local guides).
- Highlight unique local experiences or amenities relevant to the primary guest profile.
- Consider seasonal promotions aligned with peak travel times for key origin markets.
Nearby Short-Term Rental Market Comparison
How does the Tuban Airbnb market stack up against its neighbors? Compare key performance metrics like average monthly revenue, ADR, and occupancy rates in surrounding areas to understand the broader regional STR landscape.
| Market | Active Properties | Monthly Revenue | Daily Rate | Avg. Occupancy |
|---|---|---|---|---|
| Pejeng | 11 | $6,447 | $575.53 | 43% |
| Padangaji | 16 | $6,120 | $300.47 | 64% |
| BATAS DESA BATU JANGKIH | 13 | $4,822 | $309.81 | 55% |
| Kecamatan Praya Barat | 30 | $3,939 | $414.82 | 39% |
| Bedulu | 34 | $3,142 | $269.69 | 42% |
| Tangkas | 16 | $2,982 | $276.74 | 30% |
| Pejeng Kawan | 105 | $2,909 | $237.67 | 41% |
| Pecatu | 1,743 | $2,845 | $229.93 | 48% |
| Uluwatu | 30 | $2,806 | $254.53 | 56% |
| Seminyak | 1,680 | $2,790 | $282.61 | 42% |