Bandar Lampung Airbnb Market Analysis 2026: Short Term Rental Data & Vacation Rental Statistics in Lampung, Indonesia
Is Airbnb profitable in Bandar Lampung in 2026? Explore comprehensive Airbnb analytics for Bandar Lampung, Lampung, Indonesia to uncover income potential. This 2026 STR market report for Bandar Lampung, based on AirROI data from February 2025 to January 2026, reveals key trends in the niche market of 30 active listings.
Whether you're considering an Airbnb investment in Bandar Lampung, optimizing your existing vacation rental, or exploring rental arbitrage opportunities, understanding the Bandar Lampung Airbnb data is crucial. Leveraging the low regulation environment is key to maximizing your short term rental income potential. Let's dive into the specifics.
Key Bandar Lampung Airbnb Performance Metrics Overview
Monthly Airbnb Revenue Variations & Income Potential in Bandar Lampung (2026)
Understanding the monthly revenue variations for Airbnb listings in Bandar Lampung is key to maximizing your short term rental income potential. Seasonality significantly impacts earnings. Our analysis, based on data from the past 12 months, shows that the peak revenue month for STRs in Bandar Lampung is typically July, while January often presents the lowest earnings, highlighting opportunities for strategic pricing adjustments during shoulder and low seasons. Explore the typical Airbnb income in Bandar Lampung across different performance tiers:
- Best-in-class properties (Top 10%) achieve $783+ monthly, often utilizing dynamic pricing and superior guest experiences.
- Strong performing properties (Top 25%) earn $332 or more, indicating effective management and desirable locations/amenities.
- Typical properties (Median) generate around $183 per month, representing the average market performance.
- Entry-level properties (Bottom 25%) see earnings around $90, often with potential for optimization.
Average Monthly Airbnb Earnings Trend in Bandar Lampung
Bandar Lampung Airbnb Occupancy Rate Trends (2026)
Maximize your bookings by understanding the Bandar Lampung STR occupancy trends. Seasonal demand shifts significantly influence how often properties are booked. Typically, Julysees the highest demand (peak season occupancy), while May experiences the lowest (low season). Effective strategies, like adjusting minimum stays or offering promotions, can boost occupancy during slower periods. Here's how different property tiers perform in Bandar Lampung:
- Best-in-class properties (Top 10%) achieve 42%+ occupancy, indicating high desirability and potentially optimized availability.
- Strong performing properties (Top 25%) maintain 26% or higher occupancy, suggesting good market fit and guest satisfaction.
- Typical properties (Median) have an occupancy rate around 15%.
- Entry-level properties (Bottom 25%) average 10% occupancy, potentially facing higher vacancy.
Average Monthly Occupancy Rate Trend in Bandar Lampung
Average Daily Rate (ADR) Airbnb Trends in Bandar Lampung (2026)
Effective short term rental pricing strategy in Bandar Lampung involves understanding monthly ADR fluctuations. The Average Daily Rate (ADR) for Airbnb in Bandar Lampung typically peaks in September and dips lowest during January. Leveraging Airbnb dynamic pricing tools or strategies based on this seasonality can significantly boost revenue. Here's a look at the typical nightly rates achieved:
- Best-in-class properties (Top 10%) command rates of $87+ per night, often due to premium features or locations.
- Strong performing properties (Top 25%) achieve nightly rates of $59 or more.
- Typical properties (Median) charge around $34 per night.
- Entry-level properties (Bottom 25%) earn around $22 per night.
Average Daily Rate (ADR) Trend by Month in Bandar Lampung
Get Live Bandar Lampung Market Intelligence 👇

Explore Real-time Analytics
Airbnb Seasonality Analysis & Trends in Bandar Lampung (2026)
Peak Season (July, October, November)
- Revenue averages $421 per month
- Occupancy rates average 24.5%
- Daily rates average $44
Shoulder Season
- Revenue averages $301 per month
- Occupancy maintains around 22.1%
- Daily rates hold near $44
Low Season (January, March, May)
- Revenue drops to average $227 per month
- Occupancy decreases to average 17.1%
- Daily rates adjust to average $43
Seasonality Insights for Bandar Lampung
- The Airbnb seasonality in Bandar Lampung shows highly seasonal trends requiring careful strategy. While the sections above show seasonal averages, it's also insightful to look at the extremes:
- During the high season, the absolute peak month showcases Bandar Lampung's highest earning potential, with monthly revenues capable of climbing to $459, occupancy reaching a high of 30.8%, and ADRs peaking at $46.
- Conversely, the slowest single month of the year, typically falling within the low season, marks the market's lowest point. In this month, revenue might dip to $216, occupancy could drop to 15.9%, and ADRs may adjust down to $43.
- Understanding both the seasonal averages and these monthly peaks and troughs in revenue, occupancy, and ADR is crucial for maximizing your Airbnb profit potential in Bandar Lampung.
Seasonal Strategies for Maximizing Profit
- Peak Season: Maximize revenue through premium pricing and potentially longer minimum stays. Ensure high availability.
- Low Season: Offer competitive pricing, special promotions (e.g., extended stay discounts), and flexible cancellation policies. Target off-season travelers like remote workers or budget-conscious guests.
- Shoulder Seasons: Implement dynamic pricing that balances peak and low rates. Target weekend travelers or specific events. Offer slightly more flexible terms than peak season.
- Regularly analyze your own performance against these Bandar Lampung seasonality benchmarks and adjust your pricing and availability strategy accordingly.
Best Areas for Airbnb Investment in Bandar Lampung (2026)
Exploring the top neighborhoods for short-term rentals in Bandar Lampung? This section highlights key areas, outlining why they are attractive for hosts and guests, along with notable local attractions. Consider these locations based on your target guest profile and investment strategy.
| Neighborhood / Area | Why Host Here? (Target Guests & Appeal) | Key Attractions & Landmarks |
|---|---|---|
| Kalianda | A coastal area known for its stunning beaches and resorts, making it perfect for vacation rentals. It offers access to beautiful scenery and water activities. | Krakatau Beach, Cahaya Batin Beach, Seluang Island, Ferry Harbor, Lake Ranau |
| Tanjung Karang | As the capital city of Lampung, Tanjung Karang offers urban convenience, shopping, and dining options, making it ideal for both local and international travelers. | Lampung Walk, Tanjung Karang Traditional Market, Museum Lampung, Tirtayasa Park |
| Bandar Lampung City Center | The bustling heart of Bandar Lampung with easy access to government offices, business centers, and entertainment facilities attracts many business travelers and tourists. | Siger Tower, Lungsu Park, Mall Boemi Kedaton, Masjid Agung Al-Furqon |
| Way Halim | A rapidly developing residential area with proximity to the city center, popular among families and business visitors looking for comfortable stays. | Way Halim Hospital, Gedung Pancasila, Halim Park |
| Ketapang | Known for its proximity to the beautiful nature of Lampung, ideal for eco-tourism and outdoor enthusiasts, attracting nature lovers. | Way Kambas National Park, Sukadana Beach, Taman Nasional Bukit Barisan |
| Raya Bumi | This area boasts a peaceful atmosphere and is close to natural attractions, making it attractive for those seeking a relaxing getaway. | Pesawaran Beach, Gunung Pesagi, Tanjung Setia Beach |
| Kota Gajah | A charming area known for its cultural heritage and local festivities, great for those wanting an authentic Indonesian experience away from the hustle. | Traditional Markets, Cultural Festivals, Local Cuisine |
| Lempung | An area that offers both natural beauty and urban amenities, catering to diverse travelers looking for both relaxation and convenience. | Reggio Beach, Waterfalls, Cultural Heritage Sites |
Understanding Airbnb License Requirements & STR Laws in Bandar Lampung (2026)
While Bandar Lampung, Lampung, Indonesia currently shows low STR regulations, specific Airbnb license requirements might still exist or change. Always verify the latest short term rental regulations and Airbnb license requirements directly with local government authorities for Bandar Lampung to ensure full compliance before hosting.
(Source: AirROI data, 2026, finding no licensed listings among those analyzed)
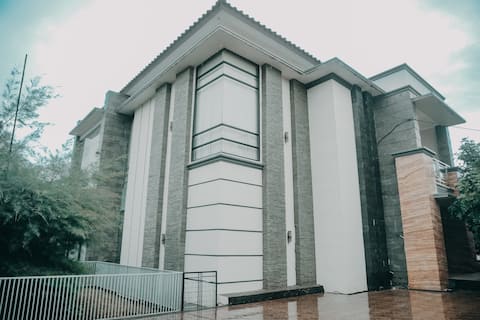
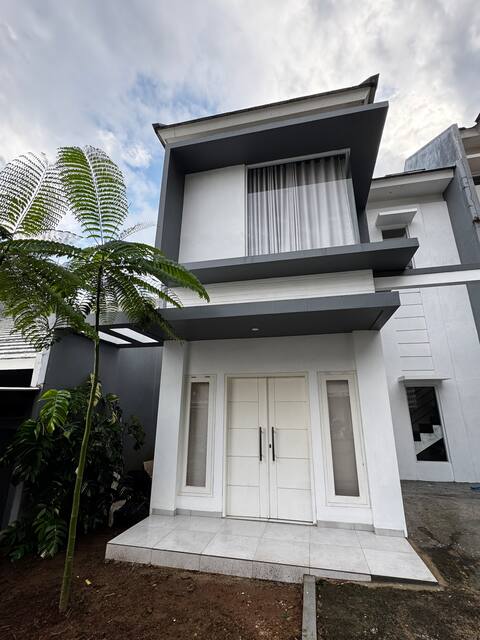
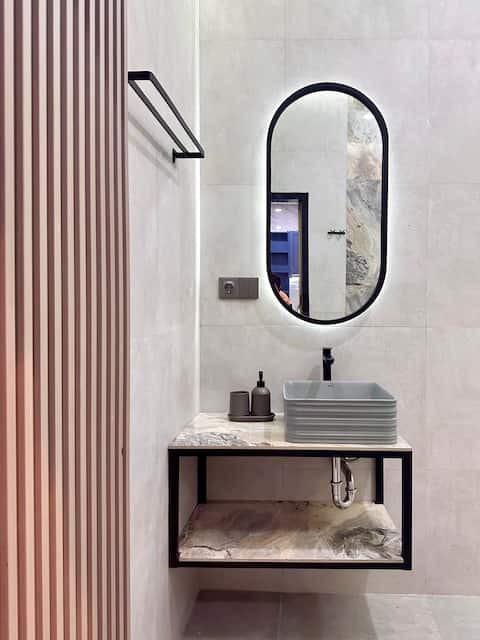
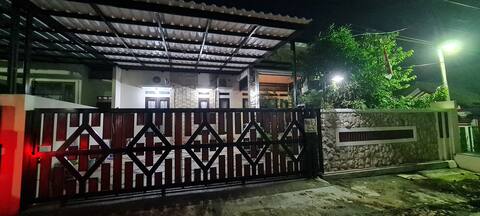
Top Performing Airbnb Properties in Bandar Lampung (2026)
Benchmark your potential! Explore examples of top-performing Airbnb properties in Bandar Lampungbased on Trailing Twelve Month (TTM) revenue. Analyze their characteristics, revenue, occupancy rate, and ADR to understand what drives success in this market.

Downtown Location Homestay
Entire Place • 5 bedrooms
Lampung Homestay: Villa Ratu
Entire Place • 3 bedrooms
Palapa Huis
Entire Place • 2 bedrooms
VillaLunik
Entire Place • 1 bedroom
Shazia House, Syariah, Cozy Home with Private Pool
Entire Place • 3 bedrooms
Vima Sharia Homestay 2
Entire Place • 3 bedrooms
Note: Performance varies based on location, size, amenities, seasonality, and management quality. Data reflects the past 12 months.
Top Performing Airbnb Hosts in Bandar Lampung (2026)
Learn from the best! This table showcases top-performing Airbnb hosts in Bandar Lampung based on the number of properties managed and estimated total revenue over the past year. Analyze their scale and performance metrics.
| Host Name | Properties | Grossing Revenue | Stay Reviews | Avg Rating |
|---|---|---|---|---|
| Ani | 2 | $16,121 | 32 | 4.97/5.0 |
| Imelda Rosita | 3 | $5,406 | 6 | 3.67/5.0 |
| Mentari | 1 | $5,175 | 8 | 4.50/5.0 |
| Mega | 3 | $4,558 | 12 | 4.94/5.0 |
| Achmad | 1 | $3,955 | 27 | 4.78/5.0 |
| VillaLunik | 1 | $3,066 | 5 | 5.00/5.0 |
| Dicki | 1 | $2,965 | 16 | 5.00/5.0 |
| Tu | 1 | $1,779 | 10 | 5.00/5.0 |
| Maria | 1 | $1,741 | 10 | 5.00/5.0 |
| Yadi Fakhruzein | 2 | $1,646 | 33 | 4.71/5.0 |
Analyzing the strategies of top hosts, such as their property selection, pricing, and guest communication, can offer valuable lessons for optimizing your own Airbnb operations in Bandar Lampung.
Dive Deeper: Advanced Bandar Lampung STR Market Data (2026)
Ready to unlock more insights? AirROI provides access to advanced metrics and comprehensive Airbnb data for Bandar Lampung. Explore detailed analytics beyond this report to refine your investment strategy, optimize pricing, and maximize your vacation rental profits.
Explore Advanced MetricsBandar Lampung Short-Term Rental Market Composition (2026): Property & Room Types
Room Type Distribution
Property Type Distribution
Market Composition Insights for Bandar Lampung
- The Bandar Lampung Airbnb market composition is heavily skewed towards Entire Home/Apt listings, which make up 70% of the 30 active rentals. This indicates strong guest preference for privacy and space.
- Looking at the property type distribution in Bandar Lampung, House properties are the most common (53.3%), reflecting the local real estate landscape.
- Houses represent a significant 53.3% portion, catering likely to families or larger groups.
- The presence of 13.3% Hotel/Boutique listings indicates integration with traditional hospitality.
- Smaller segments like others (combined 3.3%) offer potential for unique stay experiences.
Bandar Lampung Airbnb Room Capacity Analysis (2026): Bedroom Distribution
Distribution of Listings by Number of Bedrooms
Room Capacity Insights for Bandar Lampung
- The dominant room capacity in Bandar Lampung is 3 bedrooms listings, making up 26.7% of the market. This suggests a strong demand for properties suitable for families or small groups.
- Together, 3 bedrooms and 1 bedroom properties represent 53.4% of the active Airbnb listings in Bandar Lampung, indicating a high concentration in these sizes.
- A significant 40.1% of listings offer 3+ bedrooms, catering to larger groups and families seeking more space in Bandar Lampung.
Bandar Lampung Vacation Rental Guest Capacity Trends (2026)
Distribution of Listings by Guest Capacity
Guest Capacity Insights for Bandar Lampung
- The most common guest capacity trend in Bandar Lampung vacation rentals is listings accommodating 8+ guests (33.3%). This suggests the primary traveler segment is likely larger groups.
- Properties designed for 8+ guests and 3 guests dominate the Bandar Lampung STR market, accounting for 46.6% of listings.
- 46.6% of properties accommodate 6+ guests, serving the market segment for larger families or group travel in Bandar Lampung.
- On average, properties in Bandar Lampung are equipped to host 4.4 guests.
Bandar Lampung Airbnb Booking Patterns (2026): Available vs. Booked Days
Available Days Distribution
Booked Days Distribution
Booking Pattern Insights for Bandar Lampung
- The most common availability pattern in Bandar Lampung falls within the 271-366 days range, representing 96.7% of listings. This suggests many properties have significant open periods on their calendars.
- Approximately 96.7% of listings show high availability (181+ days open annually), indicating potential for increased bookings or specific owner usage patterns.
- For booked days, the 1-30 days range is most frequent in Bandar Lampung (56.7%), reflecting common guest stay durations or potential owner blocking patterns.
- A notable 3.3% of properties secure long booking periods (181+ days booked per year), highlighting successful long-term rental strategies or significant owner usage.
Bandar Lampung Airbnb Minimum Stay Requirements Analysis
Distribution of Listings by Minimum Night Requirement
1 Night
27 listings
90% of total
2 Nights
2 listings
6.7% of total
30+ Nights
1 listings
3.3% of total
Key Insights
- The most prevalent minimum stay requirement in Bandar Lampung is 1 Night, adopted by 90% of listings. This highlights the market's preference for shorter, flexible bookings.
- A strong majority (96.7%) of the Bandar Lampung Airbnb data shows acceptance of very short stays (1-2 nights), indicating a dynamic, high-turnover market.
Recommendations
- Align with the market by considering a 1 Night minimum stay, as 90% of Bandar Lampung hosts use this setting.
- Adjust minimum nights based on seasonality – potentially shorter during low season and longer during peak demand periods in Bandar Lampung.
Bandar Lampung Airbnb Cancellation Policy Trends Analysis (2026)
Flexible
17 listings
58.6% of total
Moderate
4 listings
13.8% of total
Firm
6 listings
20.7% of total
Strict
2 listings
6.9% of total
Cancellation Policy Insights for Bandar Lampung
- The prevailing Airbnb cancellation policy trend in Bandar Lampung is Flexible, used by 58.6% of listings.
- The market strongly favors guest-friendly terms, with 72.4% of listings offering Flexible or Moderate policies. This suggests guests in Bandar Lampung may expect booking flexibility.
- Strict cancellation policies are quite rare (6.9%), potentially making listings with this policy less competitive unless justified by high demand or property type.
Recommendations for Hosts
- Consider adopting a Flexible policy to align with the 58.6% market standard in Bandar Lampung.
- Given the high prevalence of Flexible policies (58.6%), offering this can enhance booking appeal, especially during shoulder seasons.
- Using a Strict policy might deter some guests, as only 6.9% of listings use it. Evaluate if potential revenue protection outweighs possible lower booking rates.
- Regularly review your cancellation policy against competitors and market demand shifts in Bandar Lampung.
Bandar Lampung STR Booking Lead Time Analysis (2026)
Average Booking Lead Time by Month
Booking Lead Time Insights for Bandar Lampung
- The overall average booking lead time for vacation rentals in Bandar Lampung is 18 days.
- Guests book furthest in advance for stays during January (average 34 days), likely coinciding with peak travel demand or local events.
- The shortest booking windows occur for stays in June (average 9 days), indicating more last-minute travel plans during this time.
- Seasonally, Winter (25 days avg.) sees the longest lead times, while Spring (14 days avg.) has the shortest, reflecting typical travel planning cycles.
Recommendations for Hosts
- Use the overall average lead time (18 days) as a baseline for your pricing and availability strategy in Bandar Lampung.
- For January stays, consider implementing length-of-stay discounts or slightly higher rates for bookings made less than 34 days out to capitalize on advance planning.
- During June, focus on last-minute booking availability and promotions, as guests book with very short notice (9 days avg.).
- Target marketing efforts for the Winter season well in advance (at least 25 days) to capture early planners.
- Monitor your own booking lead times against these Bandar Lampung averages to identify opportunities for dynamic pricing adjustments.
Popular & Essential Airbnb Amenities in Bandar Lampung (2026)
Amenity Prevalence
Amenity Insights for Bandar Lampung
- Essential amenities in Bandar Lampung that guests expect include: Air conditioning. Lacking these (this) could significantly impact bookings.
- Popular amenities like TV, Wifi, Kitchen are common but not universal. Offering these can provide a competitive edge.
- A pool is a highly desired but not standard amenity, making it a key feature for attracting guests seeking leisure in Bandar Lampung.
- Warning: Wifi is not universally provided but is considered essential globally. Ensure reliable Wifi is offered.
Recommendations for Hosts
- Ensure your listing includes all essential amenities for Bandar Lampung: Air conditioning.
- Consider adding popular differentiators like TV or Wifi to increase appeal.
- Highlight unique or less common amenities you offer (e.g., hot tub, dedicated workspace, EV charger) in your listing description and photos.
- Regularly check competitor amenities in Bandar Lampung to stay competitive.
Bandar Lampung Airbnb Guest Demographics & Profile Analysis (2026)
Guest Profile Summary for Bandar Lampung
- The typical guest profile for Airbnb in Bandar Lampung consists of primarily domestic travelers (74%), often arriving from nearby Jakarta, typically belonging to the Post-2000s (Gen Z/Alpha) group (50%), primarily speaking Indonesian or English.
- Domestic travelers account for 73.9% of guests.
- Key international markets include Indonesia (73.9%) and Australia (8.7%).
- Top languages spoken are Indonesian (47.6%) followed by English (38.1%).
- A significant demographic segment is the Post-2000s (Gen Z/Alpha) group, representing 50% of guests.
Recommendations for Hosts
- Target domestic marketing efforts towards travelers from Jakarta and Palembang.
- Tailor amenities and listing descriptions to appeal to the dominant Post-2000s (Gen Z/Alpha) demographic (e.g., highlight fast WiFi, smart home features, local guides).
- Highlight unique local experiences or amenities relevant to the primary guest profile.
- Consider seasonal promotions aligned with peak travel times for key origin markets.
Nearby Short-Term Rental Market Comparison
How does the Bandar Lampung Airbnb market stack up against its neighbors? Compare key performance metrics like average monthly revenue, ADR, and occupancy rates in surrounding areas to understand the broader regional STR landscape.
| Market | Active Properties | Monthly Revenue | Daily Rate | Avg. Occupancy |
|---|---|---|---|---|
| Kuta | 10 | $2,046 | $149.05 | 45% |
| Sukagalih | 13 | $1,306 | $157.45 | 34% |
| Citaringgul | 21 | $1,285 | $142.78 | 30% |
| Sukamanah | 12 | $1,151 | $148.28 | 28% |
| Leuwimalang | 15 | $1,109 | $203.41 | 20% |
| Sumur Batu | 50 | $1,026 | $180.80 | 21% |
| Megamendung | 28 | $962 | $216.09 | 19% |
| Cisarua | 97 | $877 | $186.16 | 20% |
| Gadog | 88 | $745 | $191.54 | 15% |
| Tugu Selatan | 14 | $727 | $136.37 | 23% |